A new version of ObserVIEW (2023.1) is now available for download. In this latest software release, add user-defined math expressions to time-domain graphs, access an updated graph layout, create advanced modal tests, and more.
Math Channels on Time Data
Filter and Combine Traces
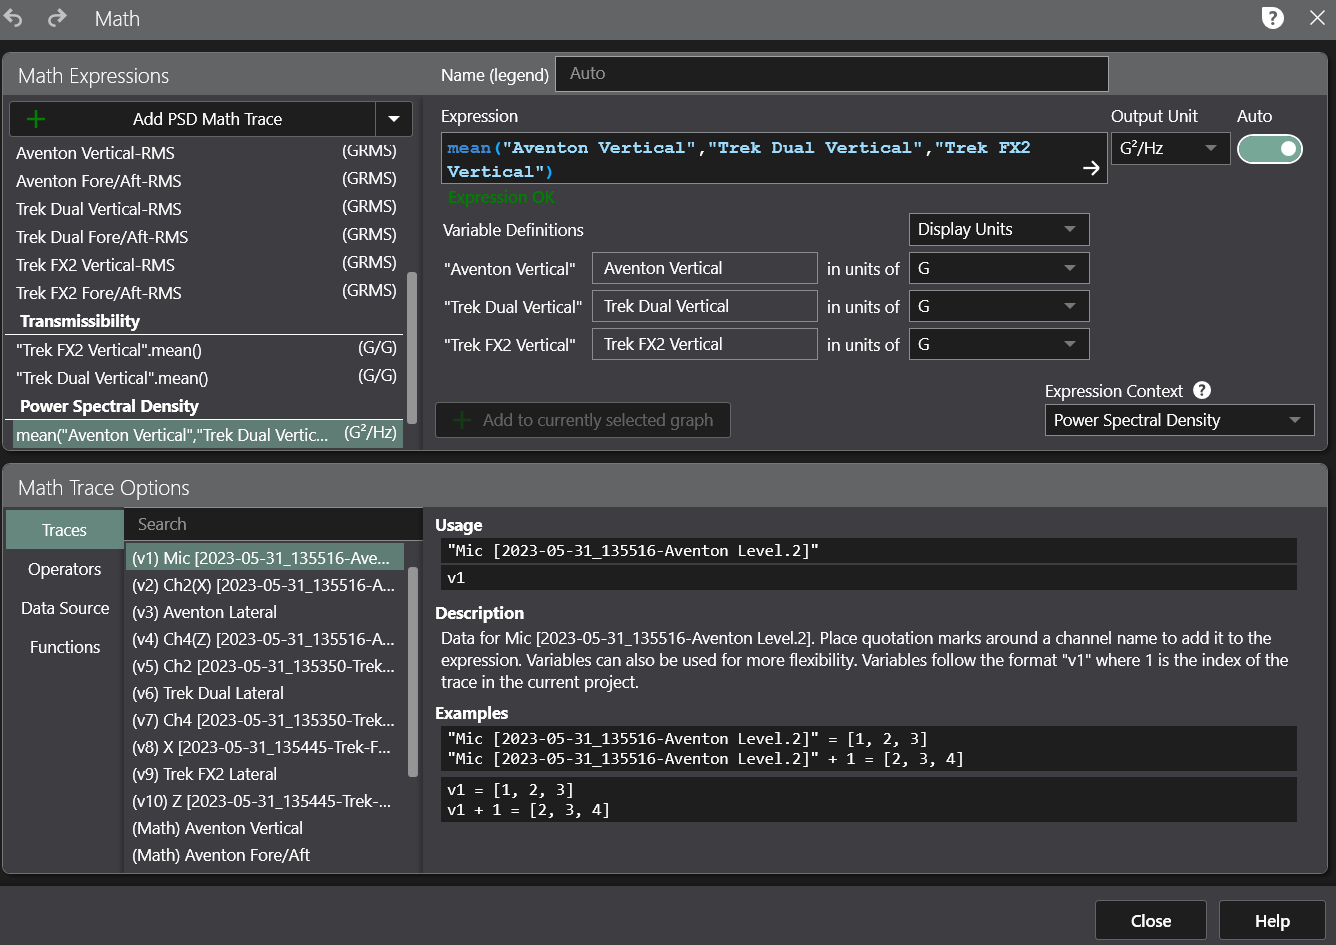
Create new channels on time-domain graphs by synthesizing a math expression or manipulating existing channels or traces.
In previous versions, the user could add a math trace to a frequency-domain graph to plot a user-defined math equation. The Math feature allows the user to implement custom math operations not defined by ObserVIEW’s current graph types. Example applications of math equations include enveloping data sets, averaging channels, or integrating/deriving data. In ObserVIEW 2023.1 and newer, math traces also work on time-domain graphs.
There is a slight difference between the resulting math operation on time and frequency graphs. Math operations on frequency-domain graphs are traces, and the user cannot derive an additional trace from them. The math operations on time-domain graphs are channels rather than traces. The user can create a frequency plot, such as a PSD or FFT, from a time-domain math channel.
Right-click any time or frequency-domain graph and select Add Math Trace to open the math equation editor dialog.
Graph Pages/Docking Layout
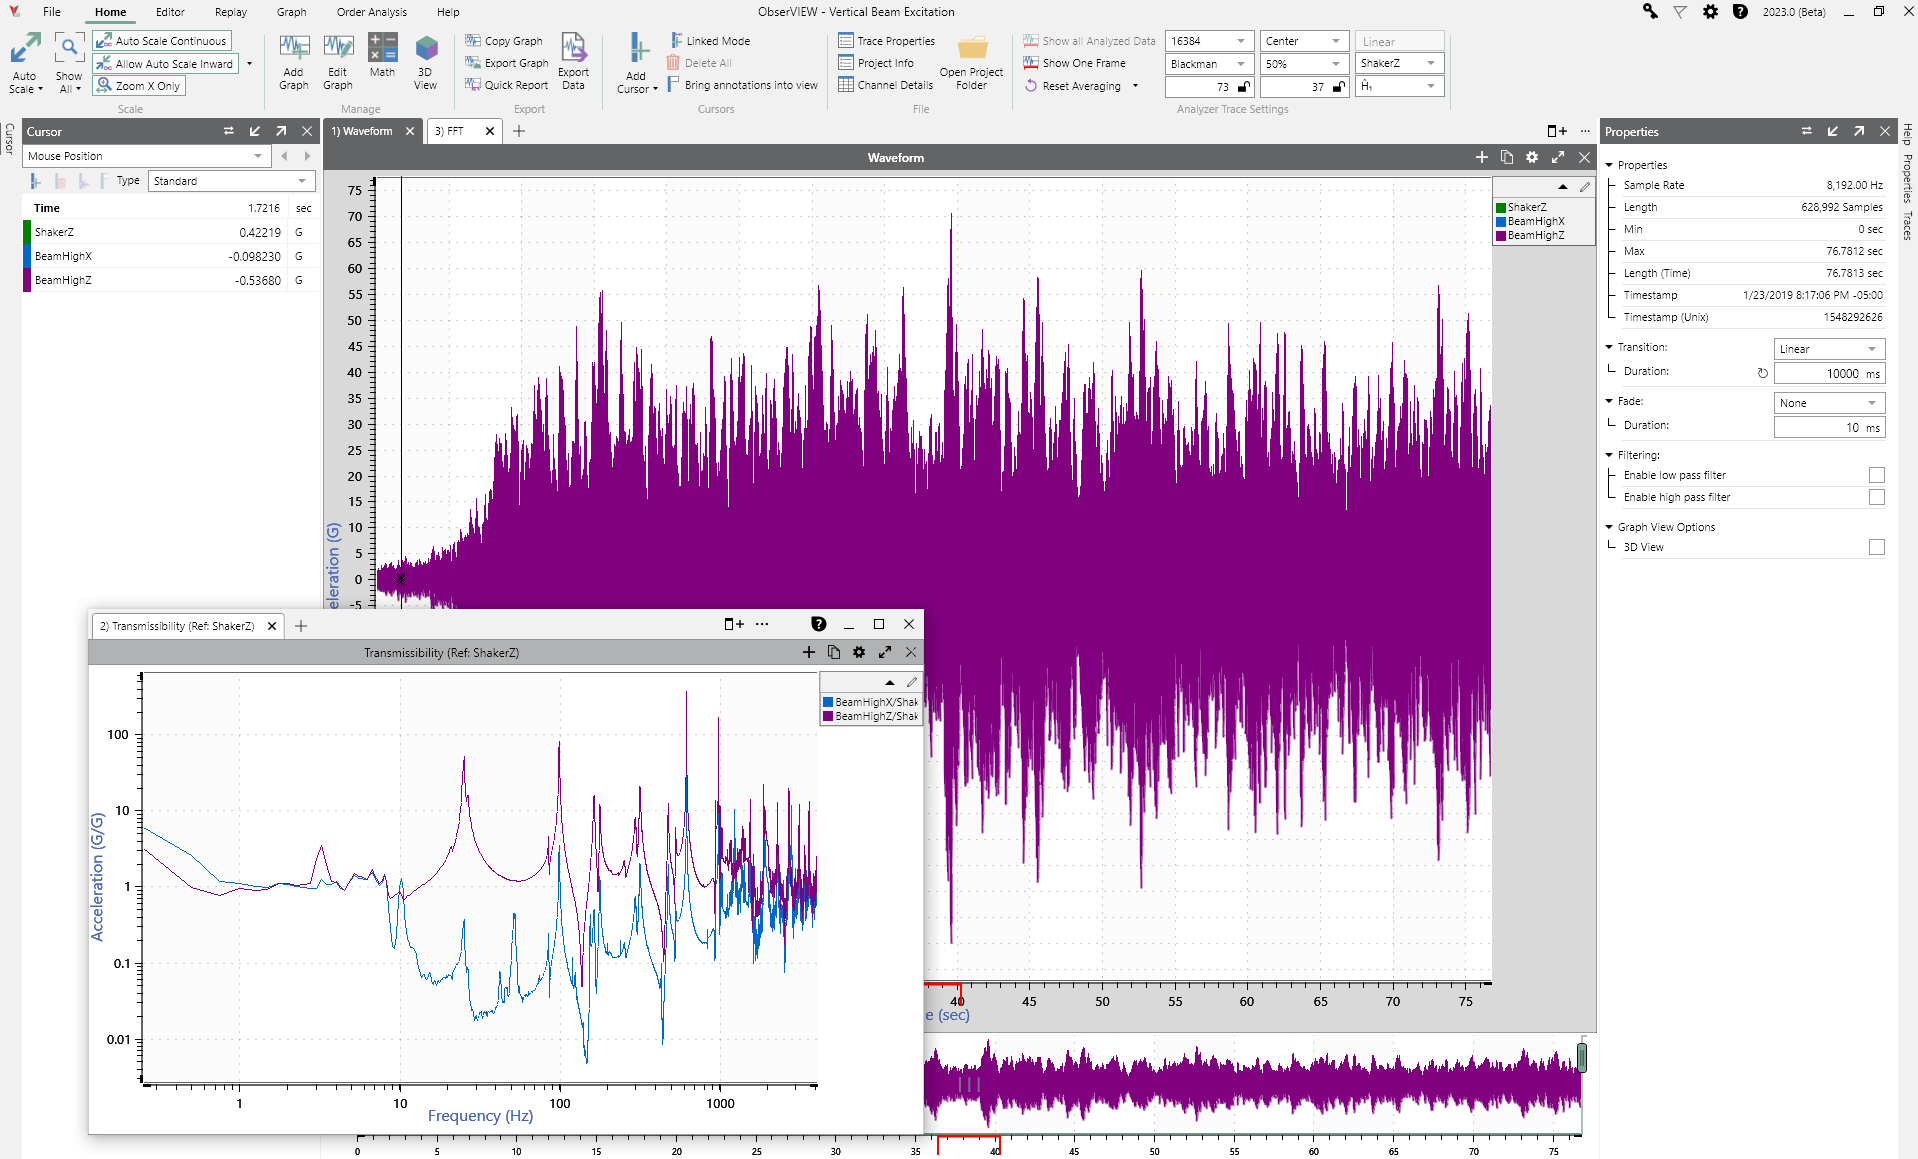
The software can now organize graphs as tabs in the main graph layout for better graph visibility and organization. Previously, the software would stack multiple graphs as rows/columns in the same view. This new layout allows users to create multiple pages of graphs, detach pages, and use multiple monitors.
Each graph tab has an individual pane view for cursors and traces. The tabs are not linked, so the user can make isolated changes to graphs in different tabs. The software also saves the main graph layout, so the user can re-open the project and pick it back up with their analysis.
The new graph layout is easier to navigate and organize. The user can click through, add, and re-order views quickly.
Modal Setup
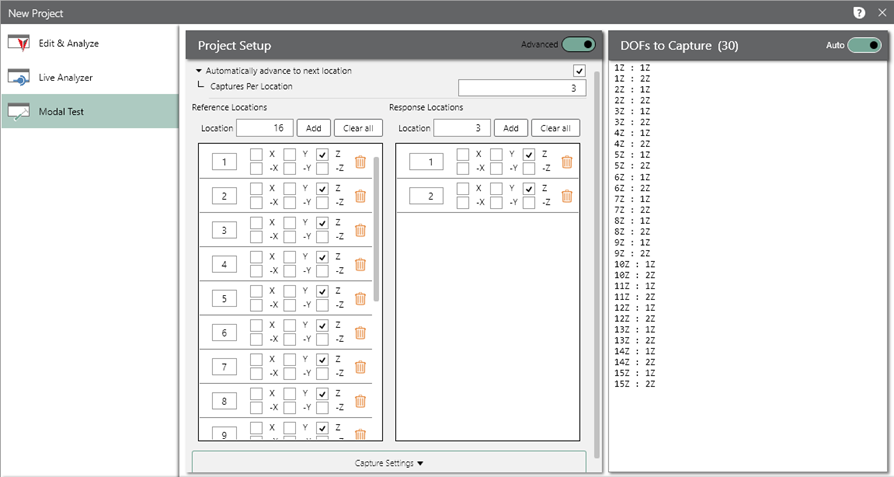
The Modal Testing software now includes an advanced project type in addition to the roving hammer and roving accelerometer options.
The advanced option lets the user define the number of response and reference locations and select different response locations/directions for each reference. Essentially, it allows combining the roving hammer and roving accelerometer methods in one project.
After the user creates the project, the sequencer scans the user-defined degrees of freedom (DOF) and determines if any have the same response location/direction. If so, it will prompt the user to strike in the appropriate locations, effectively collecting the response of multiple DOFs simultaneously.
With the advanced option, the user can collect fewer responses and generate mode shapes quicker with the ease of roving the hammer.
GPS Timestamp Compensation
The ObserVIEW software applies a timestamp to VFW recordings based on the ObserVR1000’s system clock. Clock drift, which occurs when a clock does not run at the same rate as the reference, can lower the accuracy of the timestamp.
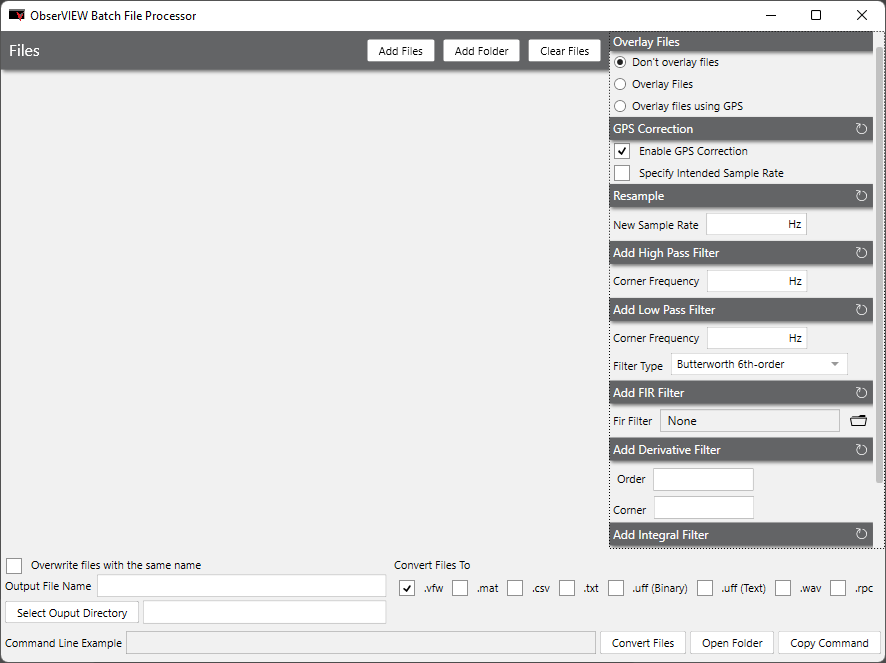
In ObserVIEW 2023.1 and newer, the user can resample and align saved data to GPS atomic time to compensate for system clock drift and make overlaying data between acquisition devices extremely precise. The option to align a single file with .nmea is in the Batch File Processor dialog.
This new feature allows the user to synchronize equipment with greater accuracy. The software also has a more precise VFW recording timestamp in this version.
Overlay Recordings Using GPS Timestamp
With the GPS timestamp capabilities of version 2023.1 and newer, the user can overlay recordings with more exact data. The “Overlay files using GPS” option resamples and aligns files in the Batch File Processor dialog. Overlaid waveforms can help identify similarities and relationships between waveforms.
Note: the trim and zero-pad options are currently unavailable with GPS overlay.
File Import Dialog
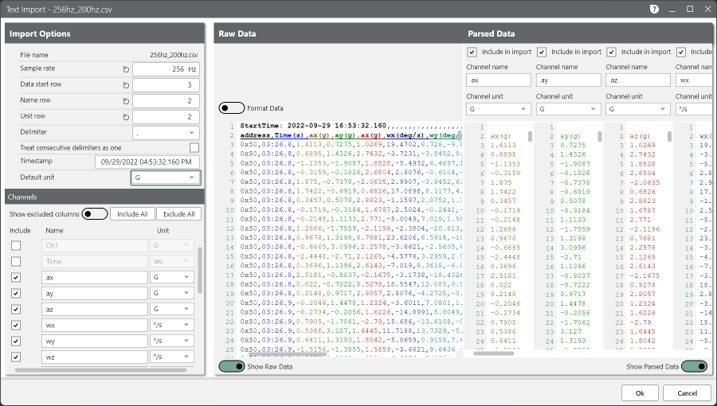
ObserVIEW 2023.1 includes a new import user interface for .txt, .csv, and other text-based files. Users can analyze files from any data acquisition system in the ObserVIEW analysis software. The text import feature supports most text and CSV files, allowing them to apply the powerful features of ObserVIEW regardless of hardware.
With this interface, the user can:
- Define the waveform’s sample rate
- Define the units for each channel or apply the same one to all
- Exclude channels from the analysis
- Define the text file’s delimiter
- Toggle between raw data and parsed data
User-defined Units
If a user requires a measurement unit that is not pre-set in the software, they can add it to the Display Units list. The software includes helpful scaling functions to define a new unit. Users can edit/add/delete a user-defined unit at any time in the Settings dialog.
Additional Features
- Insert cursors on spectrograms
- Analyze tachometer channels in Live Analyzer
- Add RMS cursor to pasted traces
- Graph all traces on the same y-axis, regardless of unit
- Insert/edit annotation text to graphs (Ctrl+Ins)
- Time history statistical traces to identify trends, evaluate stationarity, kurtosis, maximum acceleration, etc.
- Plot GPS data over time
- Output function generator for sine, sine chirp, random, triangle, and square waves (transient and continuous) to drive a shaker open loop with different signals
Technology Previews
Test out features in development before the next release.
- Rotate all graph types
- Hour:Minute:Second number format for x-axis
- Probability density function

