Automotive manufacturers perform noise, vibration, and harshness (NVH) testing to optimize vehicle performance and uphold a standard of passenger comfort. In addition to material fatigue, the excessive vibration of components can produce high-frequency noise and physical discomfort. NVH testing includes vibration test control to simulate the field environment and identify behaviors that may affect user experience.
NVH testing encompasses many test and analysis methods. When studying vibration, engineers typically encounter mechanical noise created by an object in motion. Their test solutions often involve replicating the field environment and identifying vibration behavior, such as resonance.
NVH Testing Solutions
Vibration Testing
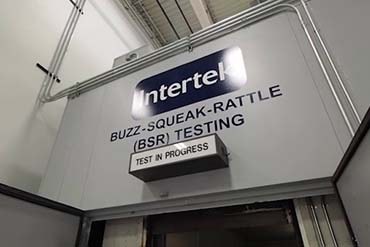
Buzz, squeak, rattle (BSR) testing is often included in an NVH testing plan.
Vibration test control systems run a test profile on a shaker table to qualify components and simulate the field environment. An NVH test plan may include a vibration test in an acoustic chamber to isolate the noise. The test system must run quietly enough to avoid interference, and engineers must select appropriate auxiliary equipment, such as the cooling system and sensors, for accurate test results.
Engineers want to be as accurate as possible when simulating the field environment in the lab. Developing a vibration test profile from recorded data will likely produce more realistic results than a standard test profile.
Resonance
Engineers identify a component’s resonant frequency early in the development cycle because resonance is a major contributor to failure. Resonance occurs when an external force vibrates at the same frequency as a component’s natural frequency, which amplifies the vibration amplitude.
Often, tests are run at the resonant frequency to determine the component’s maximum fatigue until failure. Similarly, acoustic test engineers may run a resonance dwell to simulate the most extreme amplitude levels, which, in turn, has more potential to produce noise.
Modal Testing
 NVH testing often involves some form of computer-aided design or modeling. Modal analysis maps a component’s deflection patterns and uses test data to simulate its input response. Engineers can use modal testing data like damping and natural frequency to predict NVH patterns.
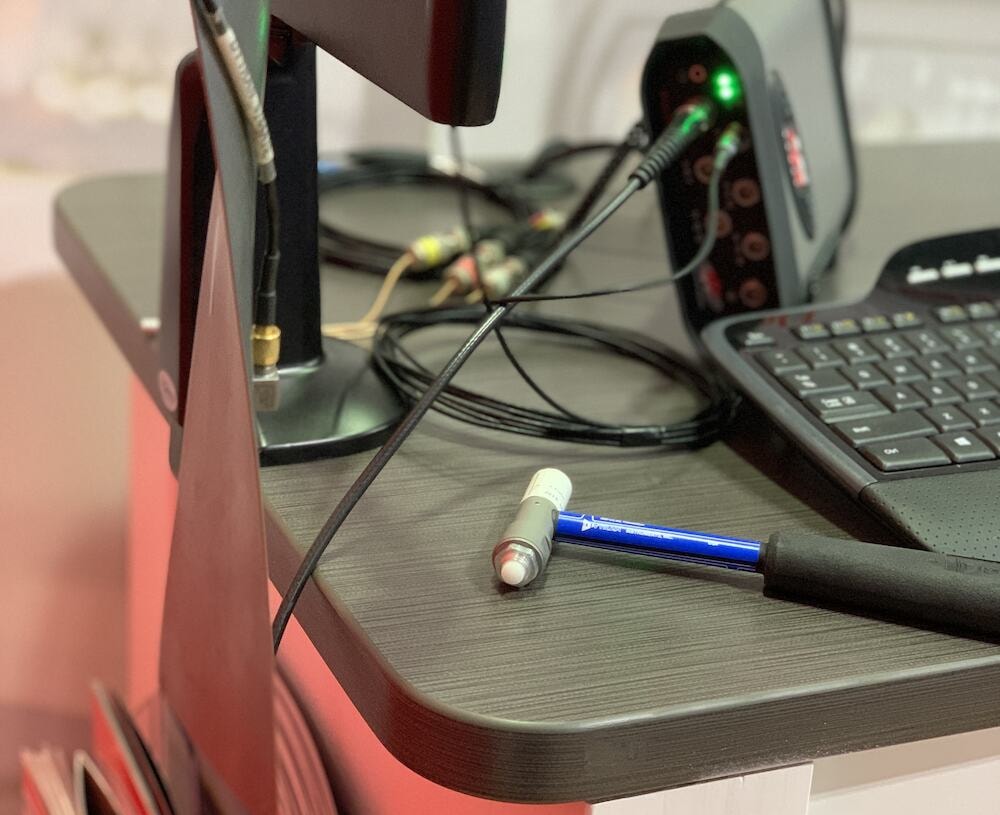
The ObserVIEW Modal Testing software collects responses to excitation with an impact hammer. The program calculates an average response for each hit location and generates a smooth transfer function (FRF). From there, the data can be exported to a modal software such as MEscope for further analysis.
Field Data Recording
Whether performing vibration control in the lab or creating digital models, field data can help confirm that a test reflects the device under test’s (DUT) end-use environment. When a test profile reflects the DUT’s application, the possibility of an unsuspected failure in the customer’s hands lessens.
Gathering field data is not complicated when you have the right equipment. The ObserVR1000 is a portable data acquisition system that allows engineers to record and analyze data quickly, saving time and reducing product development costs.
Noise and Vibration Data Analysis
NVH testing often occurs during the assembly of a vehicle but can encompass the complete construction, an individual component, or anywhere in between. NVH test solutions identify and address vehicle noise and vibration, and many international standards require some variation of this type of testing.
FFT Analysis
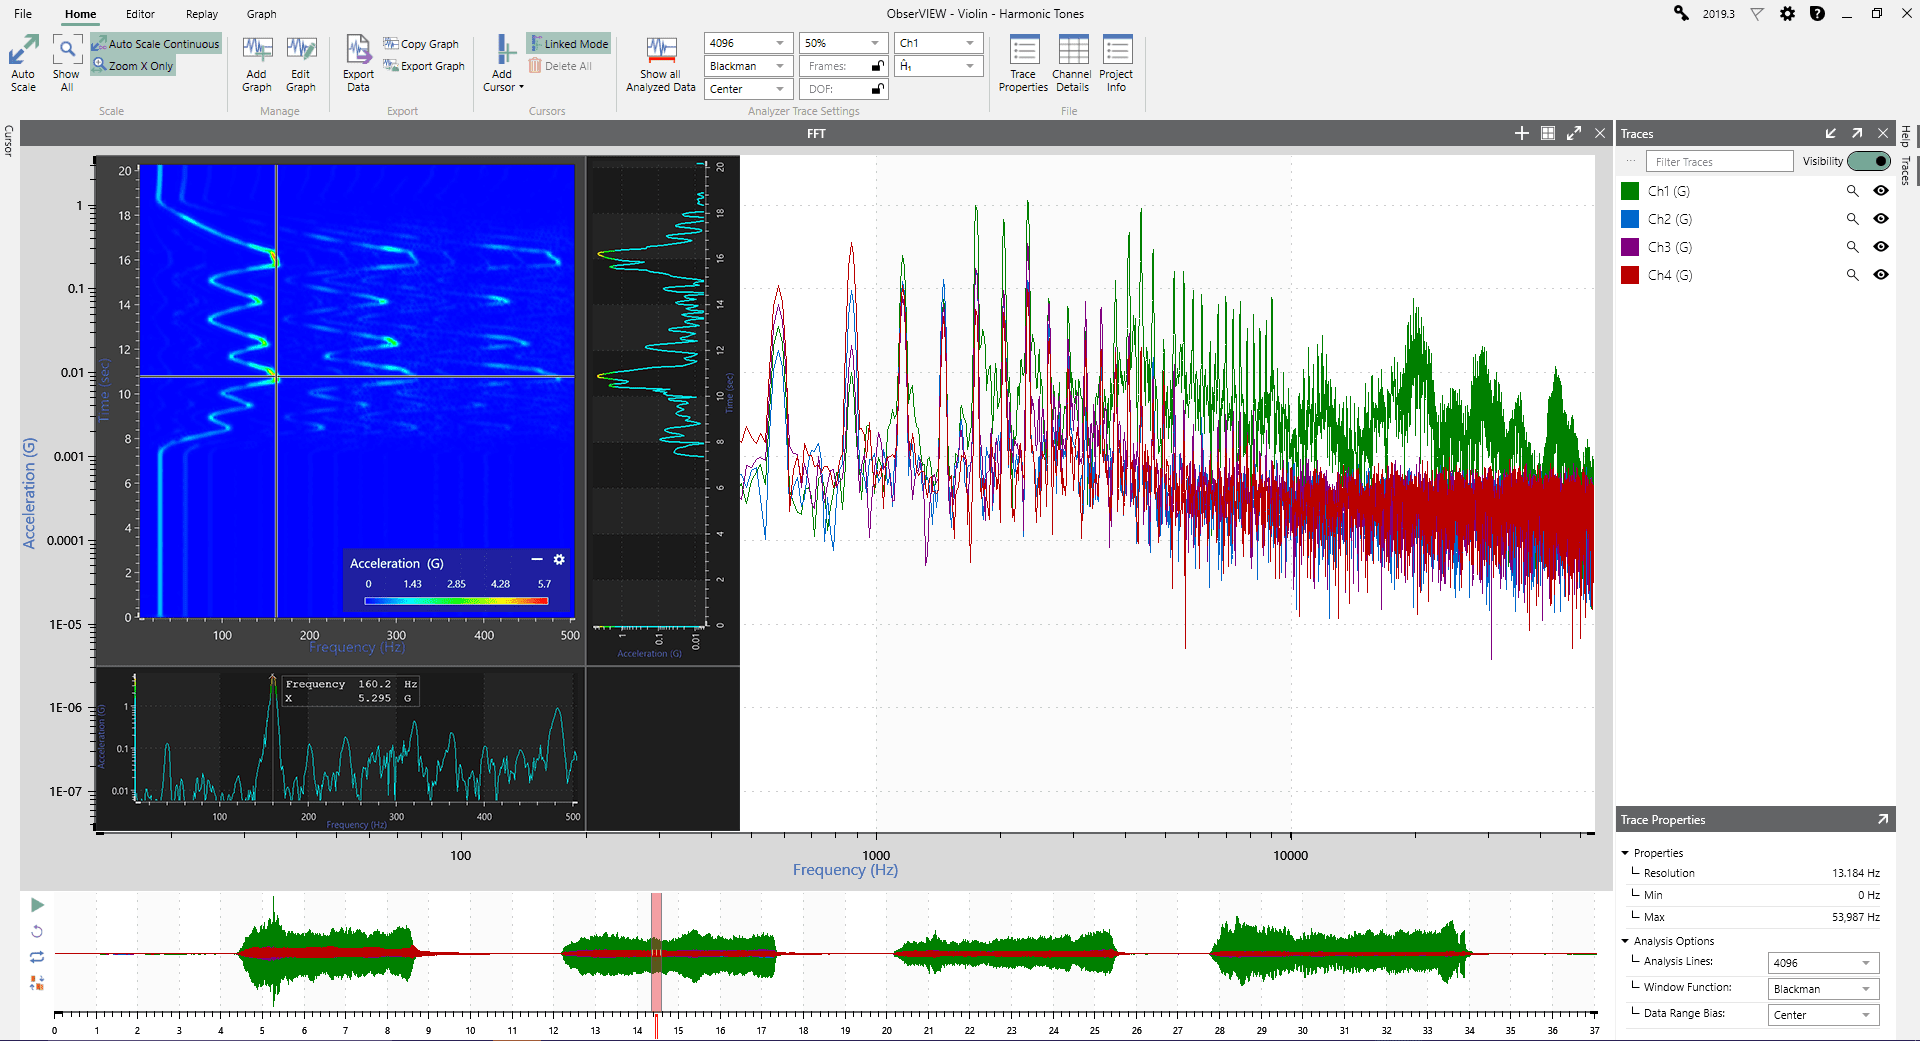
In a complex signal, the fast Fourier transform (FFT) helps engineers determine which frequencies are excited and the amplitude at each frequency. Additionally, it highlights changes in the frequency and amplitude and the harmonic excitation in a frequency range.
For automotive testing, engineers can use the FFT to diagnose imbalances and analyze vibration from the engine or other components. To learn more about FFT analysis, read the Fast Fourier Transform (FFT) Analysis article.
A spectrogram is an advanced graph option if the vibration frequency changes with time. Engineers can use a spectrogram to analyze the waveform’s frequency content and distinguish different vibration types. The graph data highlight strong signals and frequency change over time.
The spectrogram is useful for determining the amplitude of the sinusoidal motion generated by the rotational vibration source compared to the general random vibration and other motions. It also allows engineers to view product resonances that are excited throughout the test. In ObserVIEW, the user can add additional cross-section plots to view the specific data for a vertical segment, horizontal segment, or order.
Octave Band Analysis
Octave analysis allows for the objective evaluation of sound and vibration by grouping the frequencies of an acoustic signal into “bins,” often to reflect how humans perceive the frequency spectrum.
The Octave Analysis software in ObserVIEW can perform A, C, and Z frequency weighting, linear and exponential averaging, and peak hold. ObserVIEW includes the most used fractional octave bands and supports up to 1/24 octave bandwidth. The octave band graph supports the advanced functionalities of ObserVIEW, including live analysis, copy-and-paste, and graph traces.
Vibration Research’s data acquisition systems offer the functionality to acquire and analyze acoustic signals. All VR hardware includes a BNC input that supports a microphone and is capable of data acquisition. If your testing lab is already using VR hardware for vibration testing, sound acquisition and analysis are an economical addition.

Order Tracking and Analysis
An order is a frequency value that is a multiple of a reference rotational speed. Order analysis captures the reference RPM signal and correlates it with the measured vibration on the rotational equipment. Frequencies corresponding to the reference RPM and its harmonics are identified as orders. As the reference RPM changes, so will the response amplitude and frequency.
Order tracking monitors the change in RPM throughout a waveform. By generating graphs with this information, engineers can understand the vibration source at different frequencies and its relation to the reference RPM.
Among other purposes, order analysis determines which part of the vibration is generated from the rotational source compared to some random source. The frequency and amplitude values that follow the order lines are easily differentiated from vibration content not generated by the rotational source.
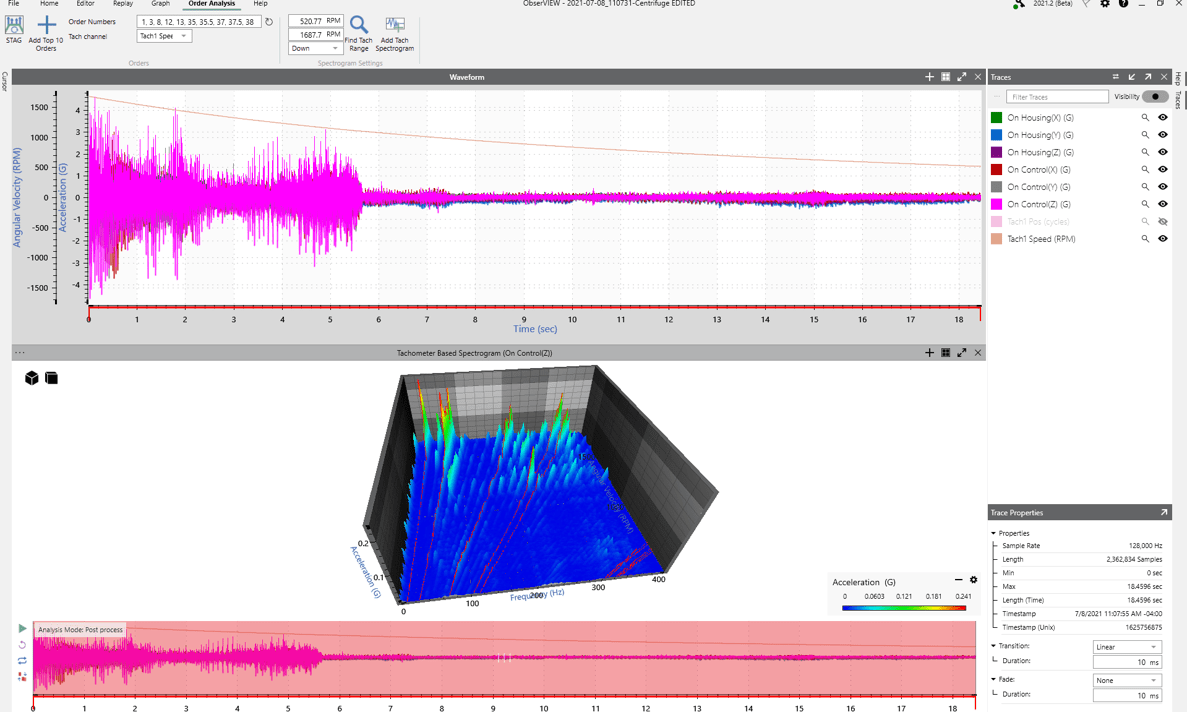
ObserVIEW can extract orders of interest automatically. The rotational content is separated from the background random. Then, a tracking filter completes an order analysis of the rotational environment. Using time- and order-based spectrograms, the user can analyze and manipulate the data.
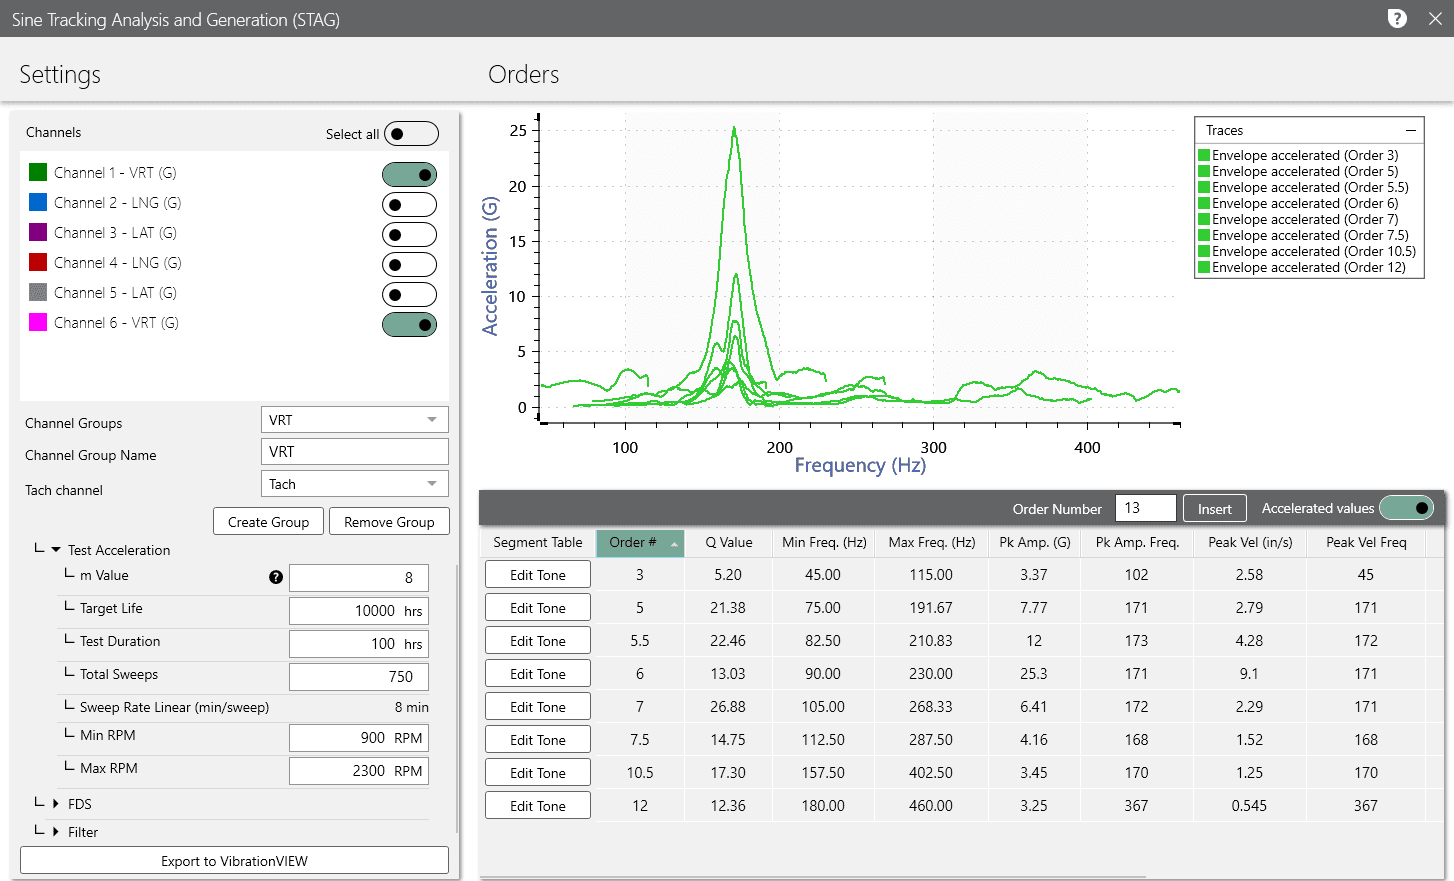
Next, the user can employ the Sine Tracking, Analysis and Generation (STAG) software. STAG identifies the dominant orders and extracts them from the original recording with the purpose of generating an accelerated sine-on-random test that is the damage equivalent to the field environment.
Test Development with STAG
Vibration Research developed STAG to generate an accurate representation of an environment with dominant sinusoidal vibration and background random vibration, such as an engine environment. Access to STAG enables users to analyze, accelerate, and generate a test representative of environments with a dominant sinusoidal or rotational component.
A sine-on-random (SoR) test is the most accurate test method for replicating an environment with rotational components. However, there is no standard method of SoR test development, and the process of generating and accelerating both sine and random test profiles can be time-consuming and prone to error. STAG is an accurate and efficient option for SoR test development using recorded data.
STAG uses recorded time data from an engine run-up or coast down to generate the sinusoidal portion of the SoR test. Then, ObserVIEW generates and accelerates the random test profiles with the fatigue damage spectrum (FDS). Together, the sinusoidal and random test profiles constitute an accelerated SoR test that is the damage equivalent to the original environment.
VRU Course: Test Development with Recorded Data
What is the Importance of NVH Testing?
Noise, vibration, and harshness (NVH) testing:
- Optimizes vehicle noise and vibration
- Improves vehicle performance and safety
- Maintains a standard of comfort
- Increases consumer confidence
With VR systems, there’s no need to own multiple pieces of equipment. Use our hardware and software as the all-in-one solution for NVH testing. Interested in learning more? Download the free demo of the software programs and put them to the test.