Shock testing is critical for evaluating components during sudden impacts or high-acceleration transient events. To test complex shock events, engineers often employ the shock response spectrum (SRS). The SRS uses a mathematical model to synthesize a shock pulse that simulates a transient event.
Similar to sine and random vibration testing, engineers want their SRS test profile to reflect the end-use environment (EUE) as closely as possible. This similarity helps confirm that the test levels are sufficient and avoid unexpected post-production failures.
While synthetic response spectra are standard in the testing industry, engineers can convert a recorded time-history file to an SRS to generate a test profile comparable to the EUE. This article outlines a recommended method and details relevant solutions in the VibrationVIEW and ObserVIEW software programs.
Article Overview
- Limitations of synthetic waveforms for SRS synthesis
- Proposed method of combining time-history recordings of shock events
- Solutions in the VibrationVIEW and ObserVIEW software programs
Recordings in Place of Synthetic Waveforms
Engineers typically select from a list of standard synthetic waveforms to synthesize their SRS pulse. The selection depends on the test specifications; standard practice is to choose whichever waveform generates a pulse closest to the specified SRS. For example, the “burst random” and “enveloped burst random” waveforms produce long-duration, stationary random pulses suitable for earthquake simulation.
However, synthetic waveforms are not one-to-one replications of real-world transient events. The difference between a synthetic SRS pulse in the lab and a shock event in the EUE can be significant. The only way to ensure that a test represents the EUE is to build a pulse from a field recording. From there, the engineer can use the waveform as the test profile or as a comparison.
With Vibration Research software, engineers can modify field recordings to meet or exceed a specified SRS and compare the damage potential of different spectra. This test generation method produces a waveform with a frequency response function close to the EUE.
Enveloping Recordings
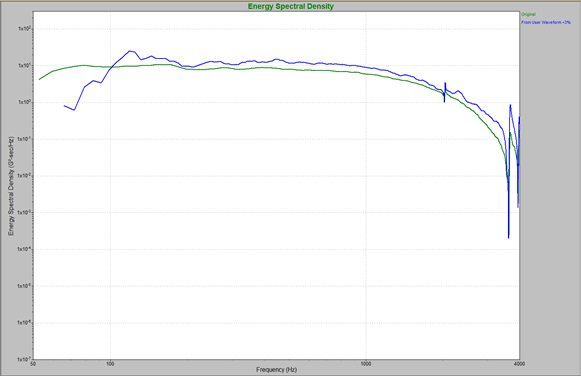
A max enveloped waveform overlaid on recorded data.
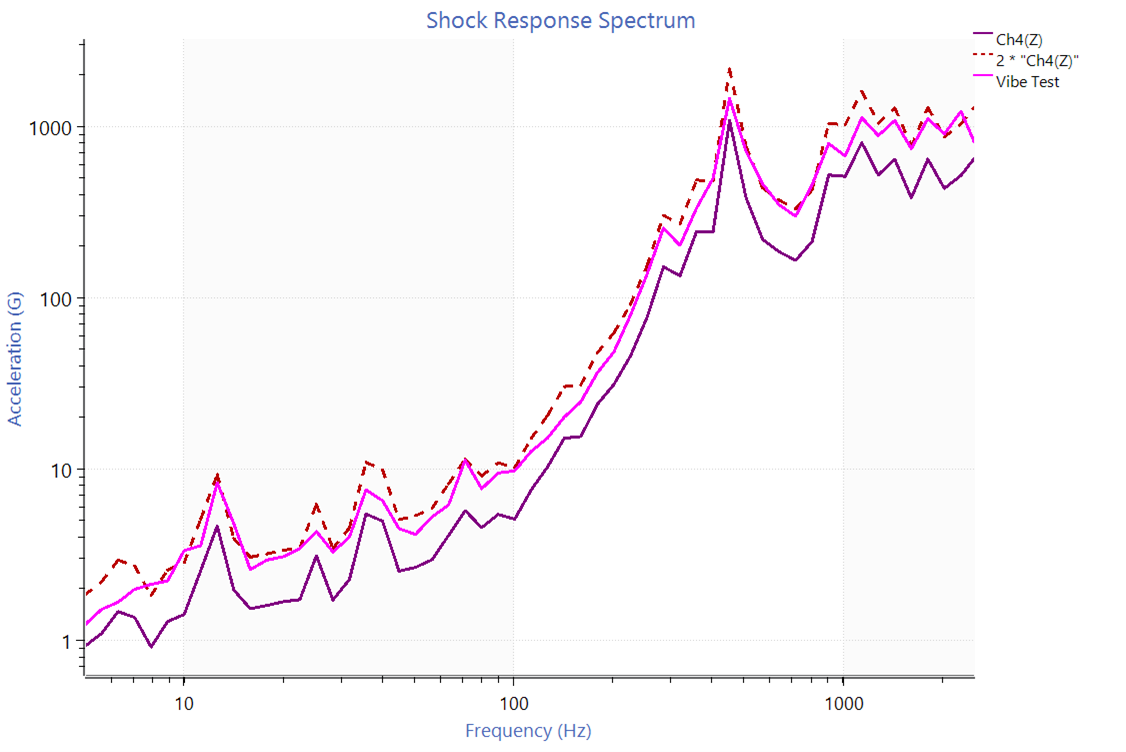
The proposed method of converting a time-history recording to an SRS combines multiple data sets into a representative waveform. An SRS waveform synthesized from a single recorded shock event would be an incomplete description of the events that may occur in the EUE.
The correct way to combine this data is to use the maximum value at each frequency rather than the average acceleration. This “maximum enveloping” technique produces an SRS curve using the maximum acceleration value at each frequency from real-world data sets.
Why Maximum Acceleration?
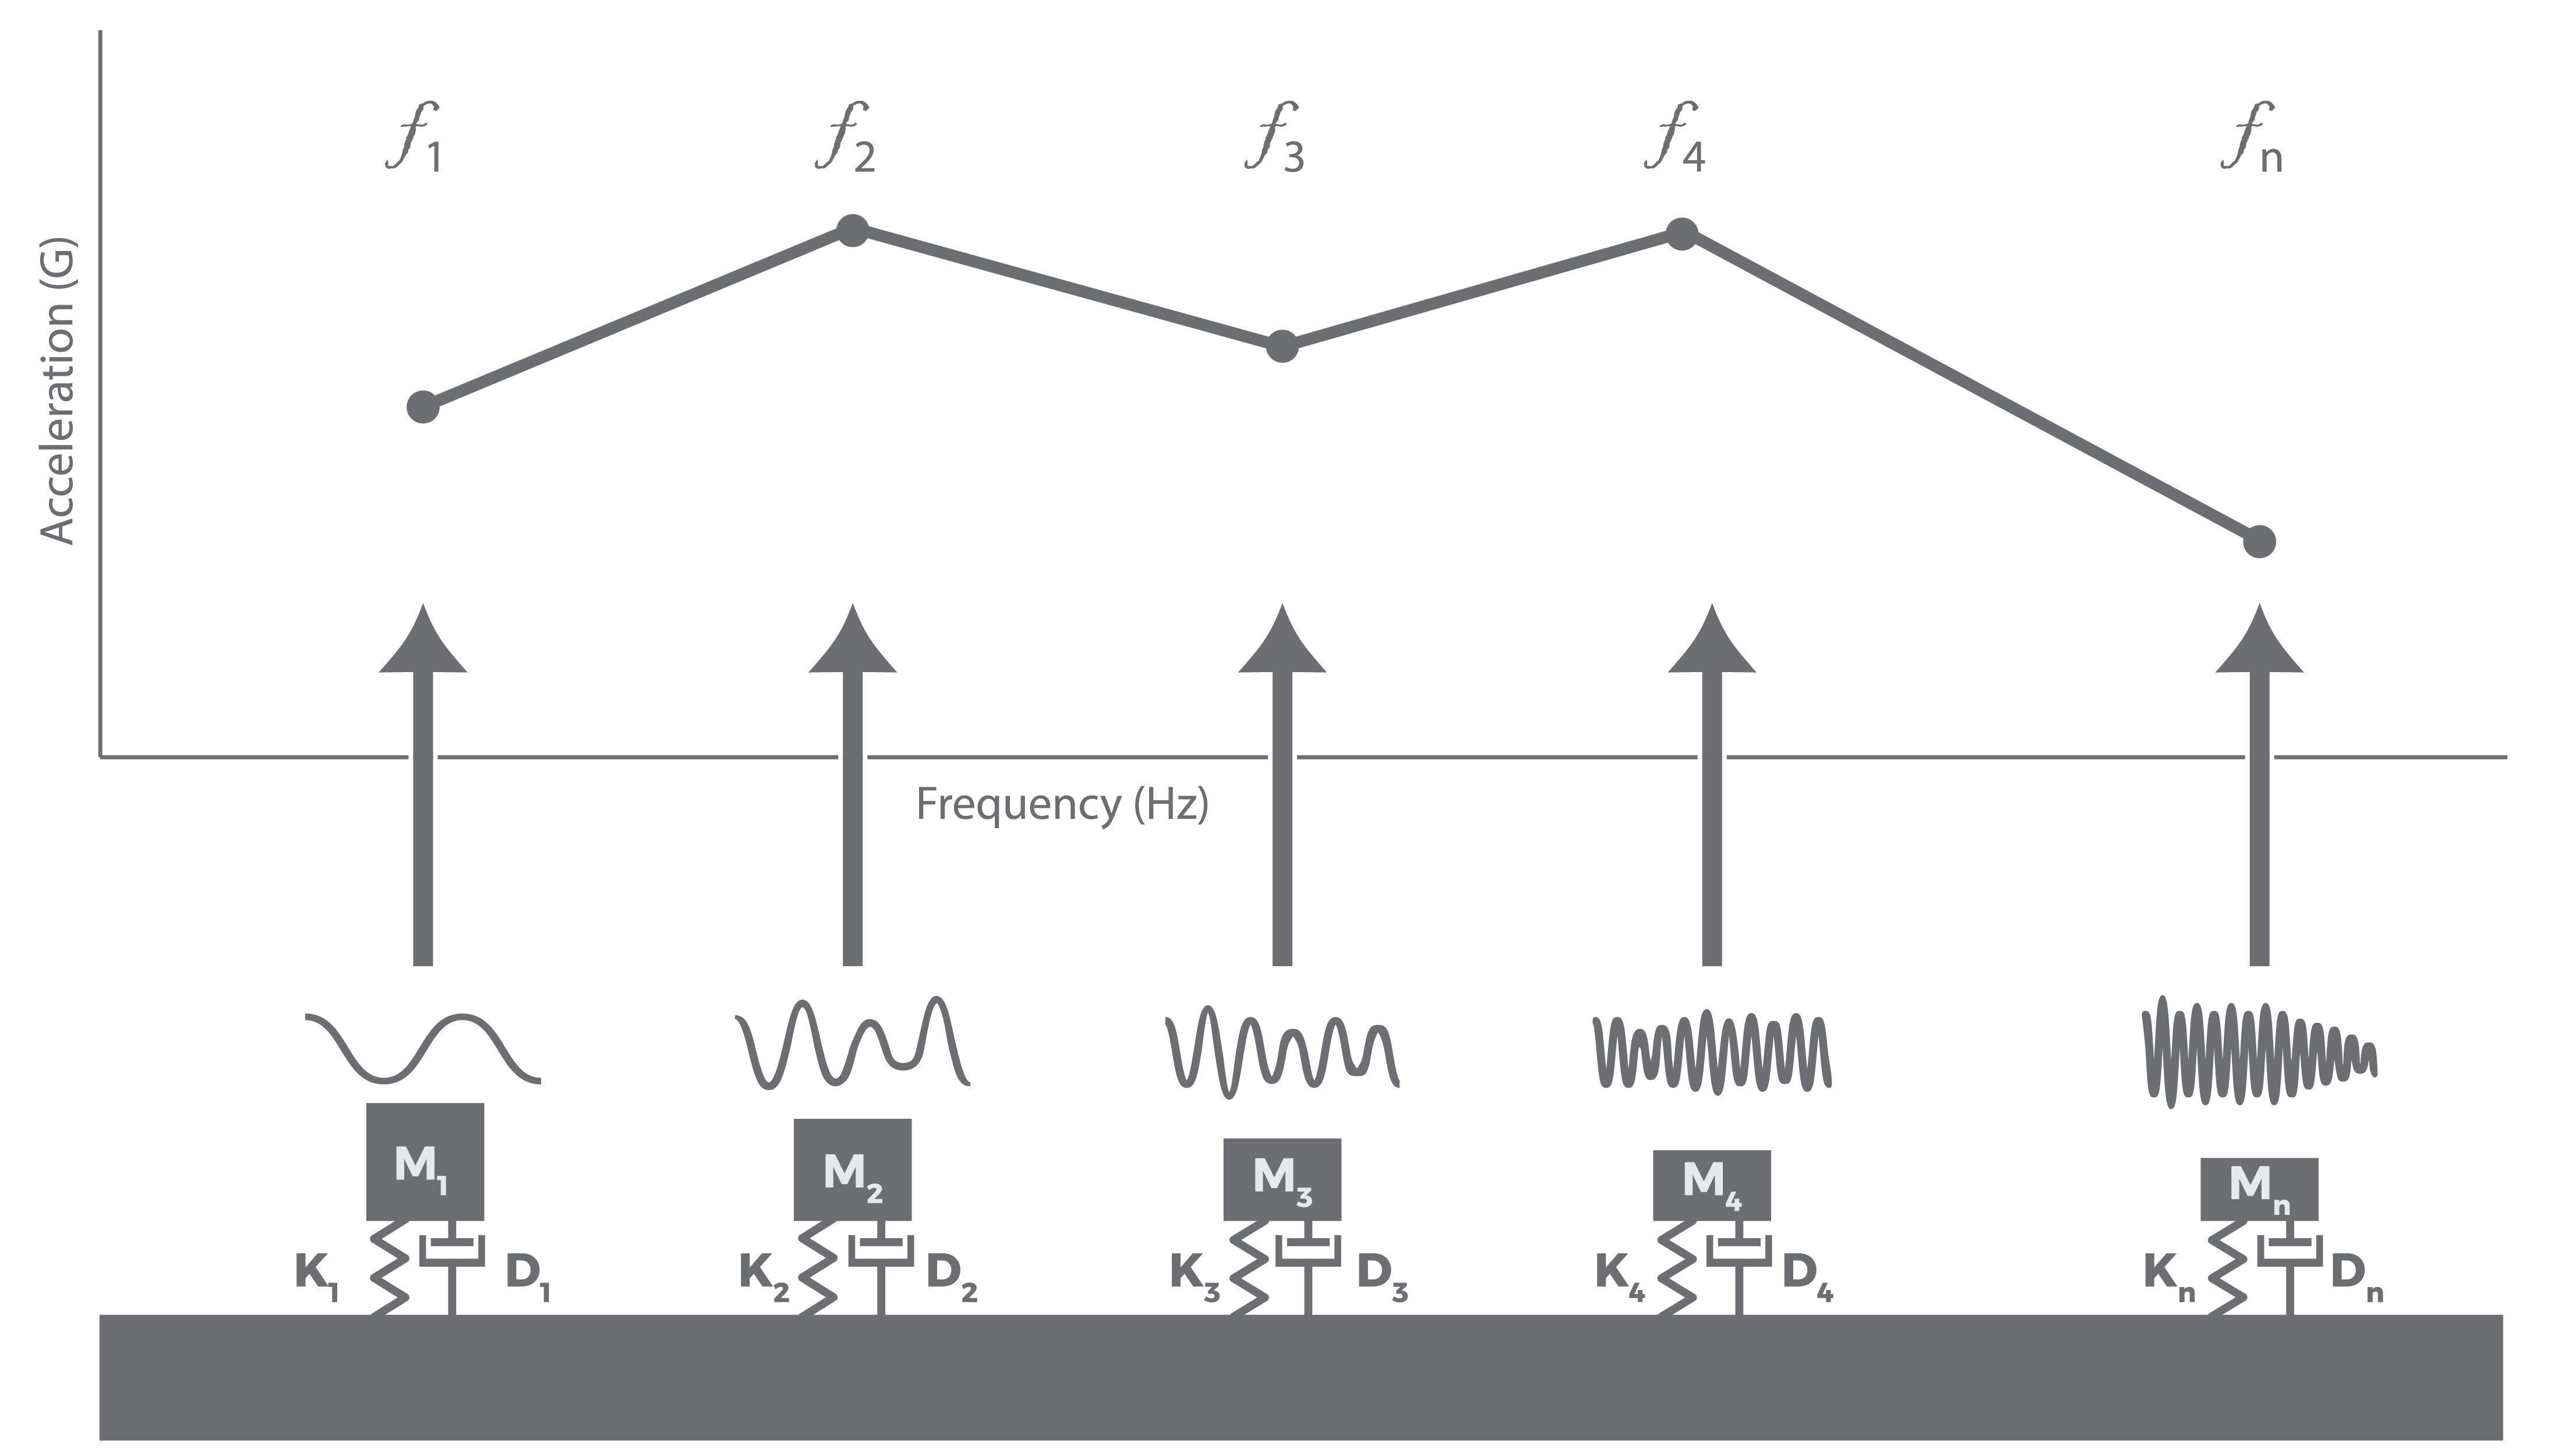
A basic model of the SRS.
The SRS calculation models response channels using a theoretical series of single-degree-of-freedom mass-damper-spring oscillators. The natural frequency of each SDOF oscillator defines the plot’s horizontal axis, and a computed response for each oscillator makes up the vertical axis. This response is the absolute maximum acceleration of the SDOF oscillator to the pulse, not the average acceleration.
Convert a Time History to SRS
Vibration Research Solutions
The paper, titled Using Recorded Data to Improve SRS Test Development, details the recommended approach using the VibrationVIEW software.
VibrationVIEW implements the max-enveloping technique to convert time-history files to an SRS. It supports SRS iteration to create a waveform that meets or exceeds the SRS maximax breakpoint table.
This method requires the engineer to create a max envelope data file in Microsoft Excel® and paste it into VibrationVIEW. The ObserVIEW analysis software offers a more automated process and additional tools. Engineers can create analysis ranges for multiple shock events in a recording, add multiple files to a project, and use a math trace to envelope the data. They can also overlay SRS waveforms for comparison, calculate statistics, evaluate damage potential, and more.