A new version of ObserVIEW (2023.3) is now available for download. In this latest software release, access updates to the Live Analyzer feature, select a base-2 calculation for octave analysis, perform linear FFT averaging, and more.
Improvements in Live Analyzer
Record to Disk in Live Analyzer
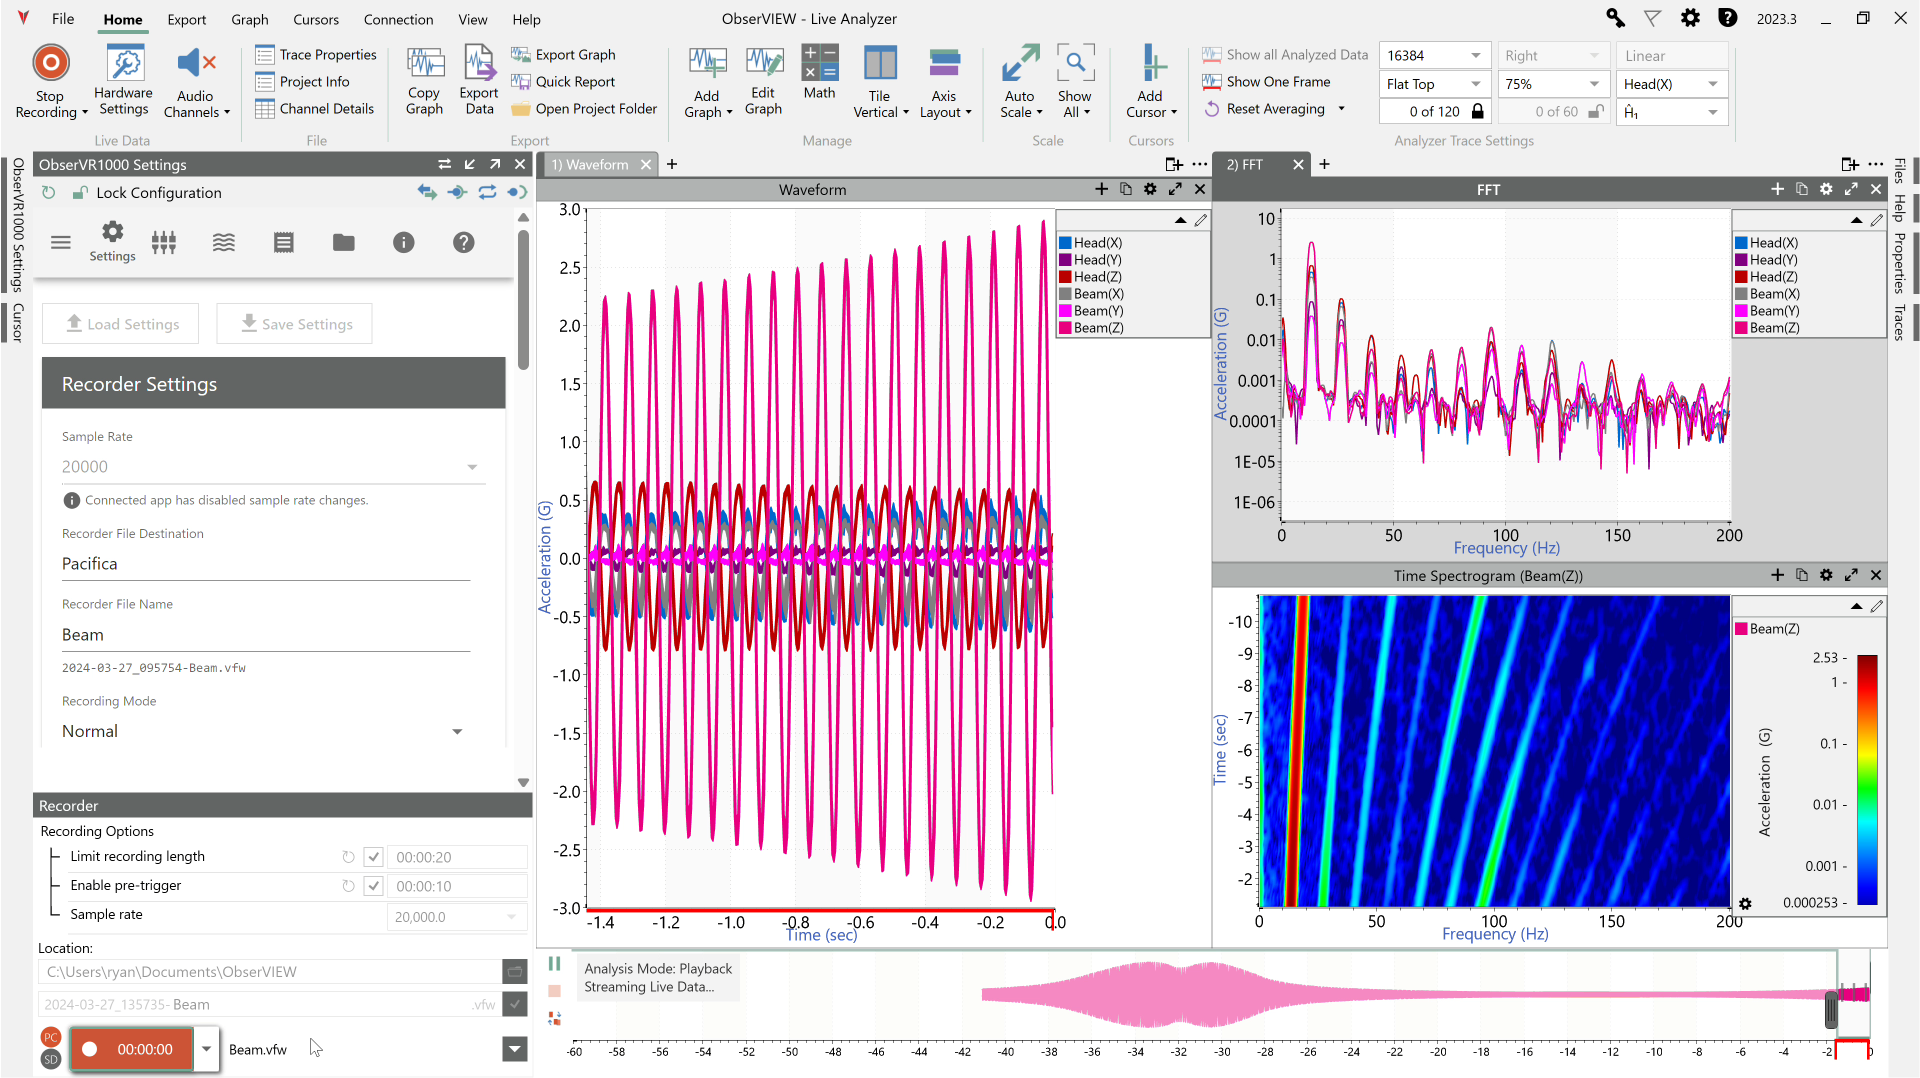
The Live Analyzer feature streams live data with the option to apply analysis tools such as FFT, PSD, windowing, and waveform editing. Live Analyzer can now record live data to a disk in addition to a rolling memory buffer. This new option allows engineers to record two places at once.
Compute Live Math Channels in Live Analyzer
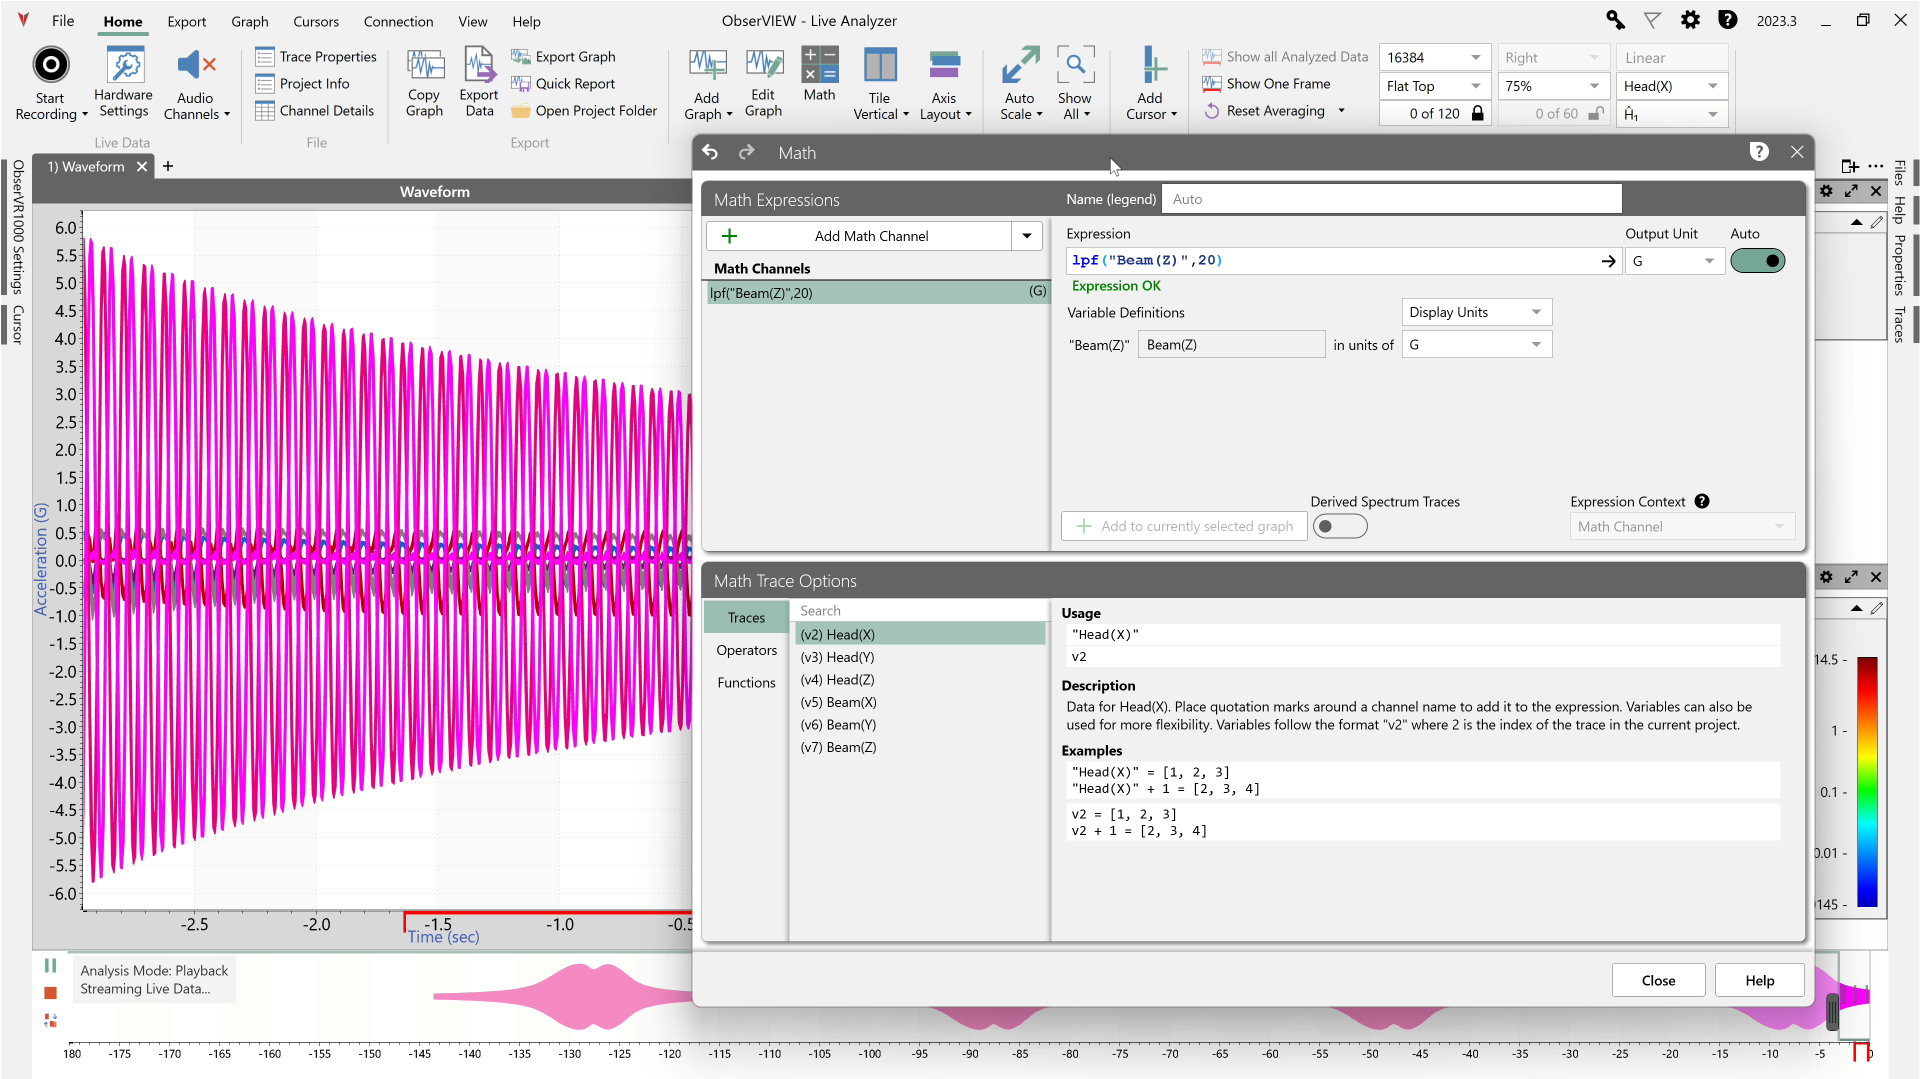
Engineers can now apply the power of math traces to live data. The Math feature plots a user-defined math equation on a time or frequency-domain graph, allowing engineers to implement custom math operations not defined by the current graph types. In Live Analyzer, the software can calculate the math trace in real-time as the data records. Uses for math traces on live data include:
- Monitoring vibration at a specific frequency range during a test (low-pass or high-pass filter) or statistics like RMS or kurtosis
- Computing physical properties, such as the angle between the shaker head and test item
Improved Cursor Computation of Statistics
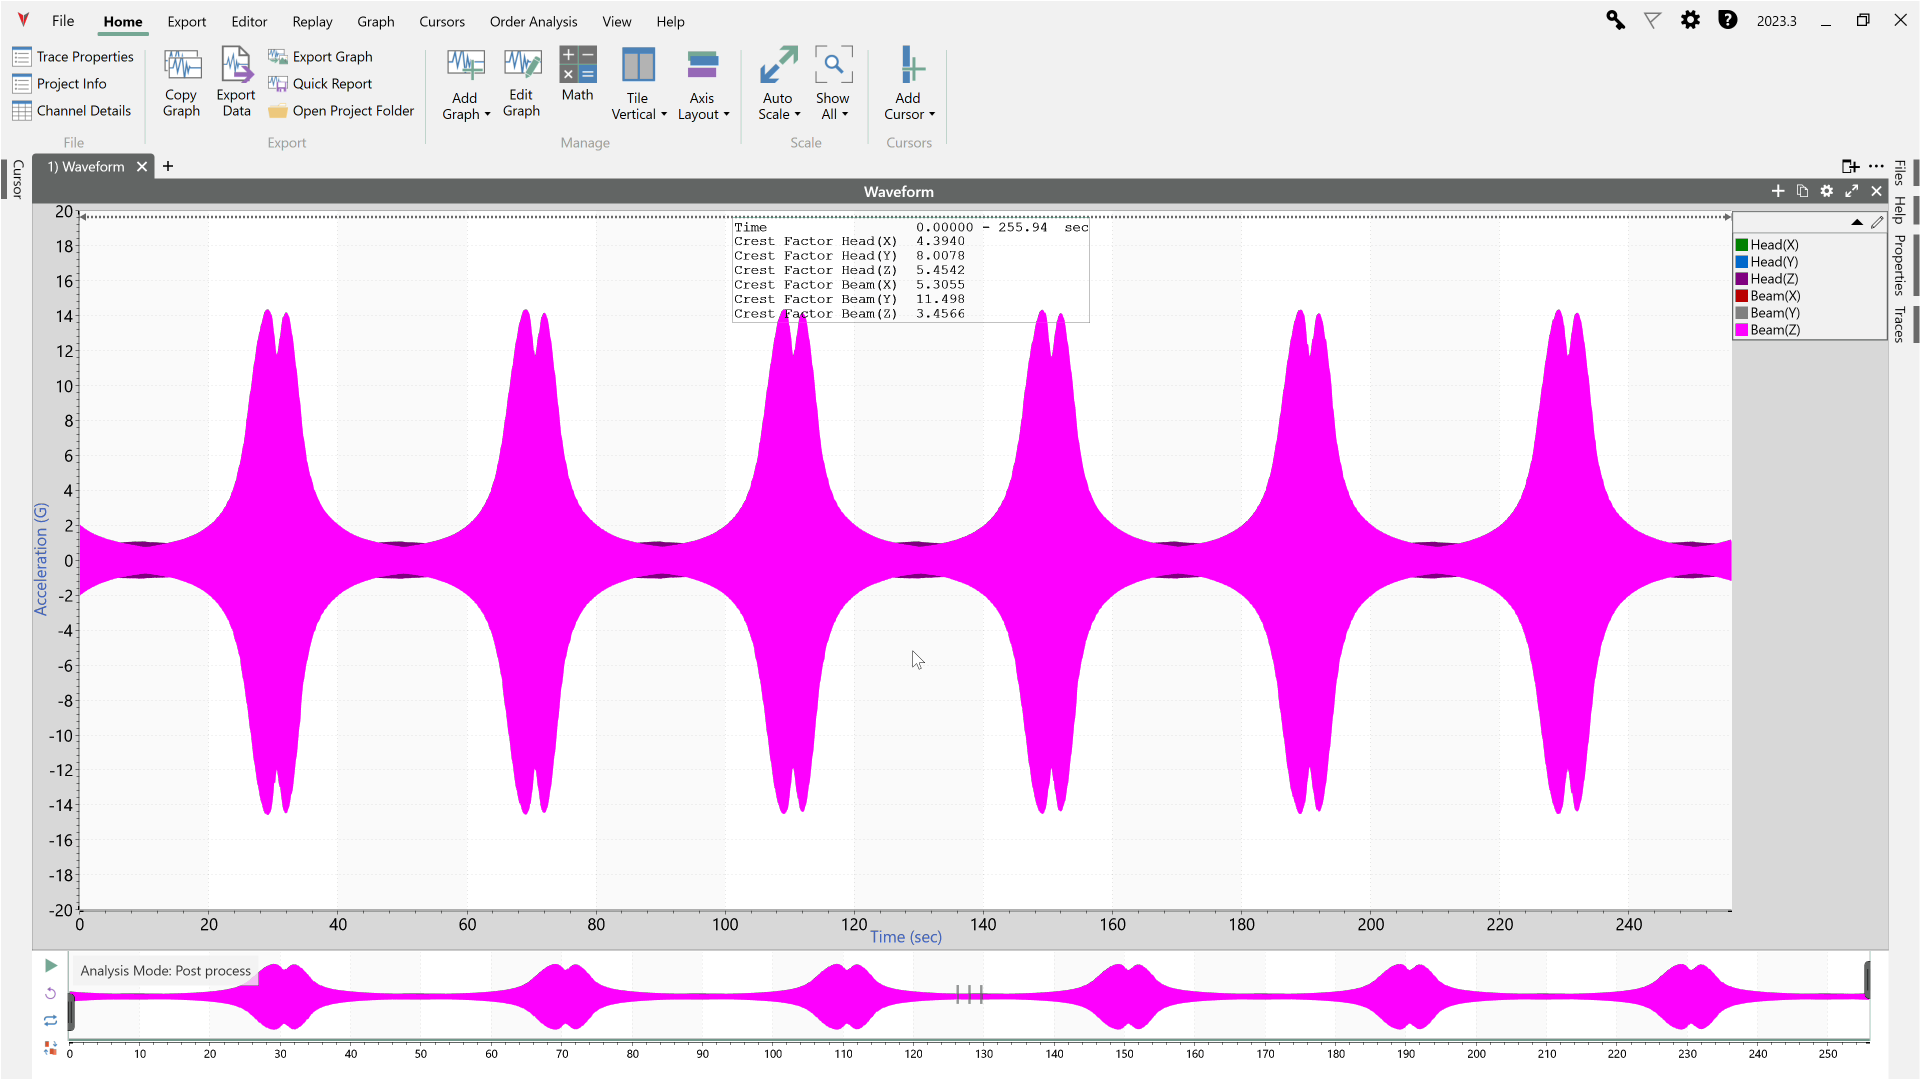
In this release, cursors can calculate statistics like mean, RMS, and kurtosis more quickly and over any time span.
Base 2 Octave Band Analysis
The ObserVIEW Octave Analysis software now includes two options for calculating fractional octave bins. Previously, the software used a default base of 10 when calculating the logarithmic frequency interval between two frequencies, as required by IEC 61260-1. Now, the user can choose a base-10 or base-2 calculation, depending on their analysis.
Analyze Musical Notes with 1/12 Octave Spacing
VR added the base-2 calculation option specifically for musical note analysis. For music, a reference frequency of around 440Hz functions as note A4 with a base-two octave bin type and 1/12 octave spacing. The reference frequency determines the frequency to which the bins are aligned. When the user selects a base-2 octave bin type with 1/12 octave band spacing, the cursor displays the center frequency of each bin and its note value.
Background
Octave analysis groups an acoustic signal’s frequency range into several octave “bands.” Fractional octave analysis further separates each octave into a specified number of bins. With 1/3 octave spacing, each octave has three bins.
Within this analysis, the definition of an octave varies depending on the calculation from which it derives. There are two generally accepted methods of calculating octaves: base 2 or base 10. These base numbers relate to calculating the logarithmic intervals between two frequencies.
For example, a 1/3 octave calculated with a logarithmic base of 10 is one-tenth of a decade. A 1/3 octave calculated with a logarithmic base of 2 is one-third of an octave. The values are approximately equal, but test standards may define which calculation to use.
FFT Average
The new Average FFT option displays a linear-averaged FFT over the specified time range. Linear averaging weighs the data over the time range equally. This approach is reasonable for analyzing the true data of a time frame but does not necessarily reflect the variation of real-world vibration and can flatten potentially damaging peaks. ObserVIEW’s default is exponential averaging, a moving average that puts more weight on recent data. As such, exponential averaging is favored when analyzing long or non-stationary signals.
Specify Projected FDS Target Lifetime in Passes
The Projected property for the Fatigue Damage Spectrum (FDS) analysis option displays an FDS projection using a target lifetime. It estimates the damage that the device under test (DUT) will incur if tested for the given time.
In ObserVIEW 2023.3, “Target Life Passes” is a second option for generating a projected FDS. This selection estimates the damage if the DUT was exposed to the signal (or equivalent) more than once. The software multiplies the damage by the user-defined passes value.
The locked icon indicates the selection displayed on the graph.
Linear Spacing Option for FDS & SRS Distribution
The Fatigue Damage Spectrum (FDS) and Shock Response Spectrum (SRS) are two analysis options in ObserVIEW. Calculations for both involve distribution on the frequency axis. In version 2023.3, the engineer can select a logarithmic (octave) or linear distribution for either analysis.
FDS
The FDS calculates the relative damage a product experiences in a defined period.
First, the FDS combines multiple time-history recordings, weighing them based on their contribution to product lifespan in a standard environment. Then, it applies narrowband filters, typically logarithmically spaced at some octave value, to produce single or narrow-range frequency stress waveforms.
The spacing parameter in ObserVIEW defines how many frequencies to analyze per octave (1/3, 1/6, etc.). Alternatively, engineers can select linear spacing, where the software evenly spaces the narrowband filters.
The FDS then applies stress cycle counting and a damage calculation to plot the fatigue damage value for each single/narrow range frequency waveform.
SRS
The SRS identifies the maximum theoretical response of a complex shock.
It models a time waveform using filters representative of single-degree-of-freedom (SDOF) mass-damper-spring oscillators. Each point of the SRS trace represents the natural frequency of each SDOF and its corresponding theoretical response.
The filters the SRS applies to the time data show the magnitude of the peak response for each filter over the data’s frequency range. Typically, they are spaced logarithmically, but engineers can select a linear spacing option.
Additional Features
- Replace Chromium Embedded Framework (CEF) browser with Microsoft Edge
- Improve low-pass Butterworth filter behavior for low-corner frequencies
- Improve FFT analysis behavior for waveforms shorter than FFT size