A new version of ObserVIEW (2022.1) is now available for download. In this latest software release, analyze fatigue damage with the FDS, convert time data to velocity and displacement, and more.
Fatigue Damage Spectrum (FDS)
Test Profile Development
Use the FDS to create a random test profile that is the damage equivalent to the recorded environment. ObserVIEW converts the FDS into a power spectral density (PSD) using Henderson-Piersol’s fatigue calculation method. The result is a single PSD profile for a recorded time waveform.
Accelerate the random test with user-defined m, Q, target lifetime, test duration, and kurtosis control (optional). Then, you can copy the test spectrum to VibrationVIEW and generate a shaker test profile.
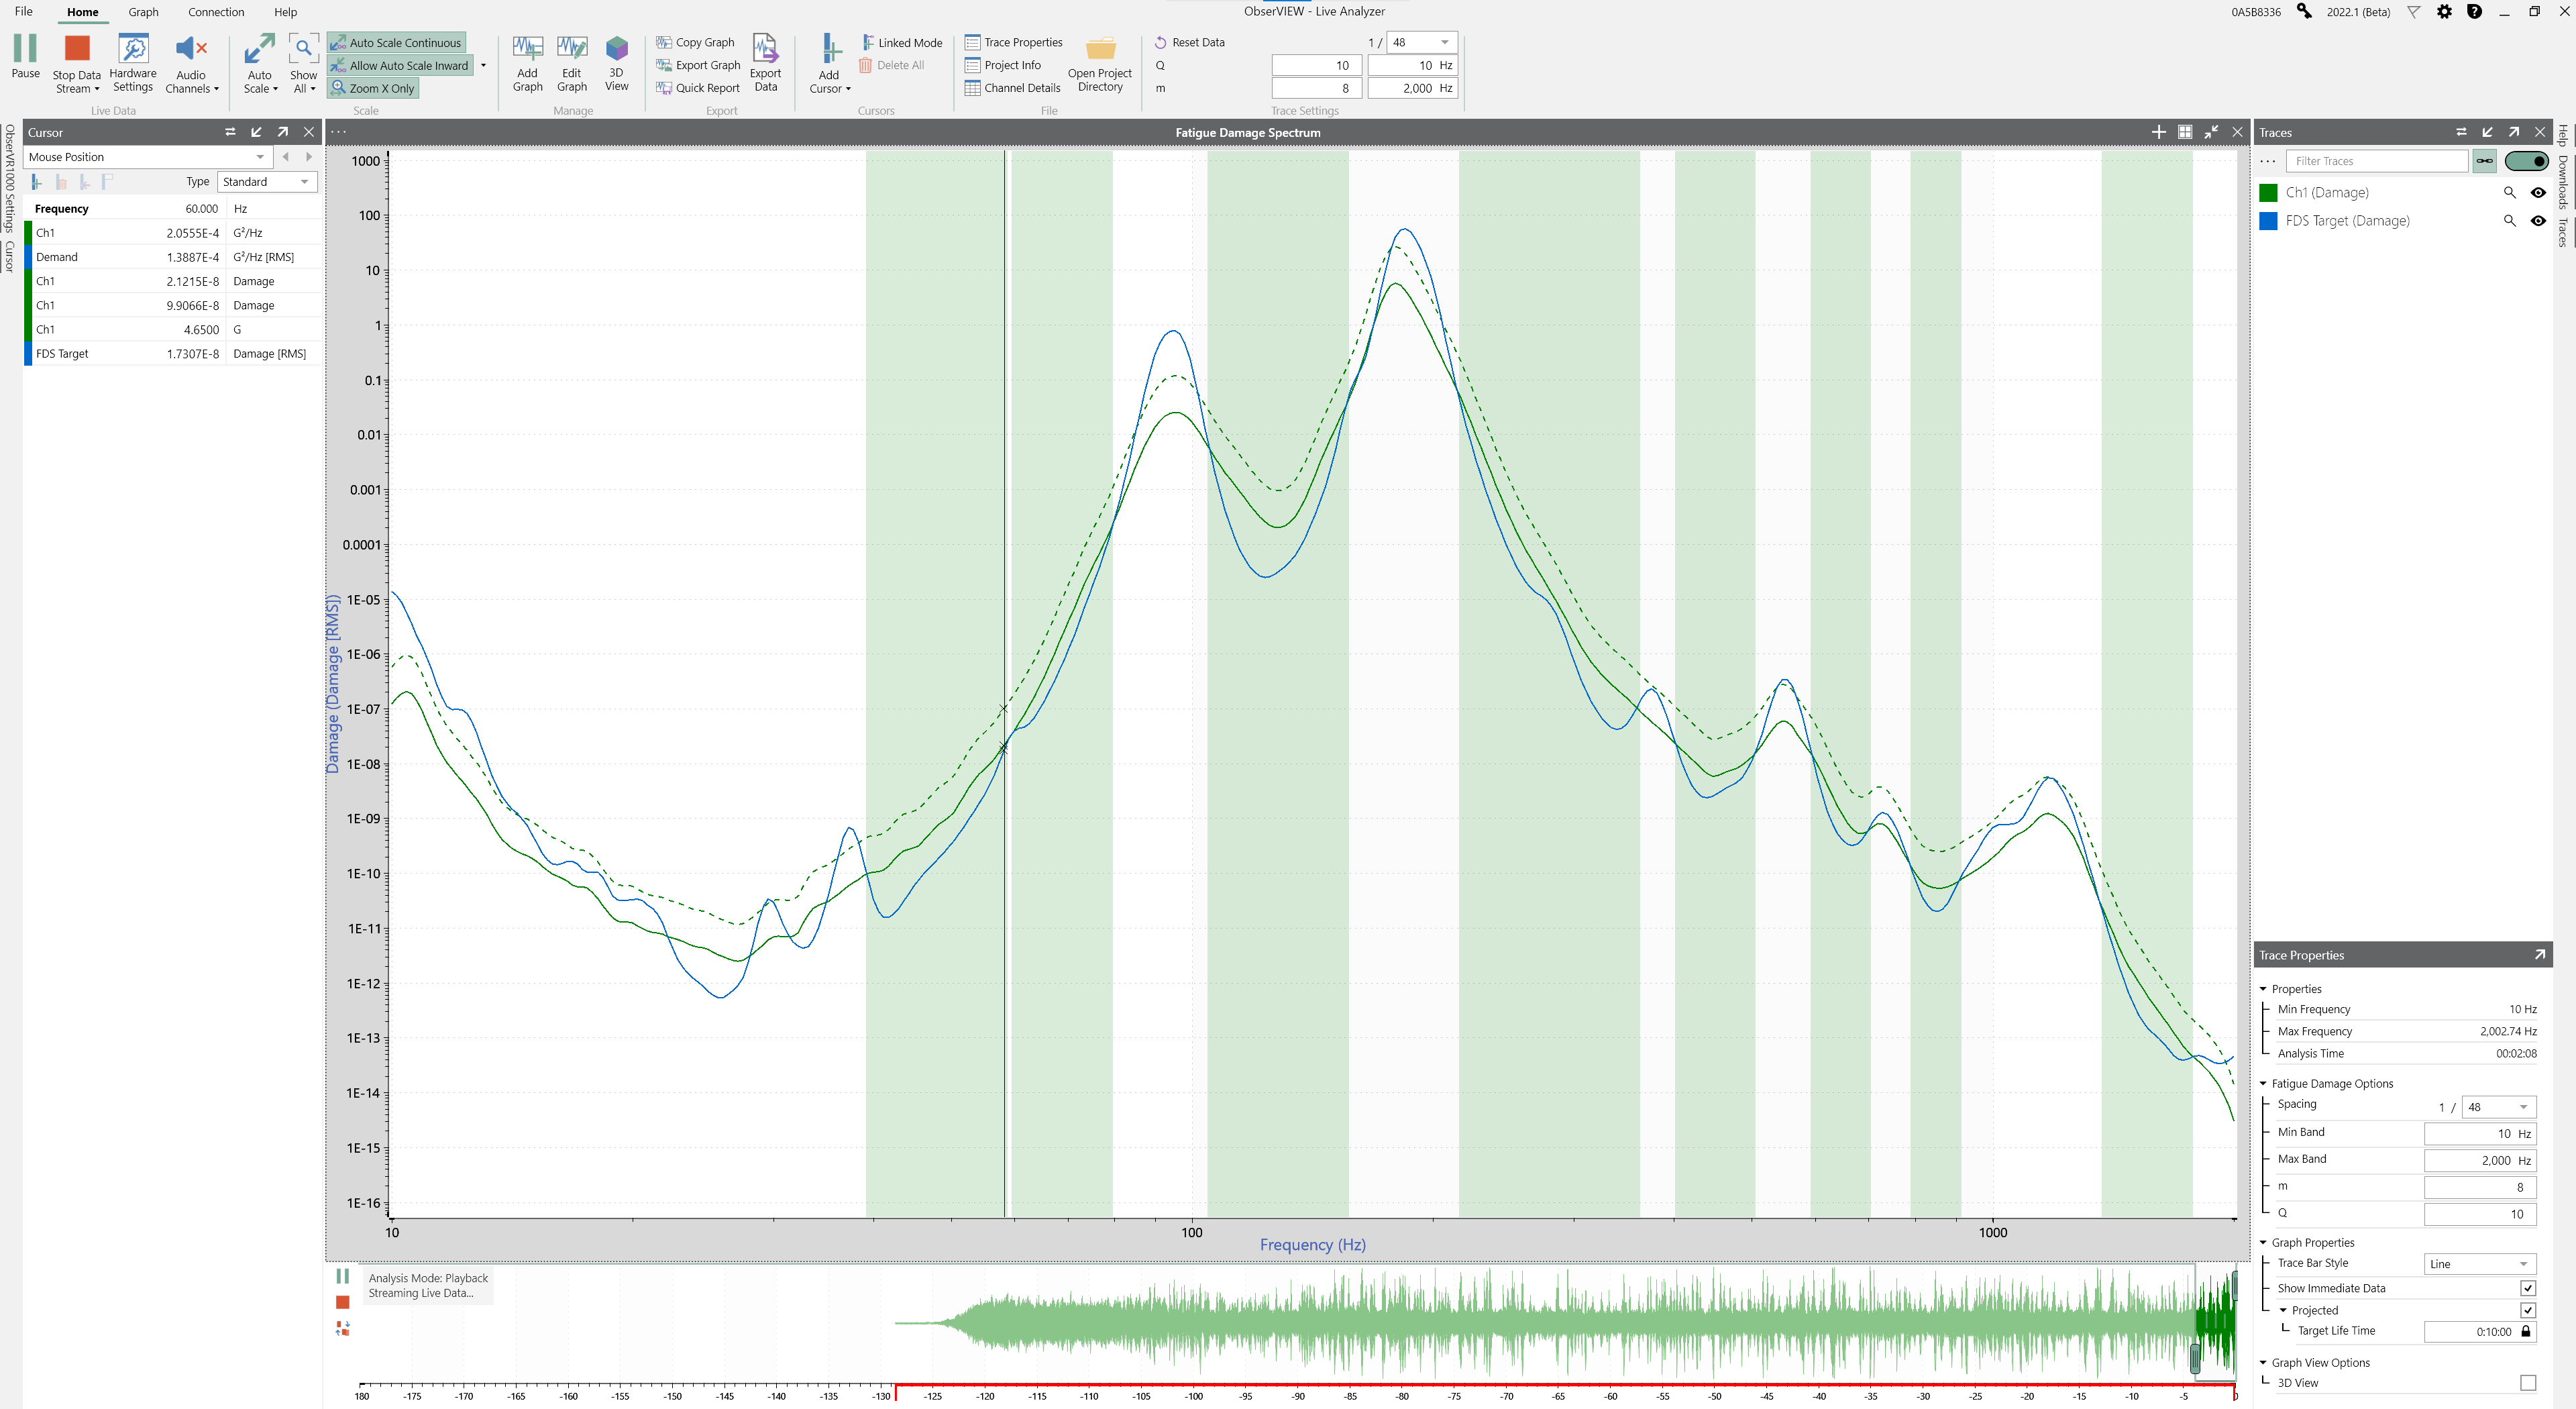
Real-time Fatigue Measurement
Live FDS helps identify when fatigue levels of a test profile are achieved compared to a field recording. Review the live stream of a random test to determine when the test levels meet recorded data or a test standard. Perform the analysis live or post-process and identify how long it takes to reach real-life fatigue levels.
Features of the FDS License
- Analyze fatigue damage of a test profile and compare it to a reference
- Generate a fatigue damage spectrum (FDS) from a time waveform
- Generate an accelerated FDS test spectrum
- Generate a random PSD test profile using projected fatigue damage
Requires an FDS license.
Shock Response Spectrum (SRS)
Generate a shock response spectrum (SRS) to analyze environments with complex transient shocks. Similar to the FFT, the SRS represents time data in the frequency domain. The filters that the SRS applies to the time-data plot show the magnitude of the peak response for each filter over the data’s frequency range.
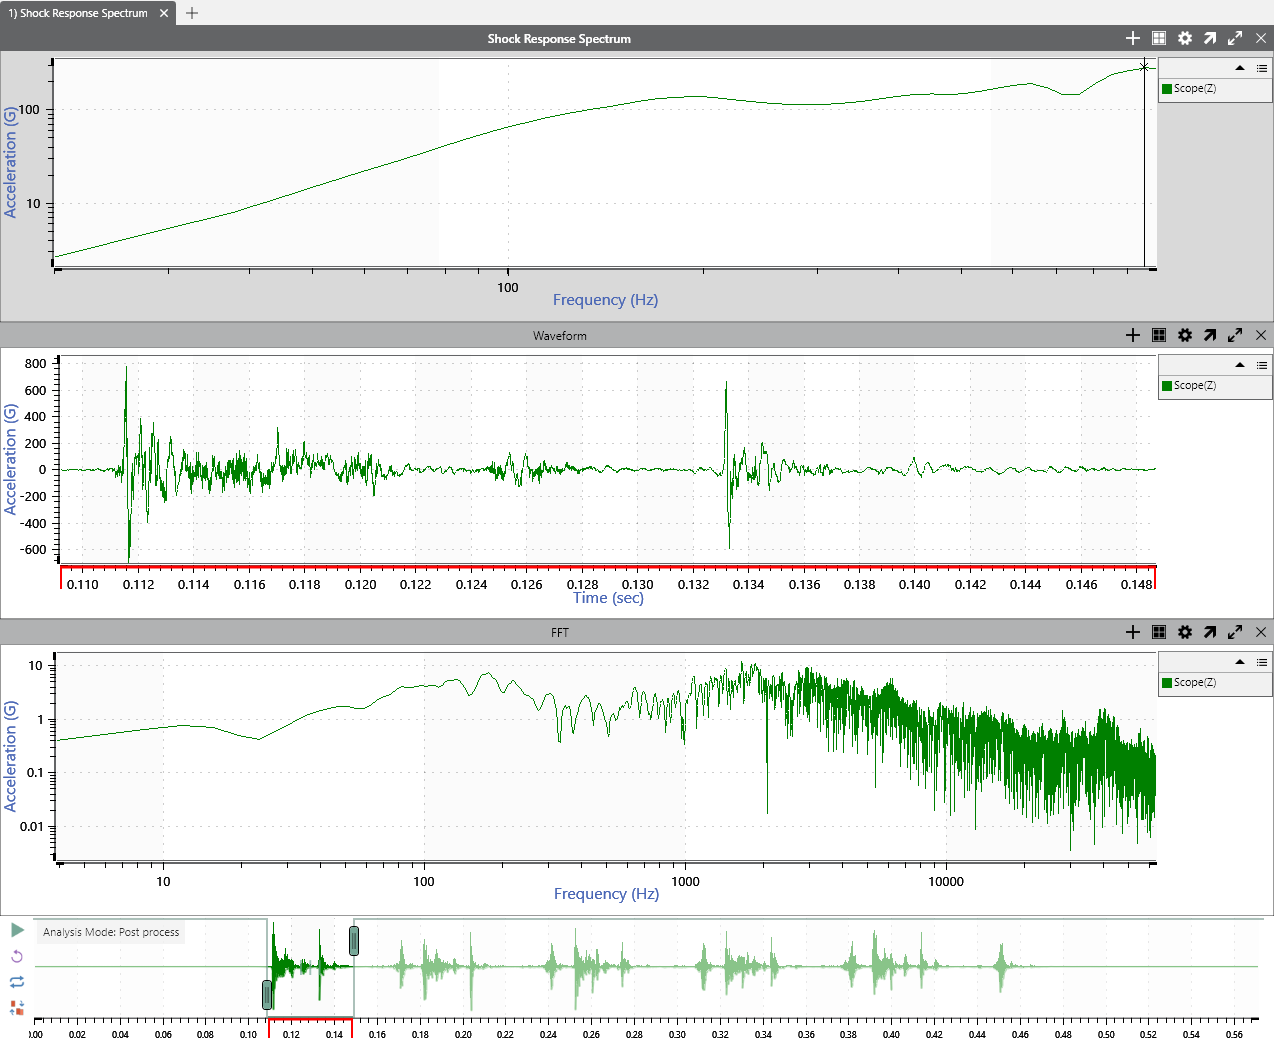
Generate an equivalent SRS test in VibrationVIEW by copying the SRS trace and pasting it to the test profile SRS breakpoint.
Requires an SRS license.
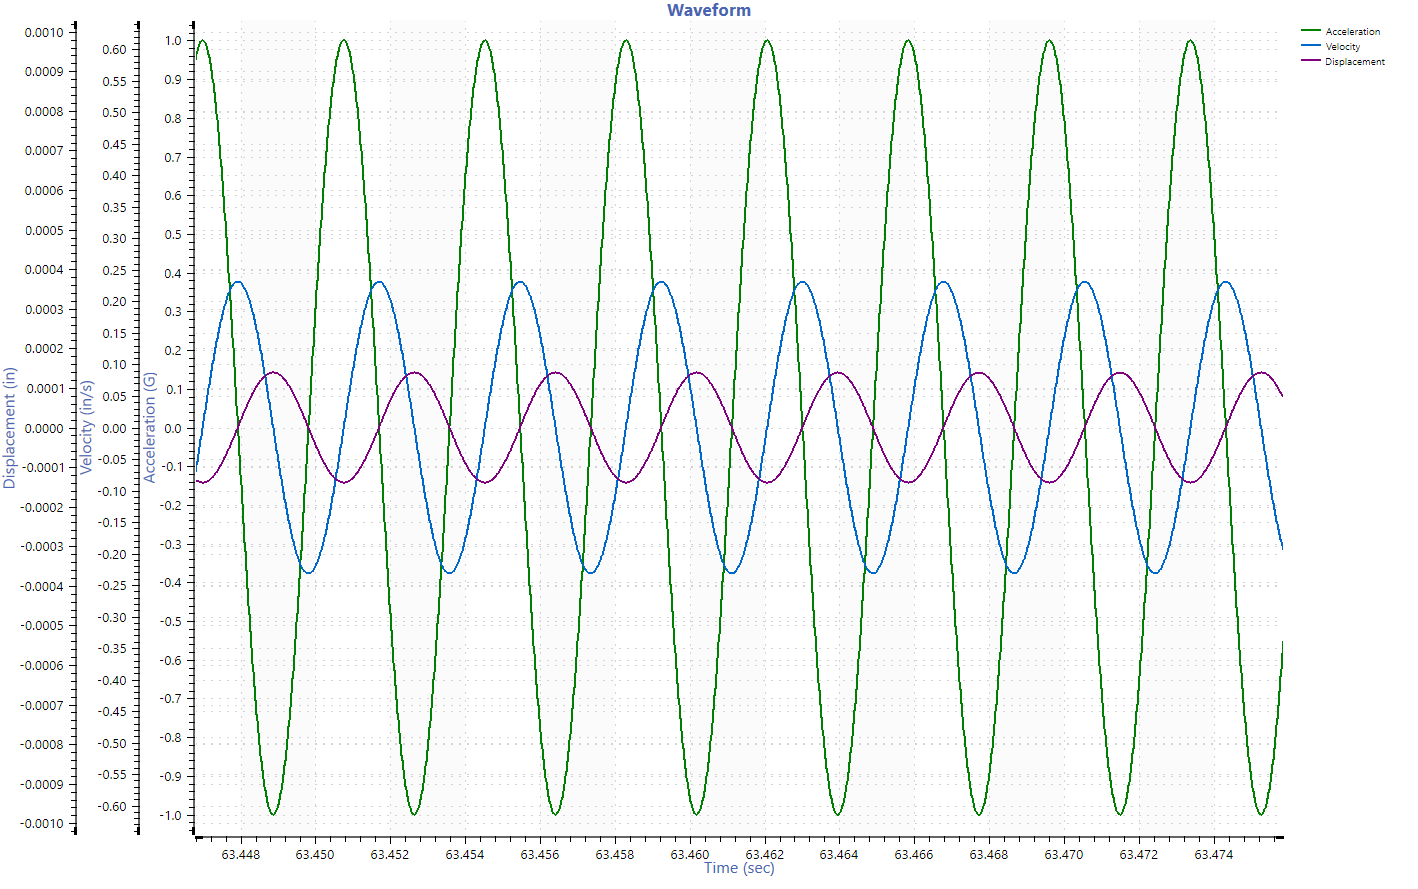
Convert Time Data to Velocity and Displacement
Enable a unit conversion from acceleration to velocity or displacement, and the software automatically performs integration or differentiation. This feature provides a new way to look at data and serves as a helpful diagnostic tool.
- Applies to time, FFT, PSD, and STAG graphs
- Specify the integration corner frequency (optional)
- Apply an additional low/high-pass filter to the converted waveform
- Takes seconds to process gigabyte-sized recordings
Requires an Advanced license.
Audio Channels
Audio Channels plays back data audibly from the computer speakers or another PC device as an additional tool for analysis. It also works with a Live Analyzer connection.
The sound of vibration data can help engineers validate a test profile or identify significant events. For example, if a random-only profile for an engine test does not sound like the original environment, it is likely missing significant sine tones. This feature differs from audio playback, which plays an audio recording from a microphone.
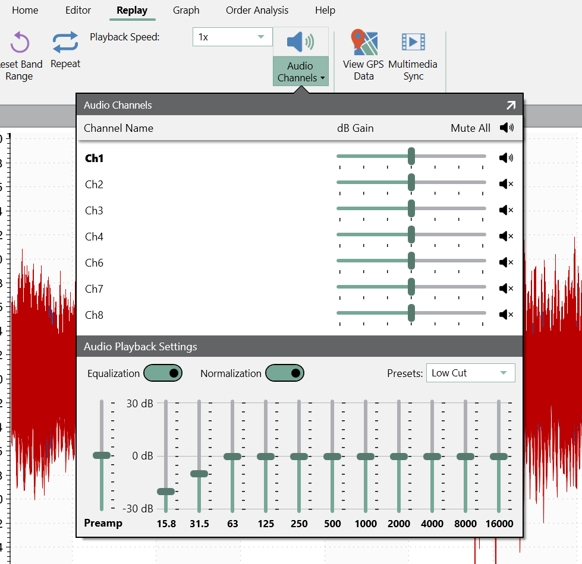
The Audio Channels option converts waveform data to audio. The user can adjust the audio for individual channels to listen into certain frequency ranges or boost a channel’s volume relative to the others. As the software derives the audio from sensor data, it will not include external audio as a microphone might.
Requires an Advanced license.
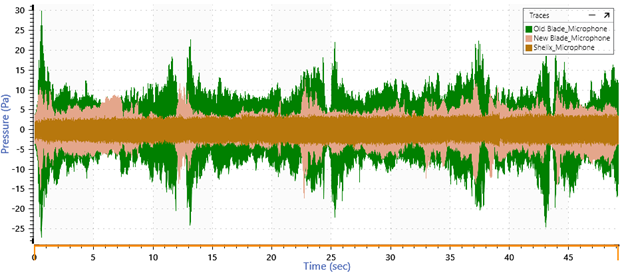
Overlay Recordings
New updates make it easier to overlay recordings, so they start and finish at relatively the same time. In previous versions of ObserVIEW, the software required you to combine recordings as a single CSV file. Now, you can automatically overlay recordings within the software. Version 2022.1 requires the Command Line GUI tool to combine recordings.
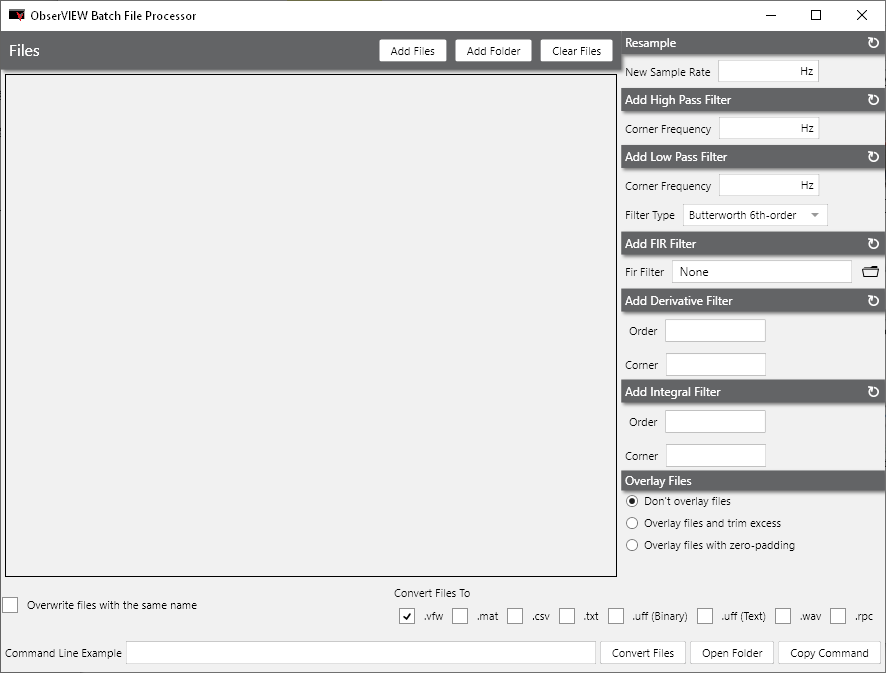
Batch File Processor
Modify multiple files with filtering or resampling, overlay files, select the conversion file type(s), and more.
Technology Previews
Test out features in development before the next release.
Math traces
In ObserVIEW, you can now create a math trace to display the result of a math function. The math function is a free entry field that builds a trace using existing trace data operated on by functions and operators.
Common Use Cases:
- Envelope the PSD of multiple traces
- Divide two traces to calculate the ratio
- Calculate the RMS or maximum value of a trace
3D Graph Options: Waterfall, Line Style, Color Styles
View a three-dimensional (3D) version of all graph types. Reviewing data from a different perspective can reveal important vibrational characteristics. New line styles for 3D spectrogram plots include waterfall, lines, wireframe, and dots.
Additional Previews
- Linear average of overlapped FFTs over the desired time range
- In-place high/low-pass time filtering
Download the Latest Version of ObserVIEW
Users with a valid Upgrades and Support Agreement (U&SA) can upgrade to the latest version of ObserVIEW for free. The demo version is available to any user for free.