A spectrogram is a graphical display that indicates the strength of a signal over time for a specified frequency range. It is a practical option when analyzing the frequency content of a waveform to distinguish vibrations. The visual display helps the engineer easily locate strong signals using a color scale. They can also view how the frequencies change over time.
The spectrogram recently proved valuable to the team at Vibration Research during the post-process analysis of recorded data. As an experiment, the engineers mounted sensors to an electric vehicle (EV) and one with an internal combustion engine (ICE). They drove them on the same route to gather acoustic and vibration data and compare the noise, vibration, and harshness.
During recording, the driver wore a headset to record speech on an audio channel. Figure 1 displays a section of the headset recording in ObserVIEW. In the time domain waveform (above), you can identify patterns of speech, but in the spectrogram (below), the variations in audio patterns are much clearer.

Figure 1. Time waveform and spectrogram of headset microphone channel.
Visualizing Vibrations
The test engineers also mounted triaxial accelerometers to the inside rear-view mirror, the windshield, and the strut tower. The spectrogram option was particularly useful for visualizing vibrations from the recordings because it provided an overview of the frequency content of a road section.
Most significantly, the EV’s strut tower displayed higher frequency vibrations than the ICE. From the time spectrogram of the EV strut recording (Figure 2), we can determine that most of the frequency content was contained between 30-200Hz, which is typical for EV components. For example, test standard SAE J2380—Vibration Testing of Electric Vehicle Batteries—requires a random vibration test frequency range of around 10 to 200Hz (scaled for G-levels).
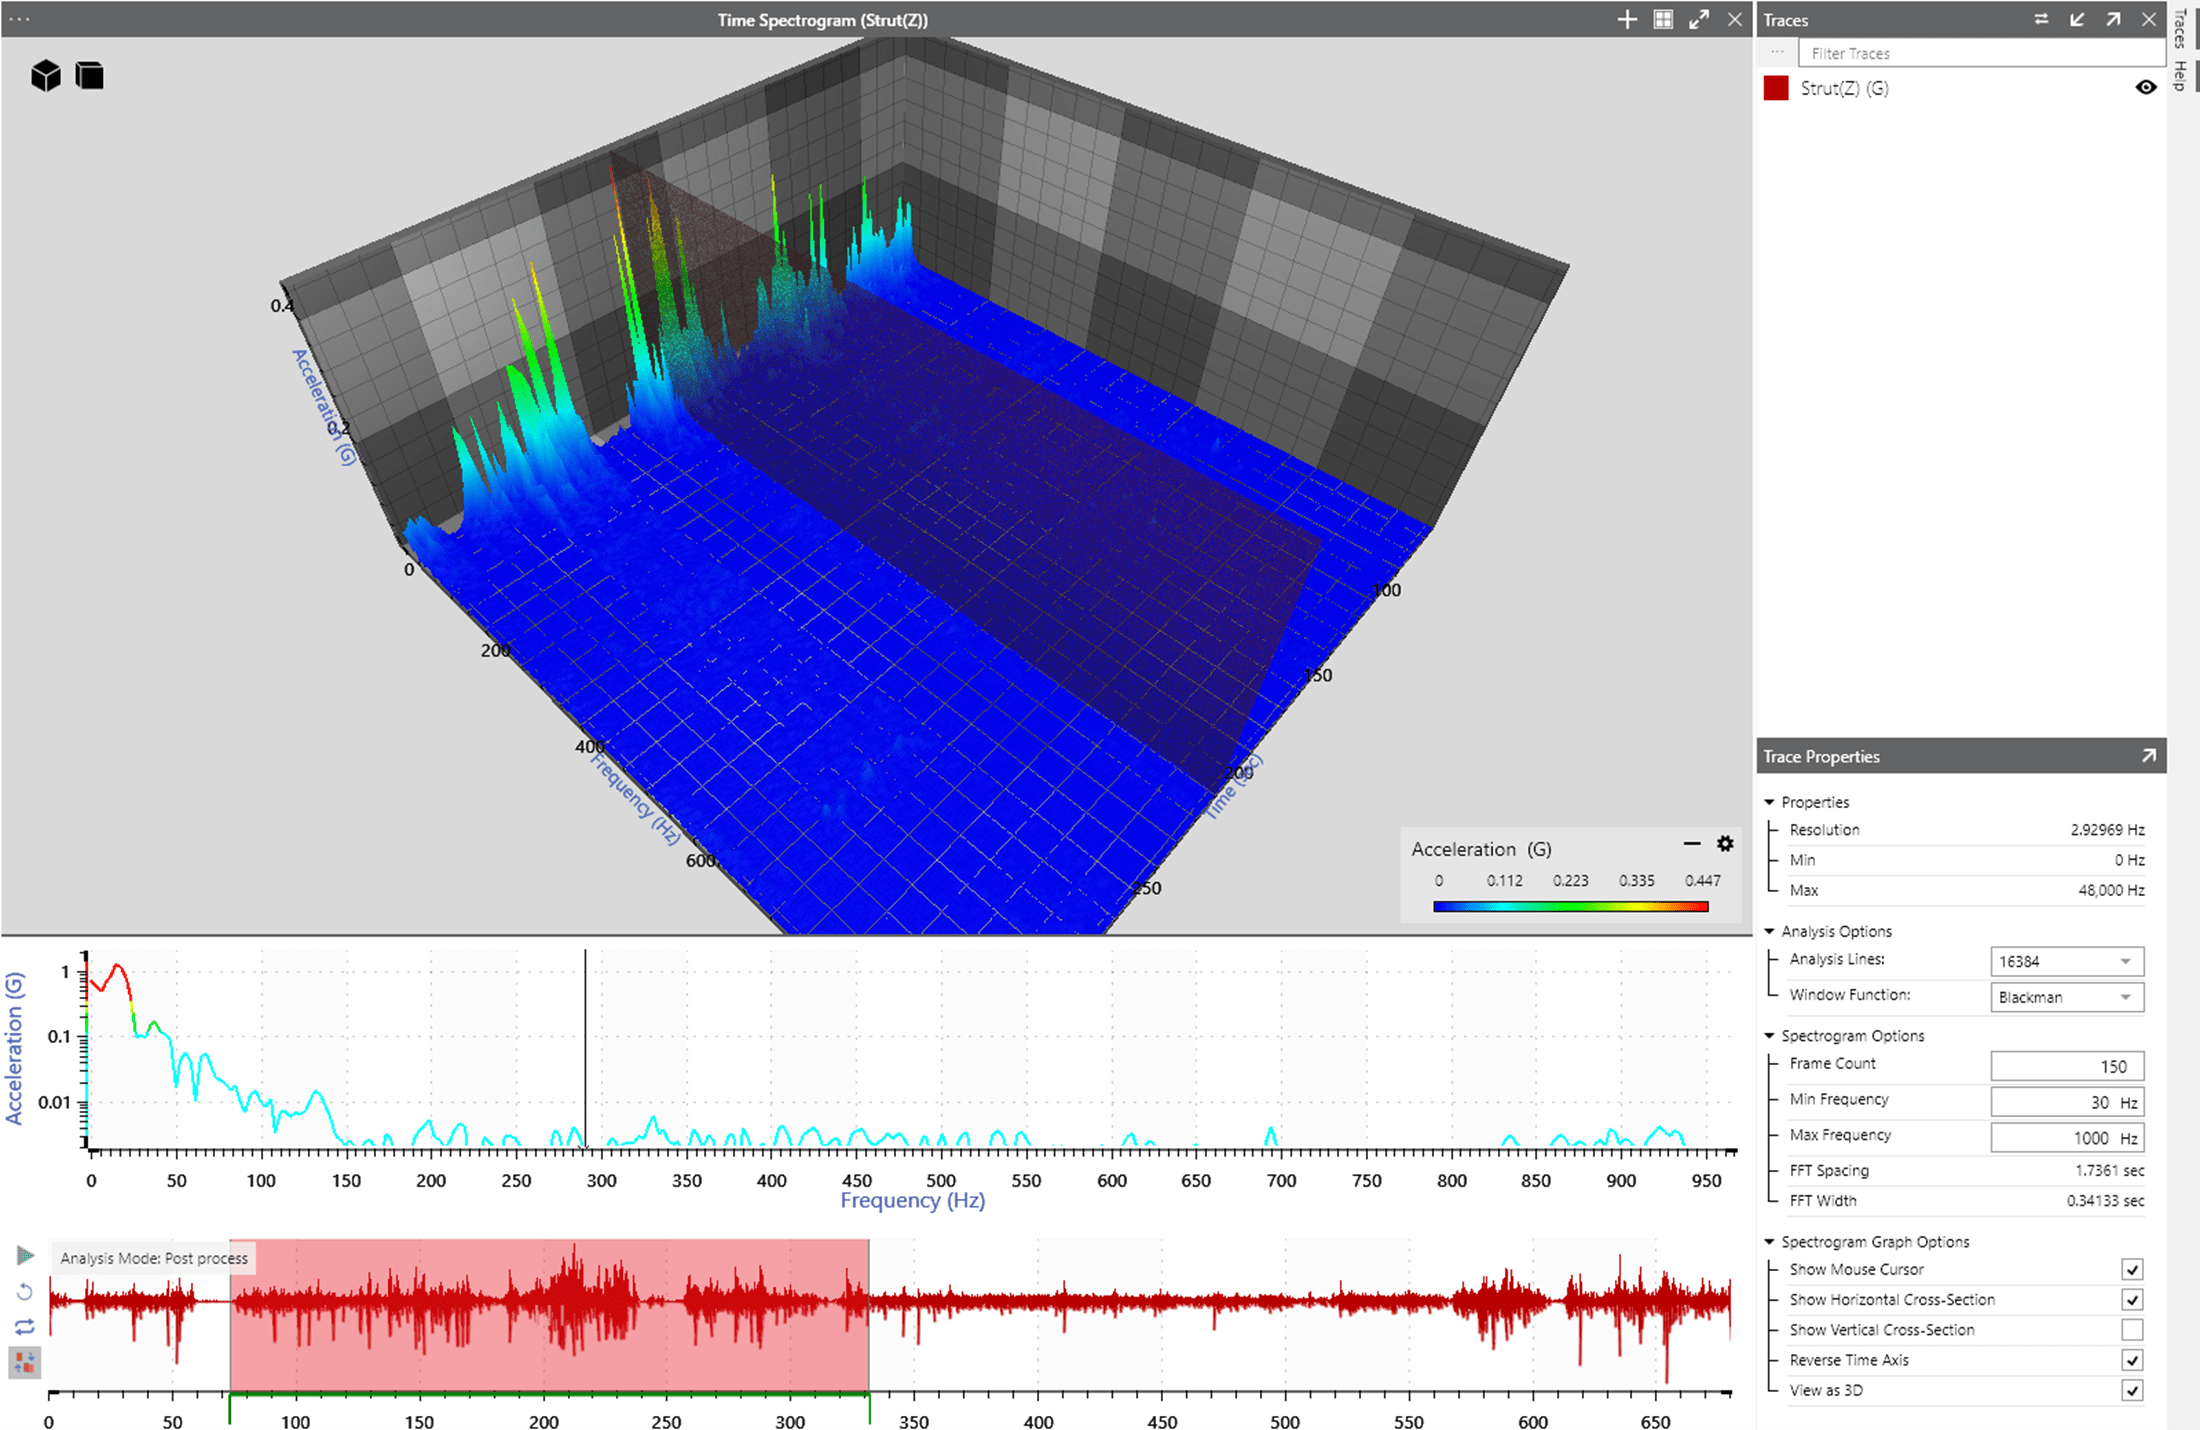
Figure 2. Time spectrogram of EV strut recording (z-axis).
A horizontal cross-section of the spectrogram (Figure 3) indicates the greatest amplitude of this recording section was 2.5290G at 14.648Hz.
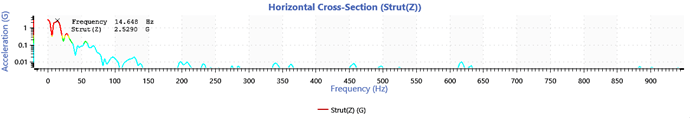
Figure 3. Horizontal cross-section of time spectrogram.
Spectrograms for Analyzing Recordings
A time-domain waveform can indicate an event of interest, but it does not specify the location or characteristics of the event. The spectrogram is a collection of time-frequency analyses; as such, engineers can use it to identify parameters of nonstationary or nonlinear signals. A spectrogram helps analyze real-world data with various frequency components and/or mechanical and electrical noise.
A spectrogram is most helpful for vibration analysis in a changing environment. It illustrates the patterns of energy change that may not be visible in an FFT or PSD. Compared to an FFT, a spectrogram gives a better picture of how the vibration changes over time.
In a spectrogram, there are many indicators of damage, and they can be complex. Still, atypical bands can provide useful information regarding potential damage.