When setting up or adjusting a random vibration test, engineers take note of peaks that pose a risk of damage to the system or device under test (DUT). They may also contend with noise (typically at high frequencies) that a) distorts the vibration signal of interest or b) is irrelevant.
An engineer may seek to limit vibration at a specific frequency or amplitude for various reasons. Clipping and filtering are two options most modern vibration control systems offer for signal processing. This article will compare these two methods, addressing their purpose, when to use them, and their differences.
Filtering
Filtering is an operation that rejects or accepts data components based on frequency. Filters are designed to attenuate or boost specific frequency components.
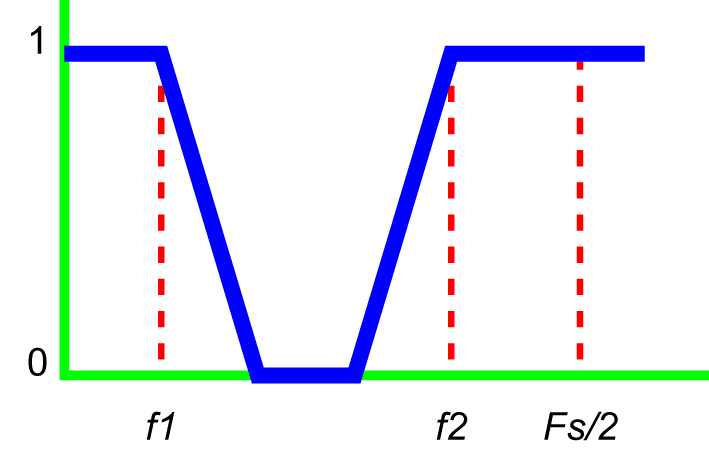
A notch filter rejects a band of frequencies and accepts everything outside of the rejected band.
Filtering applications are wide-ranging. In vibration testing, digital signal processors use filters to condition signals, and most software programs include user-defined filtering options.
Notching is a filter type common in random testing that rejects the response at specific frequencies. It helps engineers avoid over-testing at resonant frequencies while achieving the proper test levels.
Why Use Filtering?
A vibration signal often includes more data than is relevant to the engineer. Sometimes, the data can be inconsequential, and filtering it out streamlines their analysis. Other times, the data can skew the analysis, such as in the case of aliasing, or obscure system issues. Depending on the application, filtering can improve control or simplify processing.
An engineer may also identify specific frequencies at which the response poses a risk to the system. Filtering can attenuate the response at these specific frequencies.
Examples
- Noise Reduction: attenuate high-frequency noise components to improve the signal-to-noise ratio and visualization of the desired signal.
- Harmonic Analysis: isolate specific frequency bands corresponding to harmonics to study the vibration characteristics associated with rotational components.
- Resonance Detection: remove frequencies associated with known resonances to focus on analyzing other parts of the frequency spectrum or identifying additional resonances.
- Transient Analysis: remove low-frequency baseline drift or steady-state vibrations to isolate and analyze a structure’s transient response to excitation.
- Environmental Interference: attenuate specific frequencies associated with sources of external interference.
Clipping
Sigma clipping is a statistical method of removing outliers or extreme peak amplitude values from random vibration data. It is a user-defined action not to be confused with a clipped signal due to a test error.
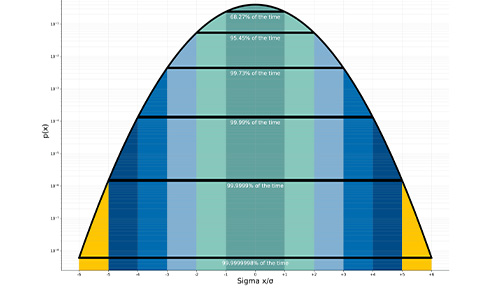 Sigma clipping uses a normalized probability density function (PDF), which organizes a signal’s probable peak distribution into standard deviations from the mean (1σ, 3σ, etc.). Engineers set a sigma clipping level based on the signal’s likely distribution, and the controller limits data that deviate from the mean by the specified number of standard deviations.
As this statistical analysis applies to randomly distributed data, sigma clipping is an application solely for random vibration testing.
Why Use Sigma Clipping?
Typically, engineers set a clipping level to protect the amplifier. Traditionally, vibration controllers apply a clipping limit to the output (drive) waveform, which removes the higher voltage peaks from the output. Voltage clipping can prevent over-voltage (and potentially over-current) tripping of the input signal to the amplifier.
Few clipping methods can limit the peak acceleration, velocity, or displacement on the shaker table. VibrationVIEW’s TruClip™ is an innovative clipping method that allows tests to run closer to the physical system’s acceleration/velocity/displacement limits while avoiding levels that would otherwise abort the test.
What Clipping Level Should I Use?
Most vibration controllers’ statistical analyses assume a Gaussian distribution of random vibration. Gaussian-distributed random data is typically within 3x the root-mean-square (RMS) (a 3σ standard deviation from the mean). Less frequently, the data will have peak values of 4x the RMS and, rarely, 5x or more the RMS. The longer the random test runs, the more likely the occurrence of the higher peaks becomes.
Generally, test specifications define sigma clipping as a minimum number, meaning the random signal should reasonably match a Gaussian distribution at least out to 3σ. If a specification requires a minimum of 3σ, engineers can typically run the test at any clipping level greater than 3 or without clipping. “No clipping” results in a truly Gaussian random output signal.
A sigma clipping level of 6 or greater will not typically affect the test, as Gaussian data rarely reach 6σ. A typical clipping value is 3. Values lower than 3 will create more distortion than is acceptable.
Distortion
Sigma clipping creates in-band distortion that can interfere with the control signal. However, it may be a necessary trade-off to limit maximum peak values.
Should I Clip or Filter my Random Vibration Test?
Sigma clipping and filtering are vibration signal processing techniques that serve different purposes. Sigma clipping uses statistical analysis to identify and remove peak values based on their deviation from the mean. It does not directly alter the signal’s frequency characteristics but reduces the impact of extreme values. Filtering is a broader concept that involves modifying a signal’s frequency content. Engineers can apply filters to selectively attenuate or boost frequency components.
Filtering does not inherently involve clipping or limiting the amplitude of the signal. Likewise, sigma clipping is not a form of filtering; it is a distinct operation that directly affects the signal’s amplitude by truncating its peaks at a specific level.