All Software Features

Text File Import

Import Recording Files from Any Hardware

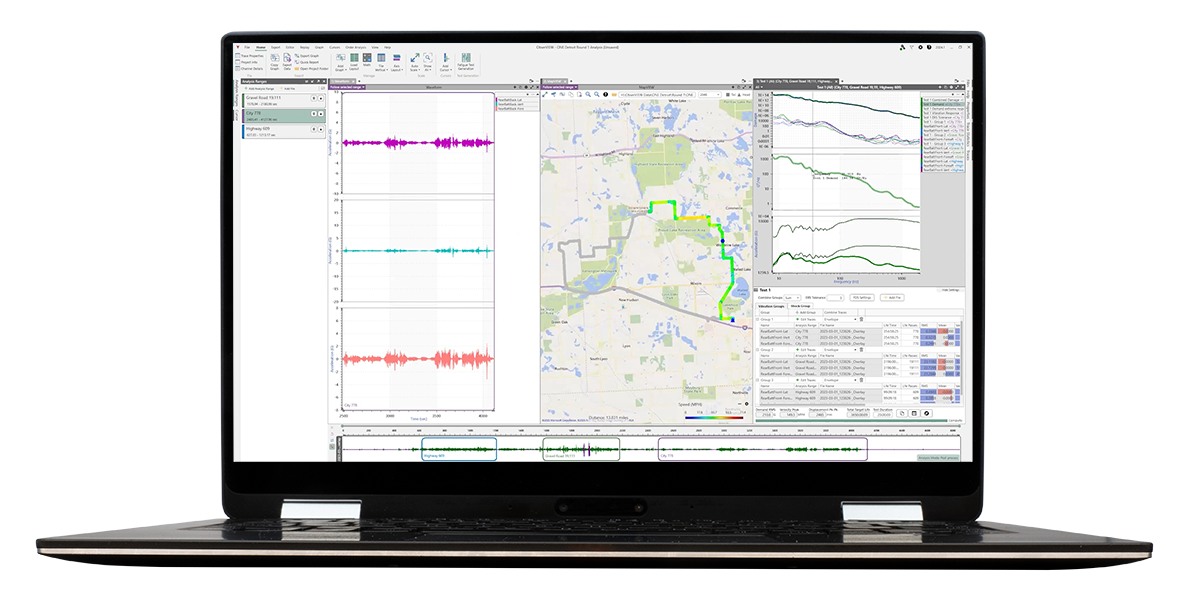
Analyze files from any data acquisition system in the ObserVIEW analysis software. The text import feature supports most text and CSV files, allowing engineers to apply the powerful features of ObserVIEW regardless of hardware.

Download Demo All Software Features
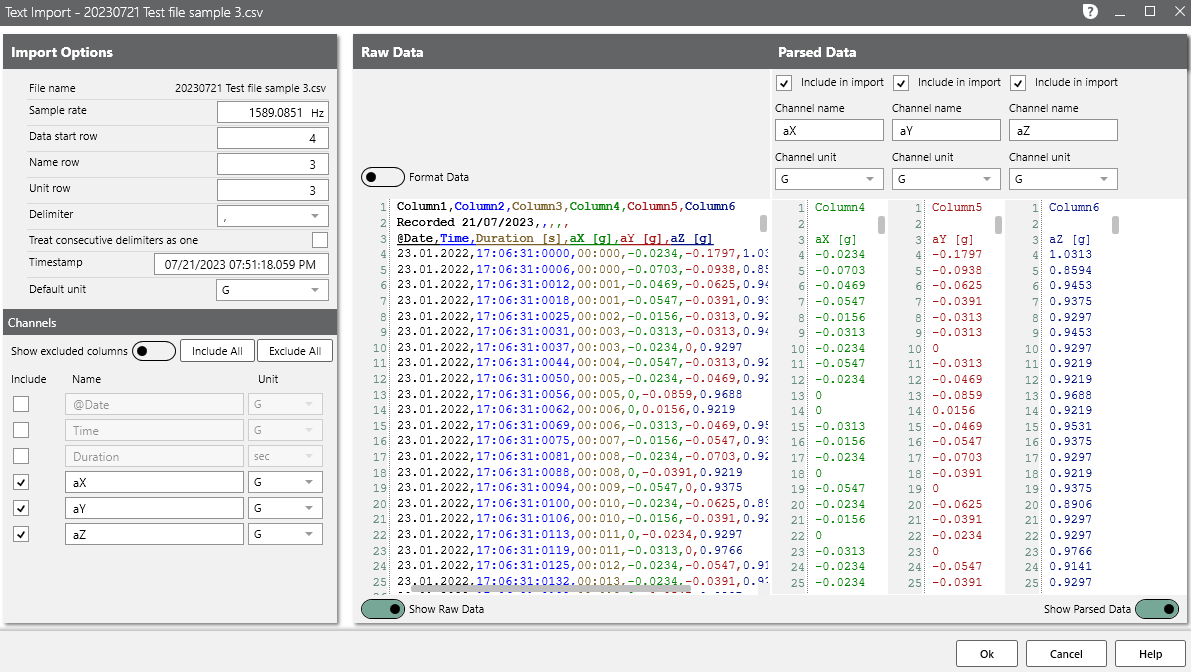
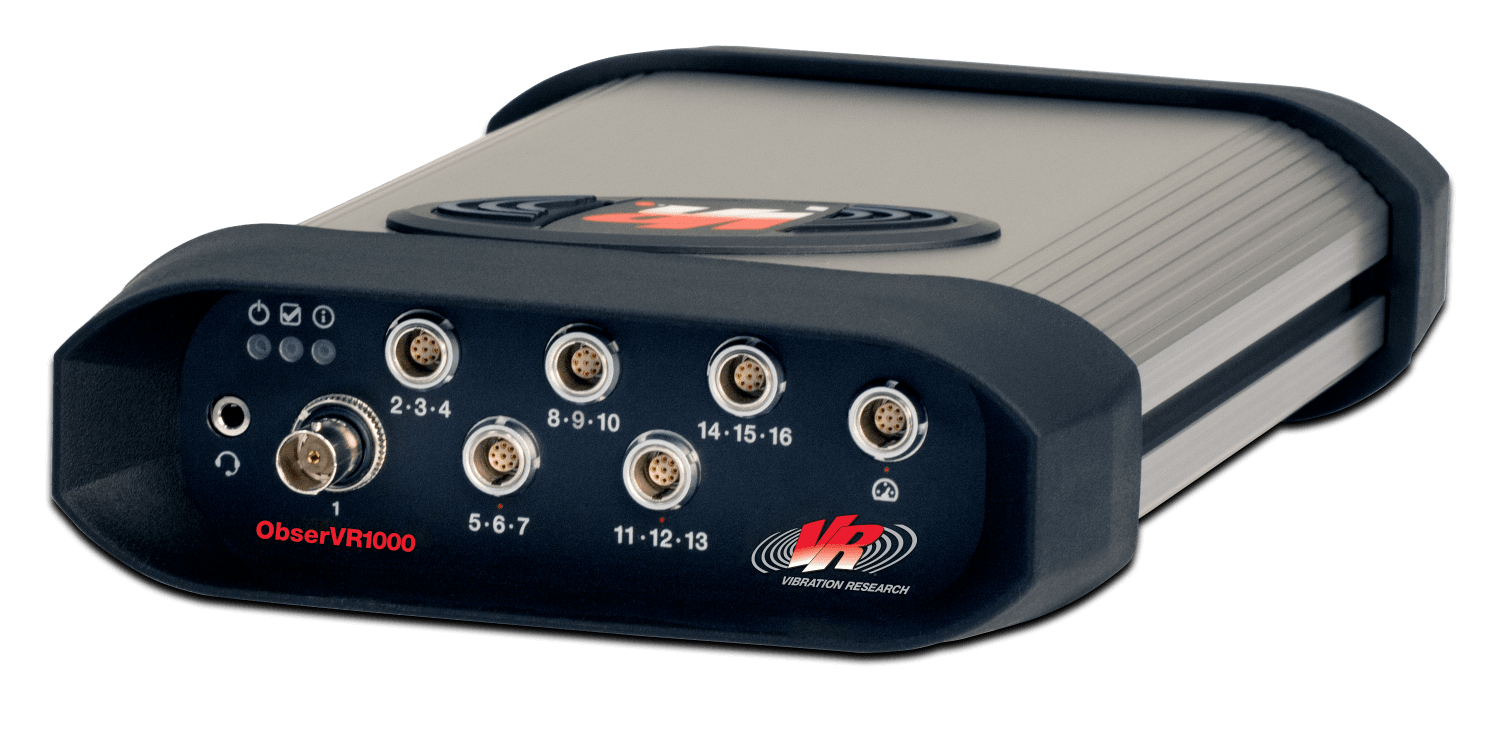
Analyze Data from Any DAQ

Are you interested in using ObserVIEW but have a data acquisition system from another manufacturer? Not a problem! The software’s text import feature allows engineers to import nearly any text or CSV file. Now anyone can apply ObserVIEW’s comprehensive list of features to analyze data efficiently.

Additional Capabilities

Using the Text Import dialog, the user can:

  • Define the waveform sample rate
  • Define the units for each channel or apply the same one to all
  • Exclude channels from the analysis
  • Define the text file’s delimiter
  • Toggle between raw data and parsed data

Ready to Upgrade?

The ObserVR1000 is the field engineers’ solution for smart data recording. Portable and powerful, engineers can collect data with the press of a button using this battery-powered hardware and the VR Mobile interface.

  • ObserVR10004 – 128 available inputs
  • 6+ hour battery life (additional 6 with battery pack)
  • GPS capability
  • On-board storage (SD or WiFi to PC)
ObserVR1000 thumbnail

ObserVR1000

VR Mobile

With the VR Mobile interface, engineers can set up and monitor data recording/vibration control from an iOS or Android device. On the app, they can configure inputs, set up autonomous actions, monitor activity, and more without a wired configuration.

  • Triggering: set up actions to occur automatically following an event
  • Live Analyzer: view data in real-time and then pause the live stream to select, analyze, and export a section of the time waveform

Why ObserVIEW?

ObserVIEW is a powerful and efficient vibration analysis software that includes specialized modules for waveform recording and test generation. View, edit, and analyze waveforms from recorded or live data for reporting or shaker control.

  • Data editing: crop, copy, cut, and paste sections of a waveform or append multiple compatible files
  • Signal analysis: includes FFT, resampling, filtering, PSD, transfer function, and more
  • Modal testing: intuitive project setup dialog that guides parameter selection and automatic location sequencer that instructs when and where to strike the DUT
  • Octave analysis: analyze sound recordings, measure dB levels, and determine overall RMS for each channel

Feature Highlights

Playback Synchronized Media

Test engineers often collect video, audio, GPS, and other media during waveform recording. With Multimedia Sync, you can analyze and playback this media in sync with the recording for a more robust view of events.

 thumbnail

Math Traces

The math traces feature in the ObserVIEW software adds a user-defined math expression to a time or frequency graph. Math traces allow the user to plot custom math operations not defined by the software’s current graph types.

Analyze Fatigue Damage

Calculate the relative damage a product experiences in a defined period with the fatigue damage spectrum (FDS) computation. The FDS plot displays a product’s fatigue for a set frequency range. It is a visualization and analysis tool that shows the amount of fatigue damage a product will see whether in the lab or the field.

View All Features

How Can We Help You?

Contact Us