The tachometer is commonplace in vibration analysis when the test item has a rotating component, such as a motor or machine. Tachometers measure rotational speed, usually in rotations per minute (RPM). Engineers can use information from this measurement, along with the vibration of the rotating component, to bolster their analysis.
Vibration of Rotating Components
Rotational vibration is typically sinusoidal with a frequency related to the rotational speed and its harmonics (multiples of the reference RPM) [1]. Engineers should consider sinusoidal vibration when designing rotating machinery, as it can impact performance and reliability. If its frequency is close to another component’s fundamental frequency, resonant excitation may occur and cause damage.
Additionally, a rotating component’s sinusoidal vibration will change as the component fatigues, potentially shifting its frequency and harmonics. Analyzing a test item’s rotational vibration can help engineers monitor conditions and diagnose faults.
Benefits of Tachometer Data

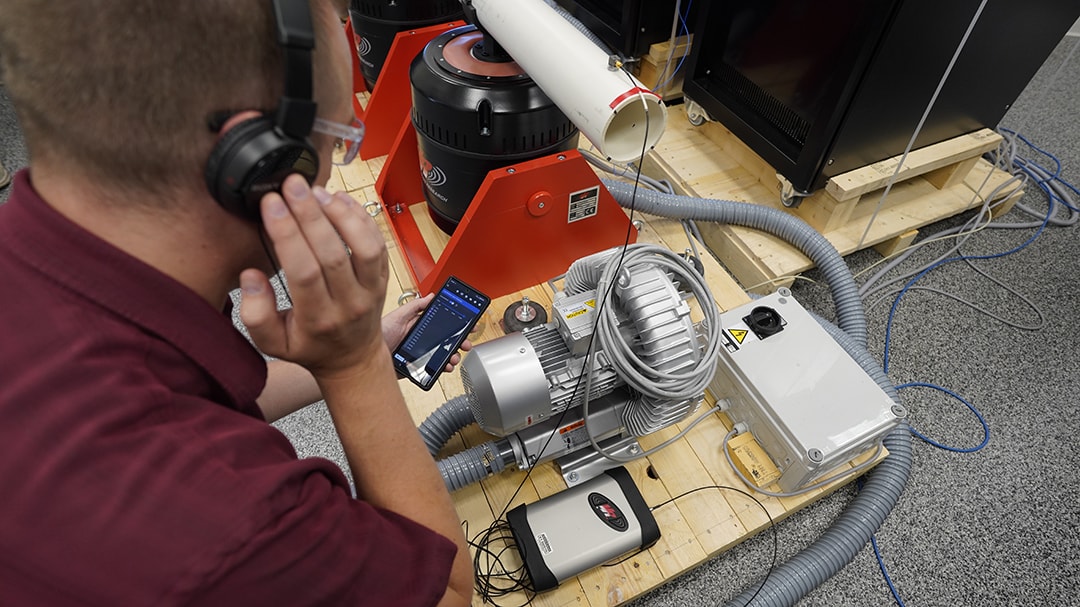
Mounting an accelerometer to measure vibration.
A vibration transducer, such as an accelerometer, detects the vibration of a rotating object. Engineers can correlate the rotational speed from the tachometer with this vibration data to analyze patterns. Synchronizing the recordings allows for a comprehensive understanding of machine behavior and helps detect issues related to vibration and rotation.
Example Tachometer Applications
- Detecting issues like unbalance and misalignment, which can vibrate at a frequency related to the rotation
- Detecting machinery faults; vibration irregularities at frequencies related to the rotation can indicate problems with the rotational component, like gear damage or tooth breakage
- Tracking variation in rotation speed, allowing for a more accurate vibration analysis of complex machinery
- Identifying the critical speeds at which resonance may occur
- Monitoring changes in rotational speed to detect abnormal conditions or wear in the machinery
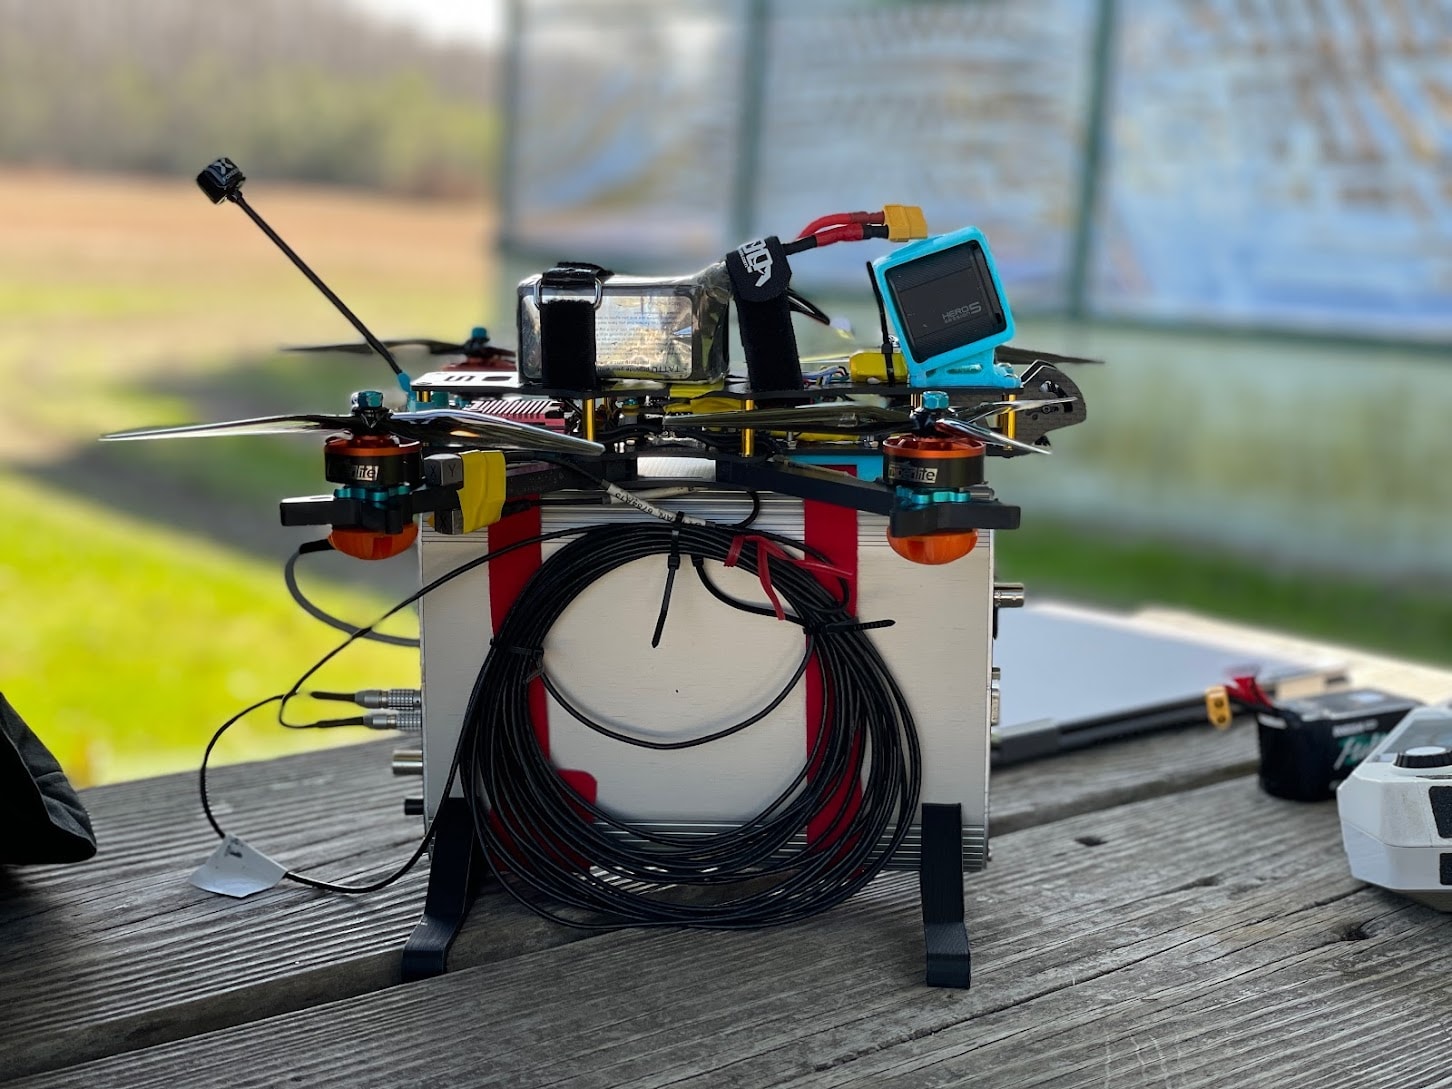
A drone recording setup with a tachometer wired into the motor.
Order Analysis
One specific application of tachometer data is order analysis. Order analysis differentiates rotational vibration from random vibration in an output signal. Engineers can use this method to identify how a rotating component contributes to a machine’s overall vibration levels.
Order analysis separates rotational or reciprocating vibration into “orders” corresponding to the reference RPM and its harmonics. Fatigue and damage often relate to harmonics, and analyzing order content helps locate/prevent faults.
To extract orders from recorded data, engineers often perform a run-up or coast-down that steadily increases the RPM as a sweep. The analysis software plots the frequency response versus angular velocity (calculated from the RPM) and extracts the orders. In the ObserVIEW software, for example, a tracking filter that closely follows the RPM of the tachometer trace extracts vibration data for the selected order number while rejecting out-of-band data. Engineers can then analyze/manipulate the data and compare amplitudes to assess the orders’ significance.
A spectrogram is a helpful tool to help identify order lines. It displays the strength of a signal over time at various frequencies. Below is a time-history waveform with an RPM trace and a tachometer-based spectrogram; the dashed red lines indicate the orders with the highest amplitudes.
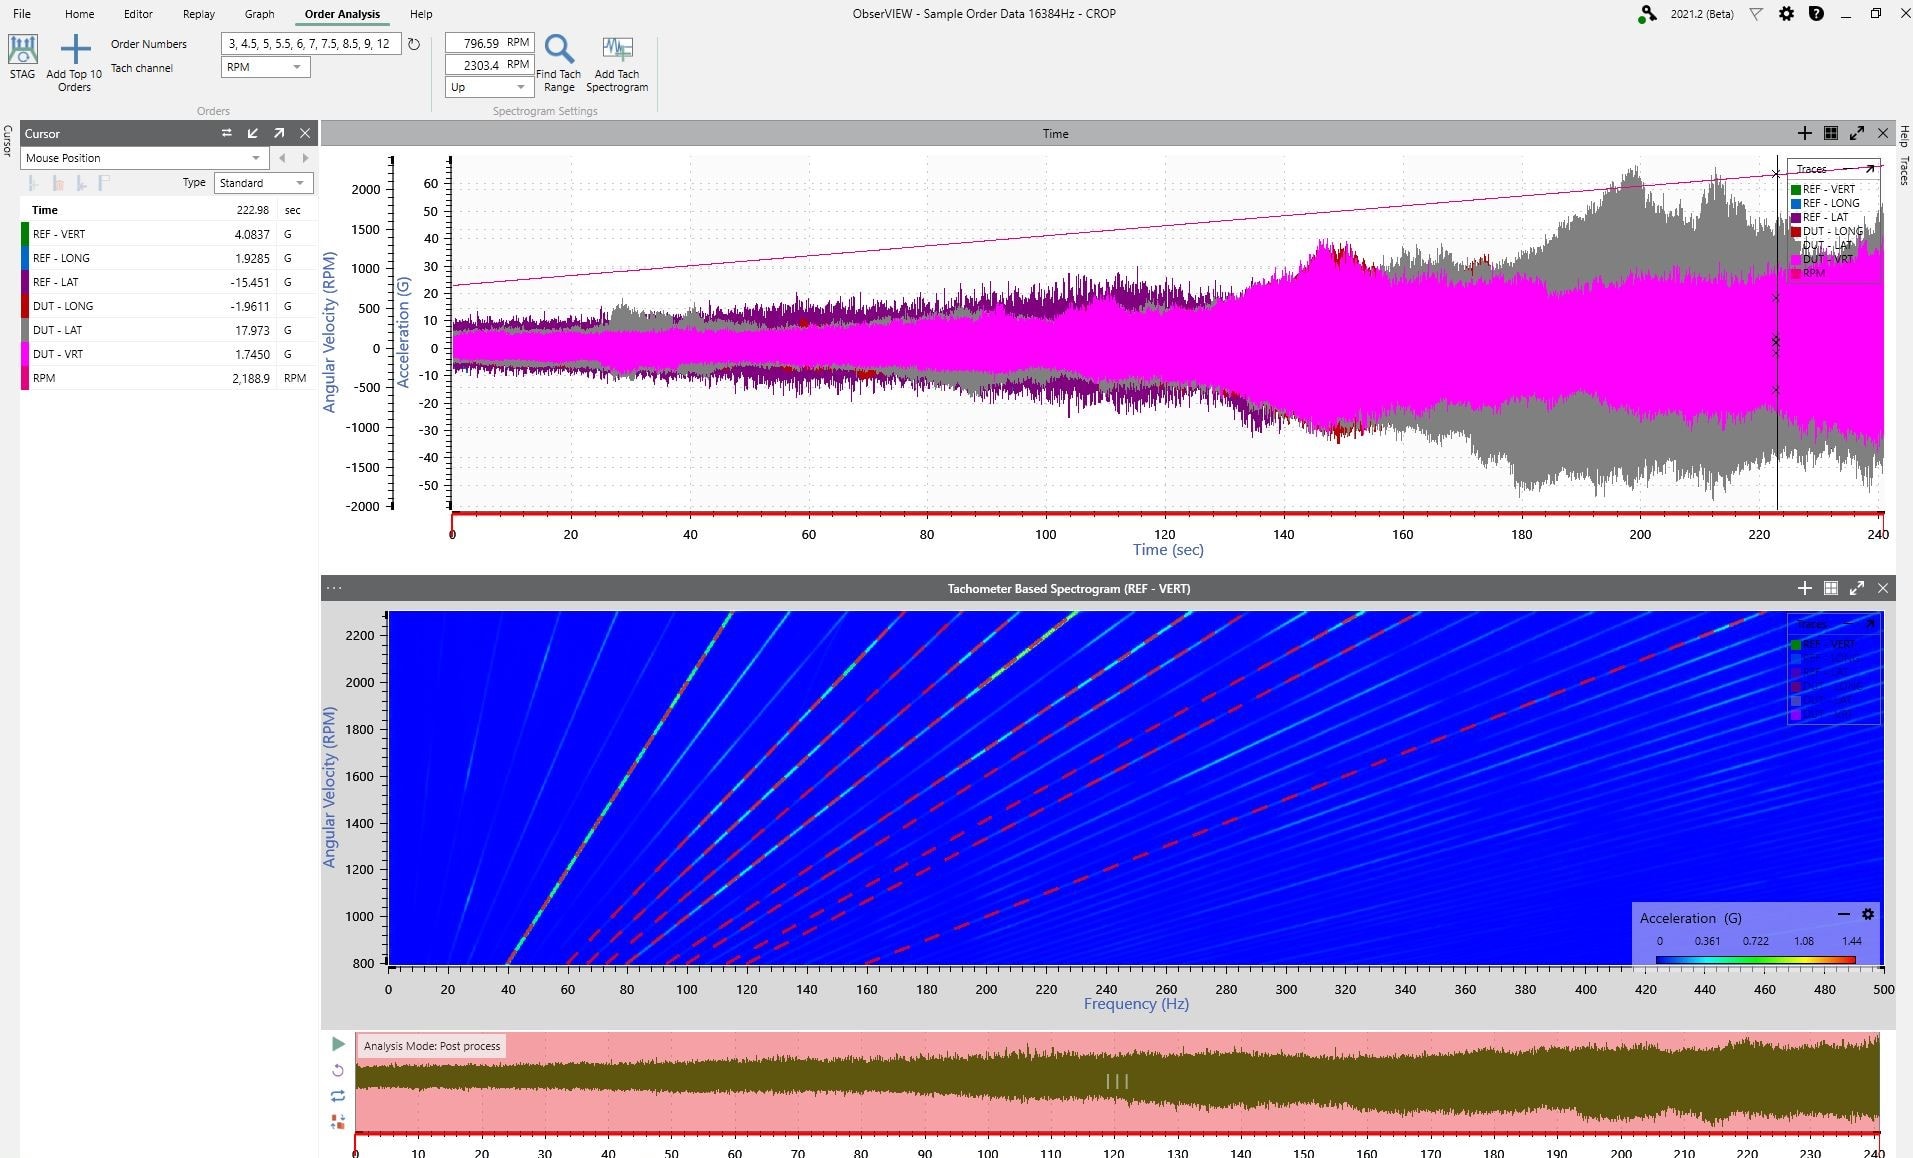
Angular velocity vs. time (top) and tachometer based spectrogram (bottom).
How to Record Tachometer Data
Tachometers vary in design and configuration. There are contact and non-contact instruments, as well as laser and optical options. A typical selection for vibration recording may include:
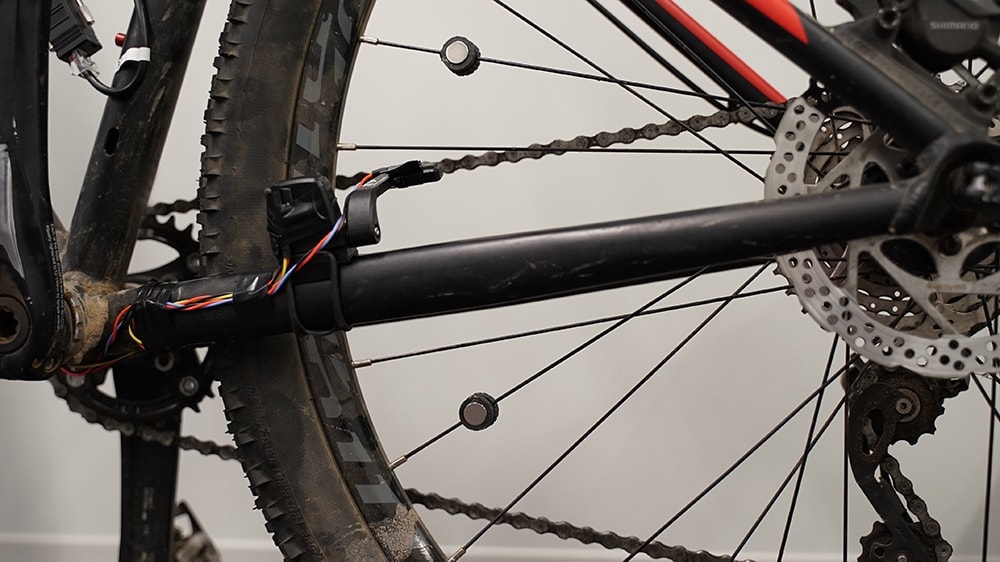
Tachometer attached to a bike wheel, using a reflective surface to measure pulses.
- Non-contact tachometer, where the tachometer pulse is triggered by the passing of reflective tape adhered to the rotating component
- Magnetic tachometer, where a magnetic pickup near the rotating component produces an electrical pulse at a frequency proportional to the rotational speed
Data acquisition (DAQ) devices such as the ObserVR1000 support tachometer inputs for synchronous recording with vibration. The ObserVR1000’s tachometer input LEMO connector is on its front panel. After connection, the user can configure the tachometer in the VR Mobile application. The parameters include:
- Tach type (dual or quadrature)
- Encoder type (wheel, rotational, or scalar)
- Wheel diameter and units
- Tach position units and speed units
Recording Considerations
Engineers can apply a low-pass filter to the tachometer signal to remove high-frequency noise. In VR Mobile, the Tach Filter Width determines the corner frequency for the low-pass filter. A too-narrow corner frequency can distort fast changes in the tachometer reading.
The sampling rate determines the interval at which the data acquisition system measures the tachometer signal and sequences the values. A machine with rapid RPM changes requires a higher sample rate to capture accurate data. Engineers should also consider the characteristics of the low-pass filter, the maximum RPM, data storage, and the instrument’s precision when selecting a tachometer’s sample rate.
The trigger level determines the level at which the DAQ device records the tachometer signal. It may be a threshold voltage level/range or an amplitude on the signal’s rising positive edge/falling negative edge.
More generally and according to Aherwar in [2], several factors influence the vibration of rotational components: “(i) the rotational speed of the items; (ii) the background noise and/or vibration level; (iii) the location of the monitoring transducer; (iv) the load sharing characteristics of the item; and (v) the dynamic interaction between the item and other items in contact with it.” Engineers may consider these factors when analyzing rotational components.
Record Tachometer Data
 The ObserVR1000 portable DAQ and signal analyzer includes a configurable two-channel tachometer input. Engineers can use the VR Mobile application for smart setup, monitoring, and interaction with the ObserVR1000.