Vibration controllers collect data in the time domain, such as the change in acceleration over time. However, it is often advantageous to view the data in a different domain for analysis.
When performing vibration analysis, the frequency domain is the typical choice. Frequency data gives more insight into patterns such as resonant frequencies and peak amplitudes, which largely account for the damage to a system.
Two analysis types performed in the frequency domain are the fast Fourier transform (FFT) and power spectral density (PSD). As both display data in the frequency domain, engineers may ask: what’s the difference? Looking at the calculations for the FFT vs PSD offers a helpful explanation.
Article Overview
- How FFT works and what it reveals about signal frequencies
- What PSD measures and why it’s the standard for random vibration analysis
- The key differences between FFT and PSD analysis methods
- When to use FFT versus PSD for your vibration testing applications
- How PSD provides consistent measurements for comparing different signals and meeting specifications
Fourier Series for Projecting Time Data
Engineers often use the Fourier transform to project continuous data into the frequency domain [1]. The Fourier transform is an extension of the Fourier series, which approaches a signal as a sum of sines and cosines [2]. It states that any signal can be separated, or analyzed, into a spectrum of discrete frequencies.
Continuous data refers to a signal not yet sampled by an analog-to-digital converter (ADC). However, many data acquisition devices on the market perform ADC before output. For discrete-time data (digital data collected with the assistance of an ADC), projection is achieved using one of several mathematical operations: the discrete-time Fourier transform (DTFT), the discrete Fourier transform, or the fast Fourier transform (FFT).
Fast Fourier Transform
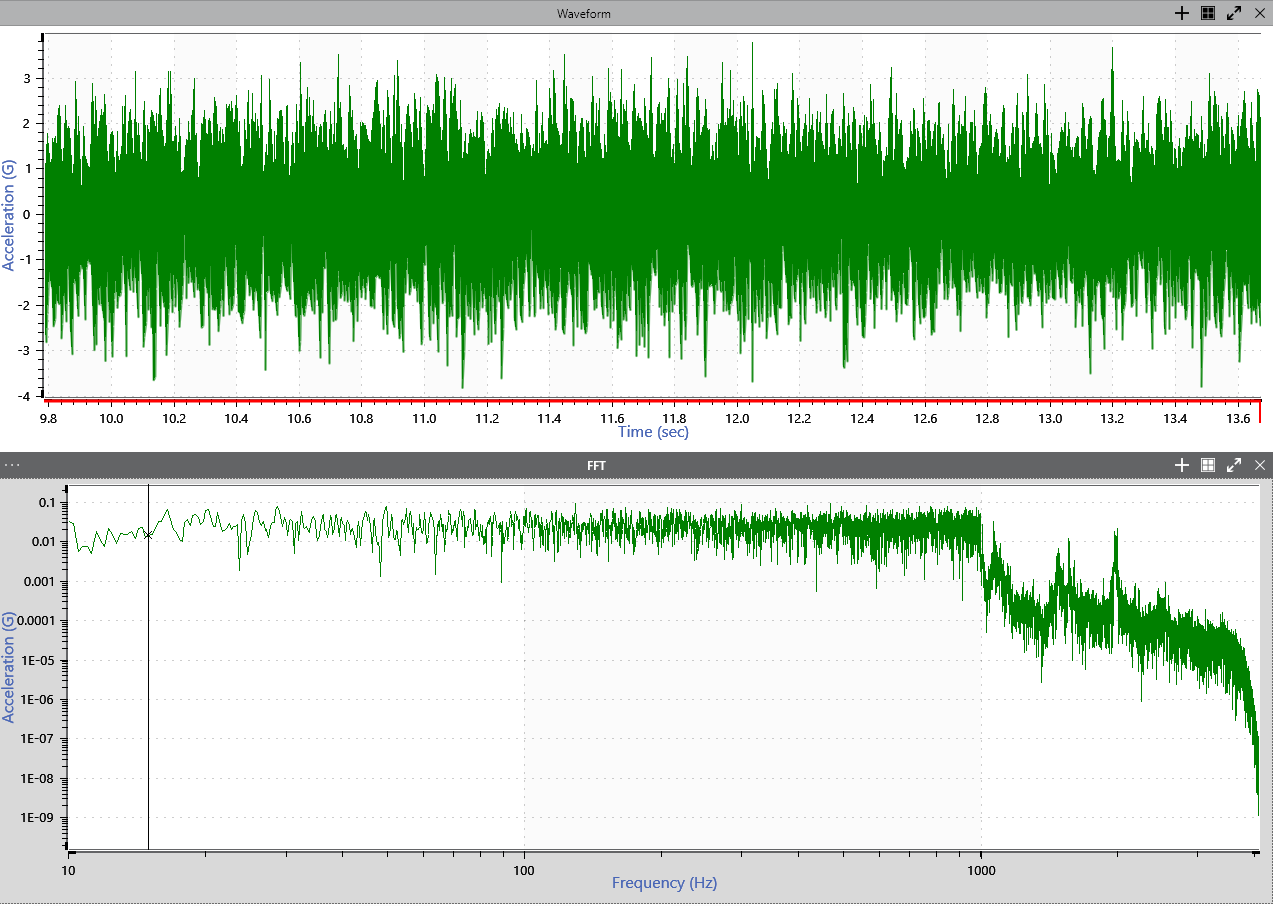
A time waveform (above) and an FFT derived from the time data (below).
The FFT is a computational algorithm that efficiently implements the DTFT. Its algorithm uses a sequence of N number of digital samples, where N is a power of 2. The highest frequency that the FFT can resolve is the Nyquist frequency so there are N/2 frequency values.
The signal, x, must be conditioned by a low pass filter before it is digitized to remove frequencies above the Nyquist frequency. For more details on sampling, check out our free Sampling & Reconstruction course.
Why Use the FFT for Analysis?
In a complex signal, the FFT helps engineers determine the frequencies that are being excited and their amplitudes. Additionally, it highlights the changes in frequency and amplitude and the harmonic excitation in a defined frequency range.
Engineers often use an FFT graph to monitor the frequency spectrum. They can focus on changes while viewing live data or analyzing a time-history file and determine characteristics such as:
- Frequency excitation at a defined period
- Peak acceleration of each frequency in a frame of data
- Distribution of peaks
- Harmonic content
However, to view the energy distribution across the frequency spectrum, we must calculate the PSD from the FFT.
Power Spectral Density & Random Vibration Analysis
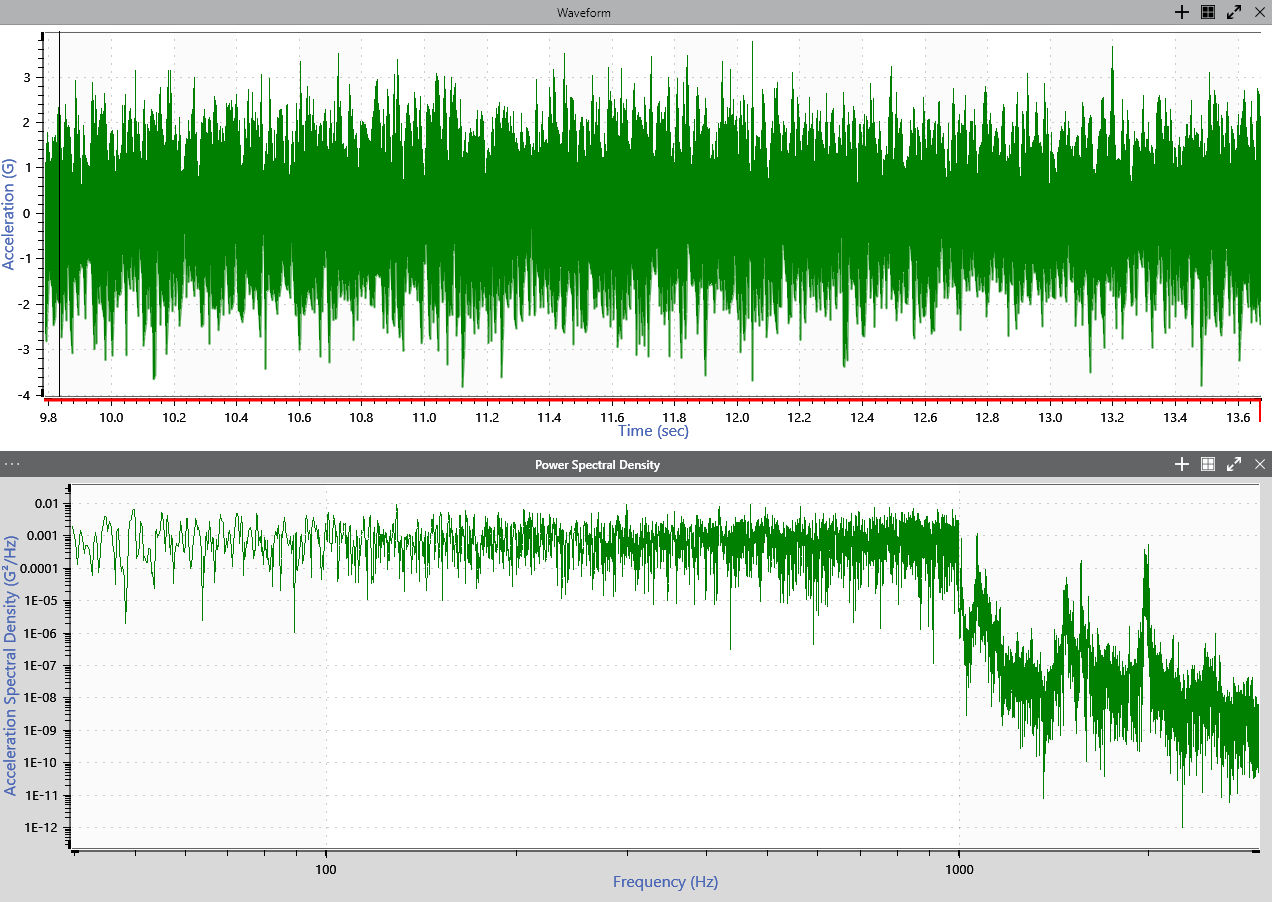
A time waveform (above) and a PSD derived from the time data (below).
The PSD is the most common tool for analyzing random vibration. Resonances and harmonics not readily available in a time waveform are often visible in a PSD graph. In practice, generating a PSD is usually the first step in examining and analyzing a random waveform.
Like the FFT, the PSD displays data in the frequency domain. Therefore, the PSD calculation must determine the signal’s frequency spectrum. Vibration Research software uses Welch’s method of PSD estimation, which applies the FFT to transfer frames of data from the time to the frequency domain [3].
PSD Calculation
The process starts with a random time waveform. The algorithm takes frames of equal length and applies the FFT to each frame. Then, it calculates the squared magnitude for each frequency bin and finds the average. The mean-square value is the “power” of the quantity and measurement of signal strength.
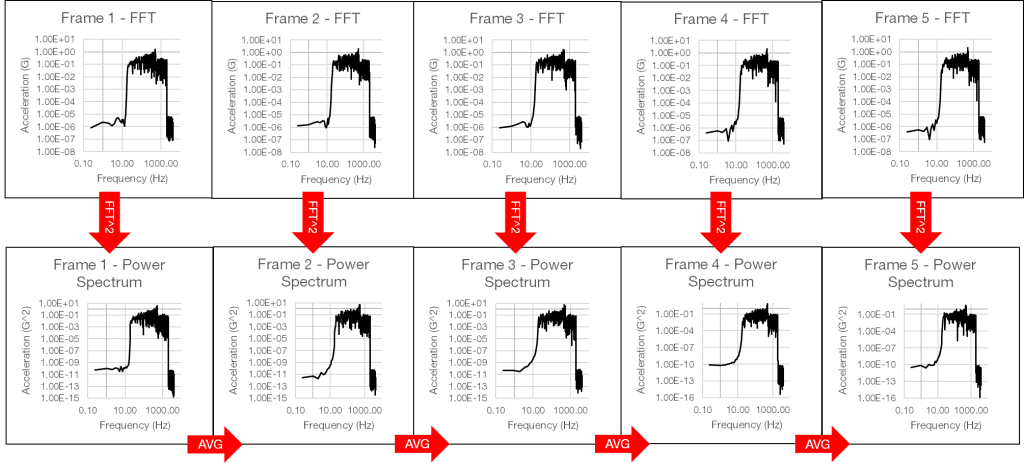
Image from the Calculating PSD from a Time History File lesson.
Finally, the algorithm divides the mean-square value by the sample rate to normalize it to a single hertz. To obtain a linear value, we can take the square root of the mean-square value to obtain the root-mean-square (RMS).
The magnitude of a signal’s frequency distribution depends on the number of frequency bands in the distribution. The PSD divides the squared magnitude by the frequency bandwidth to provide a consistent value independent of the bandwidth. As the magnitude of the PSD does not change at different signal lengths, engineers can use PSDs with the same parameters to compare signals of different lengths.
Additionally, the PSD can be the product of an infinite number of waveforms, but the GRMS value will not change after the PSD is defined. This certainty allows engineers to match a PSD to a specification and determine if the GRMS value meets requirements. They can also use the GRMS to compare two PSD plots with the same parameters and verify that the energy measurements are the same.
FFT vs PSD: What’s the Difference?
The PSD and FFT are tools for measuring and analyzing a signal’s frequency content. The FFT transfers time data to the frequency domain, which allows engineers to view changes in frequency values.
The PSD takes another step and calculates the power, or strength, of the frequency content. The magnitude of the PSD is then normalized to a single hertz bandwidth. This action provides the engineer with a consistent value independent of the bandwidth.
Random test methods are prevalent in vibration testing because they reflect real-world events. Products should be tested using realistic test profiles, which is why the PSD is a more common selection for analysis.