Vibration data in the form of time vs. amplitude offers one perspective. However, critical events such as resonances, peak transients, and harmonics are not often readily available in a time-domain graph. As such, engineers typically apply some form of analysis to transform time data.
Article Overview
- Purpose of spectrum analysis and how it differs from general vibration analysis
- Overview of spectrum analysis types:
- Fast Fourier Transform (FFT)
- Power Spectral Density (PSD)
- Octave Analysis
- Order Analysis
- Discussion of spectrum analyzers as integrated systems
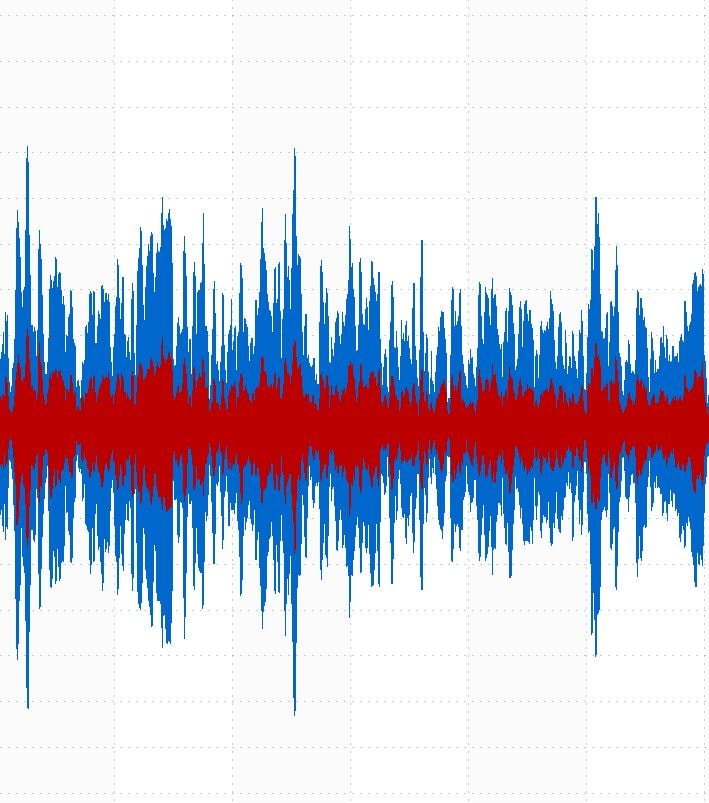
A section of time domain vibration data.
Spectral analysis transforms time data into a spectrum, such as the frequency spectrum. A time graph displays one signal representing its variations over time, regardless of how many components influenced the signal. In comparison, a spectrum is a graph of spectral lines that represent the magnitude and distribution of the signal’s different frequency components.
The primary purpose of vibration spectrum analysis is to identify vibration that is causing noise, fatigue, or failure.
See also: Why Vibration Testing?
Spectral Analysis vs. Vibration Analysis: What is the Difference?
Defining spectrum analysis separately from vibration analysis can be a bit confusing. Spectrum analysis is a type of vibration analysis, as it analyzes (takes apart) time-domain vibration data to transform it into a spectral domain. Vibration analysis includes spectral analysis but encompasses many other forms as well.
How Does Spectrum Analysis Work?
Spectrum analysis works on the principle that a signal can be separated into a series of sine and cosine waves, each with different frequencies, amplitudes, and phases. An algorithm can analyze (or separate) time data into components by projecting it onto these sine and cosine waveforms. The set of these components for the given signal is a spectrum.
Types of Spectrum Analyses
Fast Fourier Transform (FFT)
The FFT transforms time-domain data into the frequency domain by deconstructing the signal into sine and cosine waves. It is a computational algorithm that efficiently implements a mathematical operation called the discrete-time Fourier transform.
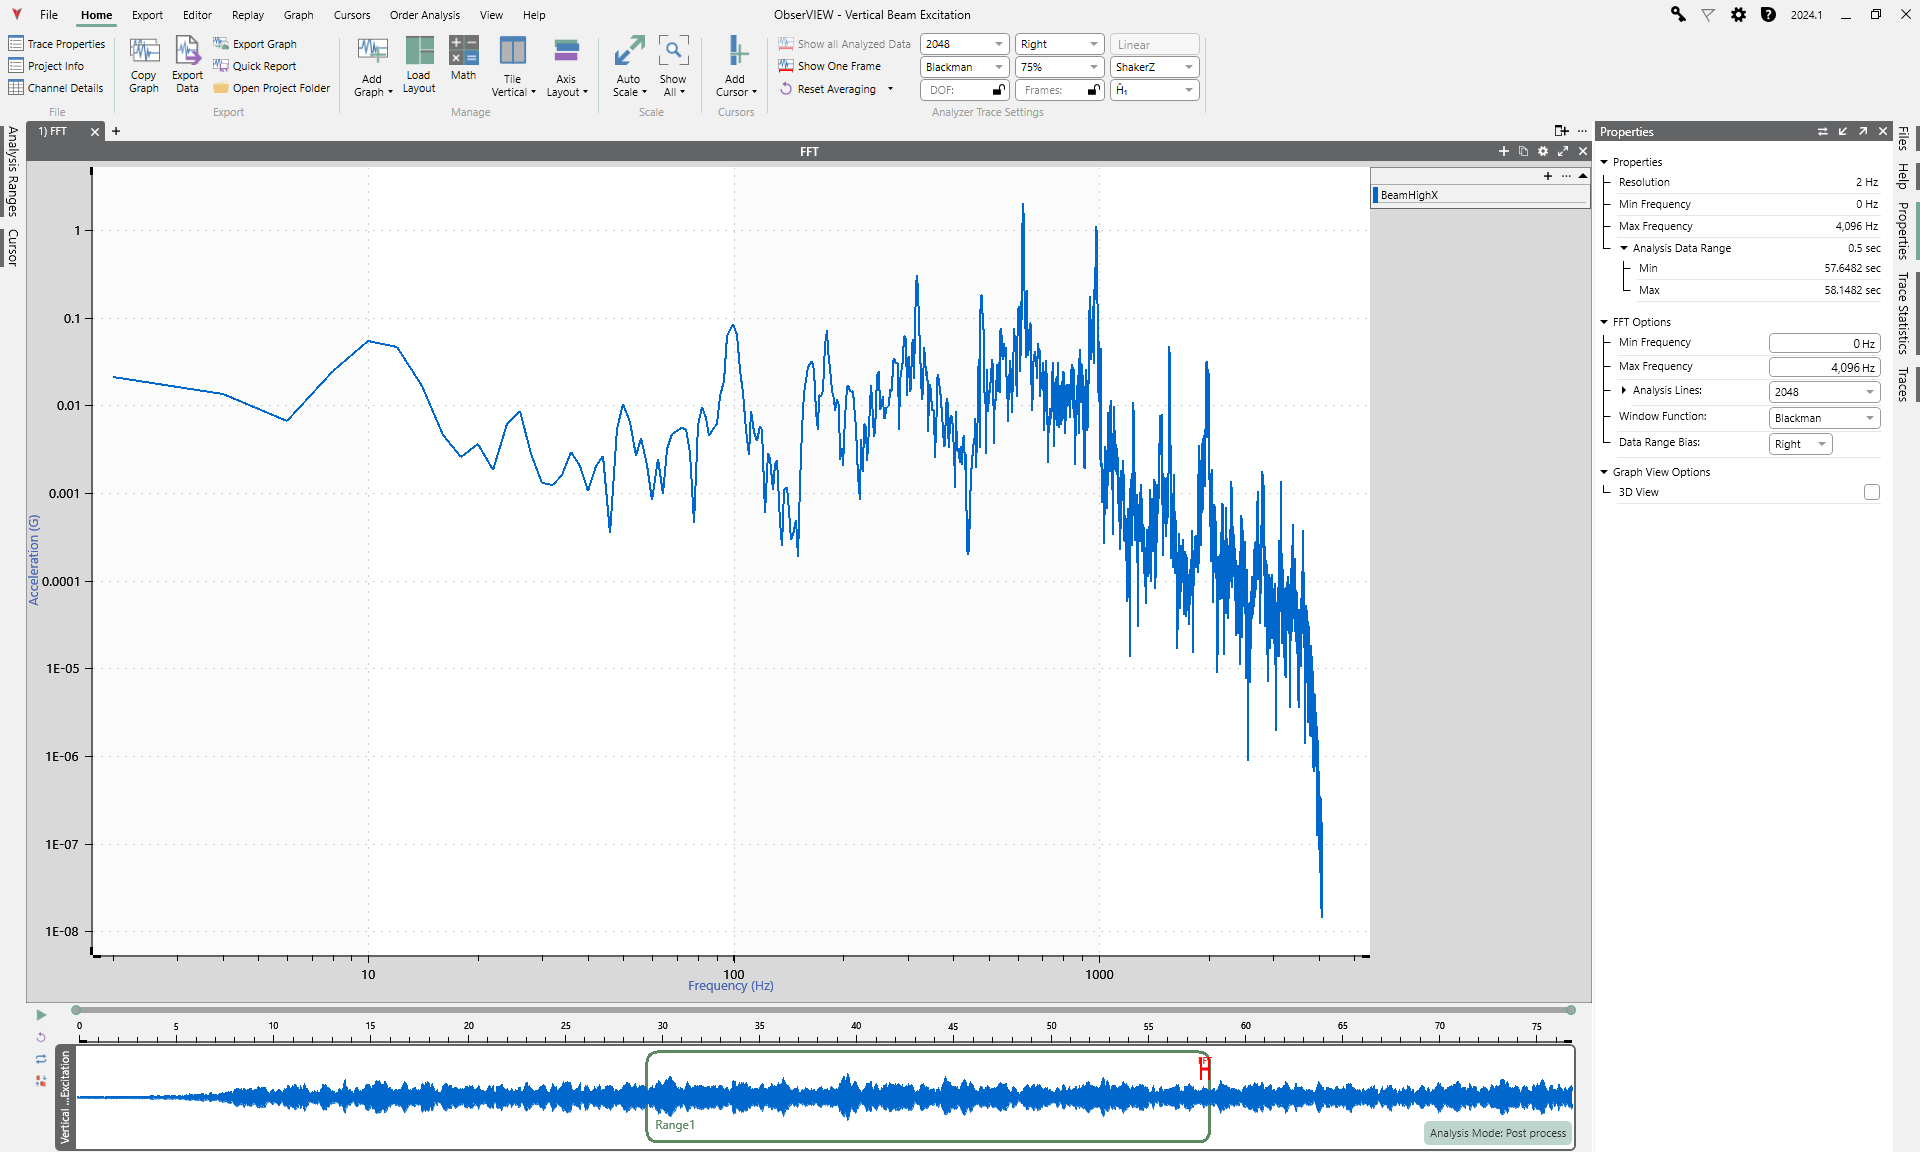
An FFT trace in the ObserVIEW software.
The FFT helps engineers determine the excited frequencies of a complex signal and the amplitude at those frequencies. Additionally, it highlights the changes in frequency and amplitude and the harmonic excitation in a defined frequency range.
Power Spectral Density
The FFT allows engineers to view changes in frequency. The PSD takes another step and calculates the power, or strength, of the frequency content. It then normalizes the magnitude to a single hertz bandwidth, providing a consistent value independent of the bandwidth.
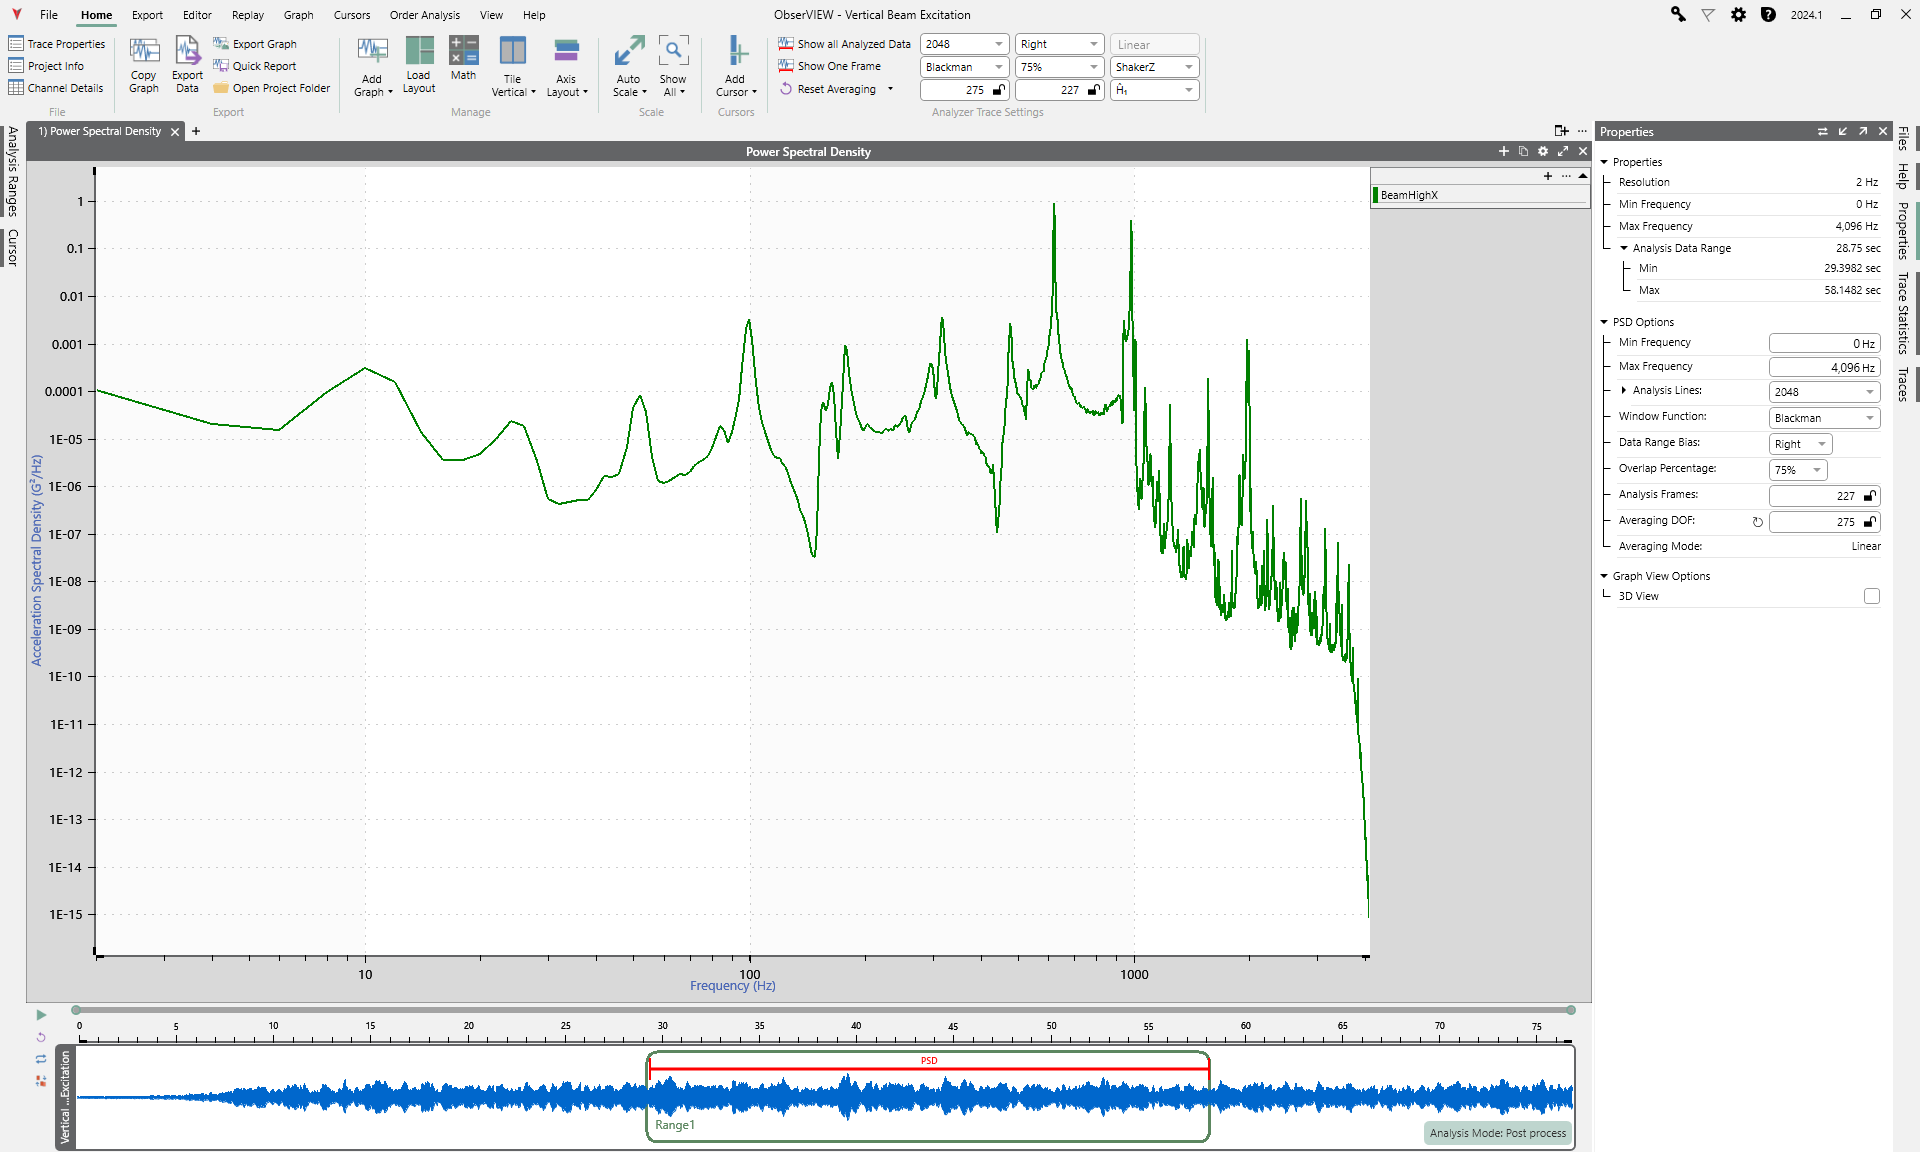
A PSD trace in the ObserVIEW software.
Engineers can use the PSD to compare signals of different lengths because the PSD magnitude does not change at different signal lengths. Make sure to use the same PSD parameters when making comparisons.
Additionally, the acceleration root-mean-square (GRMS) value does not change after the PSD is defined, allowing engineers to match a PSD to a specification and determine if the GRMS value meets requirements. They can also use the GRMS to compare two PSD plots and verify that the energy measurements match.
Octave Analysis
Acoustic measurement does not contain frequency information, making it unsuitable for comparing sound and vibration. An octave analysis allows for the objective evaluation of sound and vibration by grouping the frequencies of an acoustic signal into “bins,” often to reflect how humans perceive the frequency spectrum.
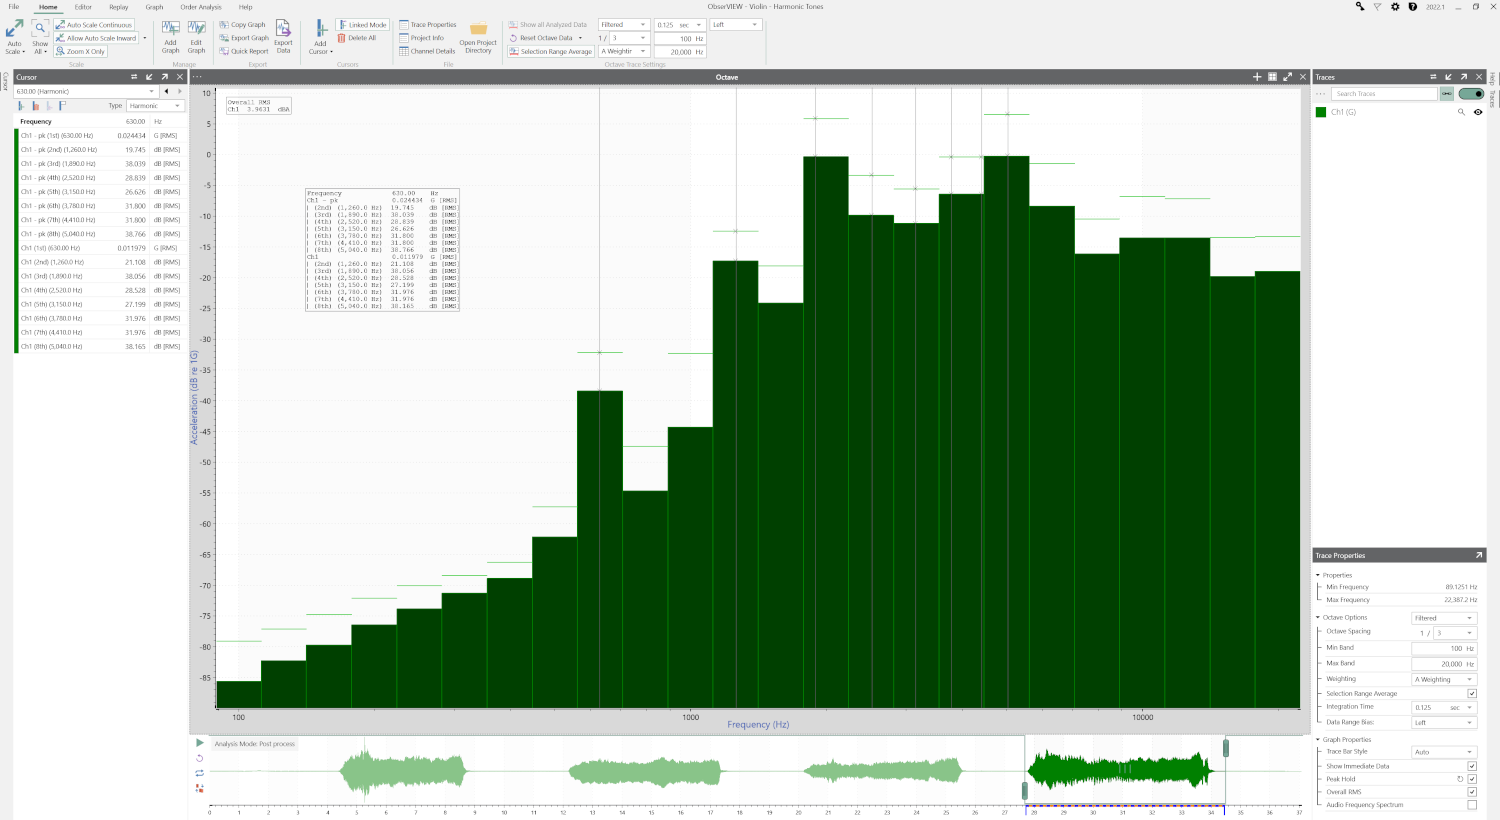
Octave analysis in the ObserVIEW software.
A software program filters the acoustic signal and measures the sound pressure levels at the output. The engineer can then apply averaging and weighting techniques in the frequency domain to correspond to their desired sound evaluation measurements.
Order Analysis
The angular domain highlights anticipated vibrational patterns, such as torsion in rotational machinery. Order analysis analyzes the noise and vibration of machines with rotational or reciprocating components, such as an engine or rotor blade.
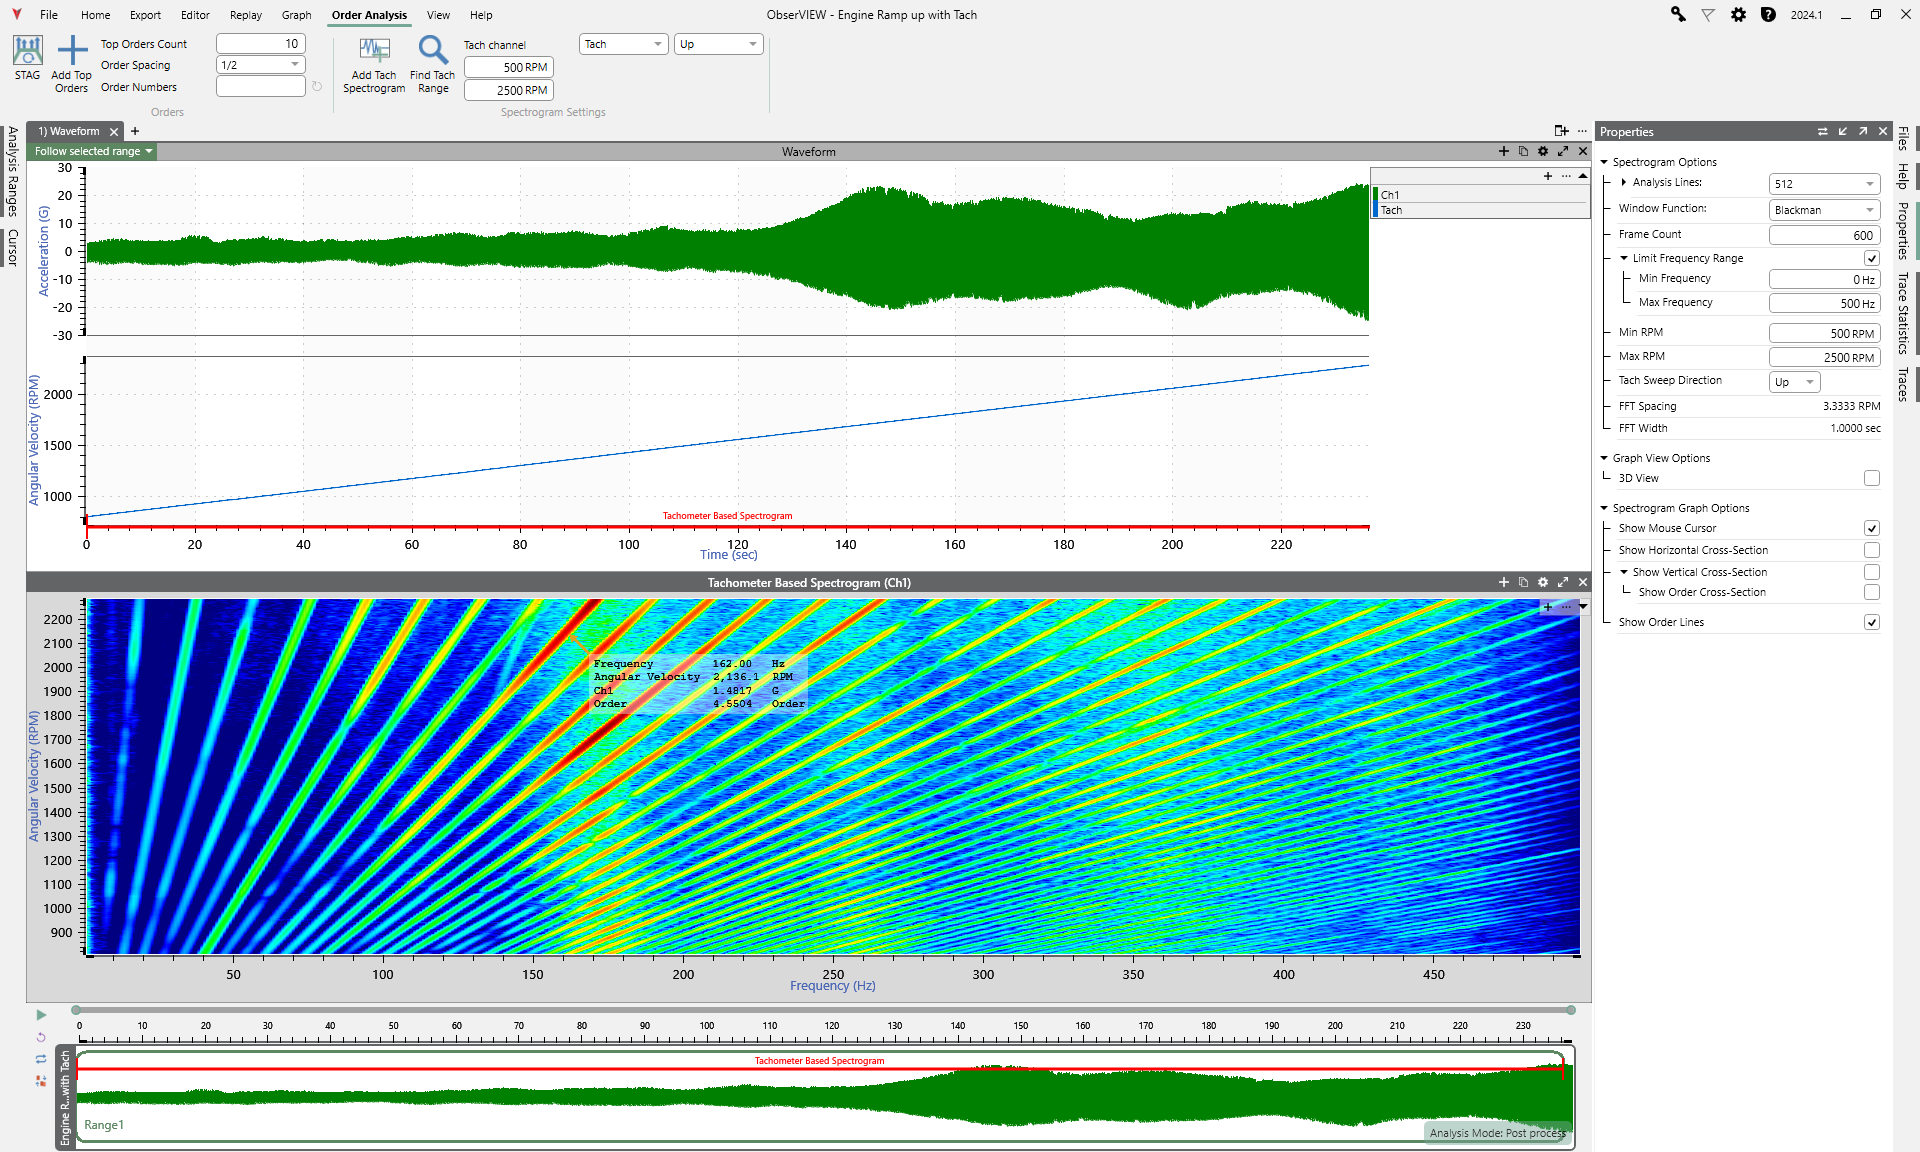
Order analysis in the ObserVIEW software.
Machinery has different parts, each with a distinct vibrational pattern. Order analysis helps differentiate the rotational source from the random vibration of the machine’s output.
Order analysis separates rotational or reciprocating vibration into orders. Orders measure frequency (Hz) and correspond to the reference RPM and its harmonics.
Spectrum Analyzers: Systems for Analysis
“Spectrum analyzers” refers to systems that record vibration signals and analyze the spectral content. These systems include one or multiple sensors, a data acquisition device for recording, and a software program for converting the time-domain data to a spectrum. Many analysis systems that function as spectrum analyzers can perform additional analyses.
For example, a system with the ObserVR1000 recording hardware and ObserVIEW software can perform vibration spectrum analysis. The software program includes FFT, PSD, order, and octave analysis functions. It also analyzes the time domain, calculates fatigue over time and frequency, and more. The system is not only a spectrum analyzer but a comprehensive analysis tool. A more accurate definition is a signal analysis system, although it functions as a spectrum analyzer.
Live Spectrum Analysis
The ObserVR1000/ObserVIEW system can also perform analysis in real-time. With the Live Analyzer feature enabled, the user can observe a live stream of data from the hardware and note potential events of interest as they occur. Live controls include FFT, PSD, transfer function, and more.
Spectrum Analysis
Vibration spectrum analysis allows engineers to convert time-domain signals into actionable, frequency-domain insights. By employing tools such as FFT, PSD, octave, and order analysis, engineers can isolate key vibration events and compare results against standards. Integrated systems, such as the ObserVR1000 with ObserVIEW, help improve workflows, offering real-time spectrum monitoring and a suite of analysis modes. Spectrum analysis supports efficient troubleshooting and validation of vibration in engineering applications.