Acceleration, velocity, and displacement (AVD) are standard measurements of the change in waveform movement. Each provides information about the location of a device under test (DUT) as a function of time. These measurements are directly related, so engineers can collect one and convert it to another.
Vibration engineers do not often measure AVD simultaneously because they require different measurement tools that can be complex and expensive. In comparison, sensors that measure acceleration (accelerometers) are affordable and conventional. Therefore, AVD conversion is a convenient option for those that have accelerometers but require velocity or displacement data.
Definitions of AVD
Acceleration, velocity, and displacement are all functions of frequency over time.
- Displacement: the distance an object has moved expressed as units of length such as meters (m) or inches (in).
- Velocity: measurement of displacement with consideration to duration. Velocity is the rate of change of direction and differs from speed. Velocity is expressed in units of length divided by units of time such as meters per second (m/s) or inches per second (in/s).
- Acceleration: the rate of change in velocity per unit of time. Acceleration is expressed as units of velocity divided by units of time such as meters per second per second (m/s2).
Engineering Uses for AVD
Whether an engineer analyzes acceleration, velocity, or displacement largely depends on the data set’s frequency components. Acceleration puts more weight on high-frequency components, while displacement displays lower frequencies.
Analyzing vibration in the different function types can help paint an overall picture of a complex environment. It provides a new way to look at the data and serves as a helpful diagnostic tool.
Selection for Analysis
If the engineer is concerned with transient events or a frequency range with high levels, then the acceleration unit will be most suitable. As machinery usually displays high-frequency characteristics, and resonances are often at a high frequency, the acceleration curve is standard for vibration analysis.
Velocity assigns equal importance to high and low components. It is directly related to product fatigue and is a good indicator of vibration severity. Therefore, engineers often select velocity when performing shock or fatigue testing.
Displacement is beneficial for testing environments with low-frequency components, particularly in seismology and earthquake engineering. An engineer may select the displacement unit when they suspect a failure mode is a result of displacement, such as in the case of unbalance in rotating machinery.
Displacement removes the high-frequency noise to display the macro movement of the DUT. Most of the vibrations a consumer can see/feel is in the low-frequency range, and the displacement function can offer insight into the customer experience.
Example
 A car strut is a component of the vehicle’s suspension designed to hold its weight and absorb impact while driving. As a suspension component, the strut has a range of motion. If there is forced movement outside this range, the suspension will not ideally soften it or, in extreme cases, it will damage the vehicle.
To prevent these circumstances, the engineer may wish to test the range of motion a strut will exercise during a typical drive and view the minimum and maximum displacements the strut will experience compared to the car at rest.
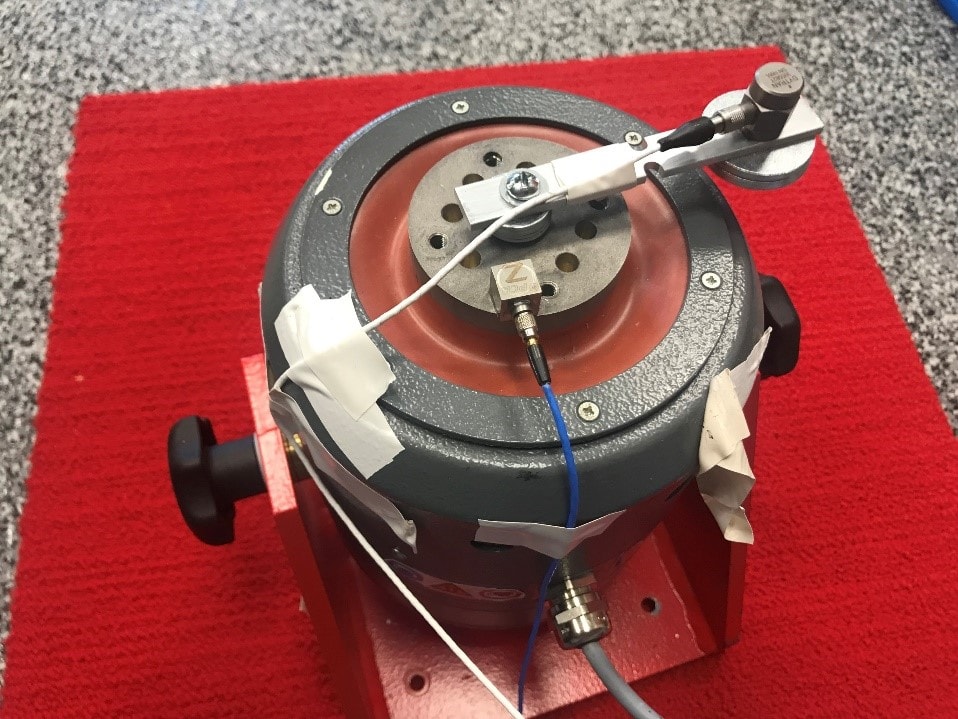
Notched aluminum beam mounted to a shaker.
Vibration Sensors
Most vibration controllers can process AVD signals; however, signals are often collected in acceleration over time. Accelerometers are vibration sensors that measure and output acceleration. They are more accessible than velocity or displacement sensors and are often more versatile.
Many engineering applications use displacement measurements, but methods are expensive and extensive. Displacement sensors require fixed reference points; accelerometers do not. Converting from acceleration to displacement is a more efficient option.
Process of Integration
The curve of a plot can be described as a function that represents a signal. Engineers apply the calculus processes of integration or differentiation to an acceleration, velocity, or displacement curve to convert the units.
An integration filter converts acceleration to velocity or velocity to displacement. The integral of a function is the area between the function and the x-axis (also known as the area “under the curve”).
Conversely, a differentiation filter converts displacement to velocity or velocity to acceleration. The derivative of a function measures the instantaneous rate of change from output to input. It is equivalent to finding the slope of the tangent line at a specified point on the curve.
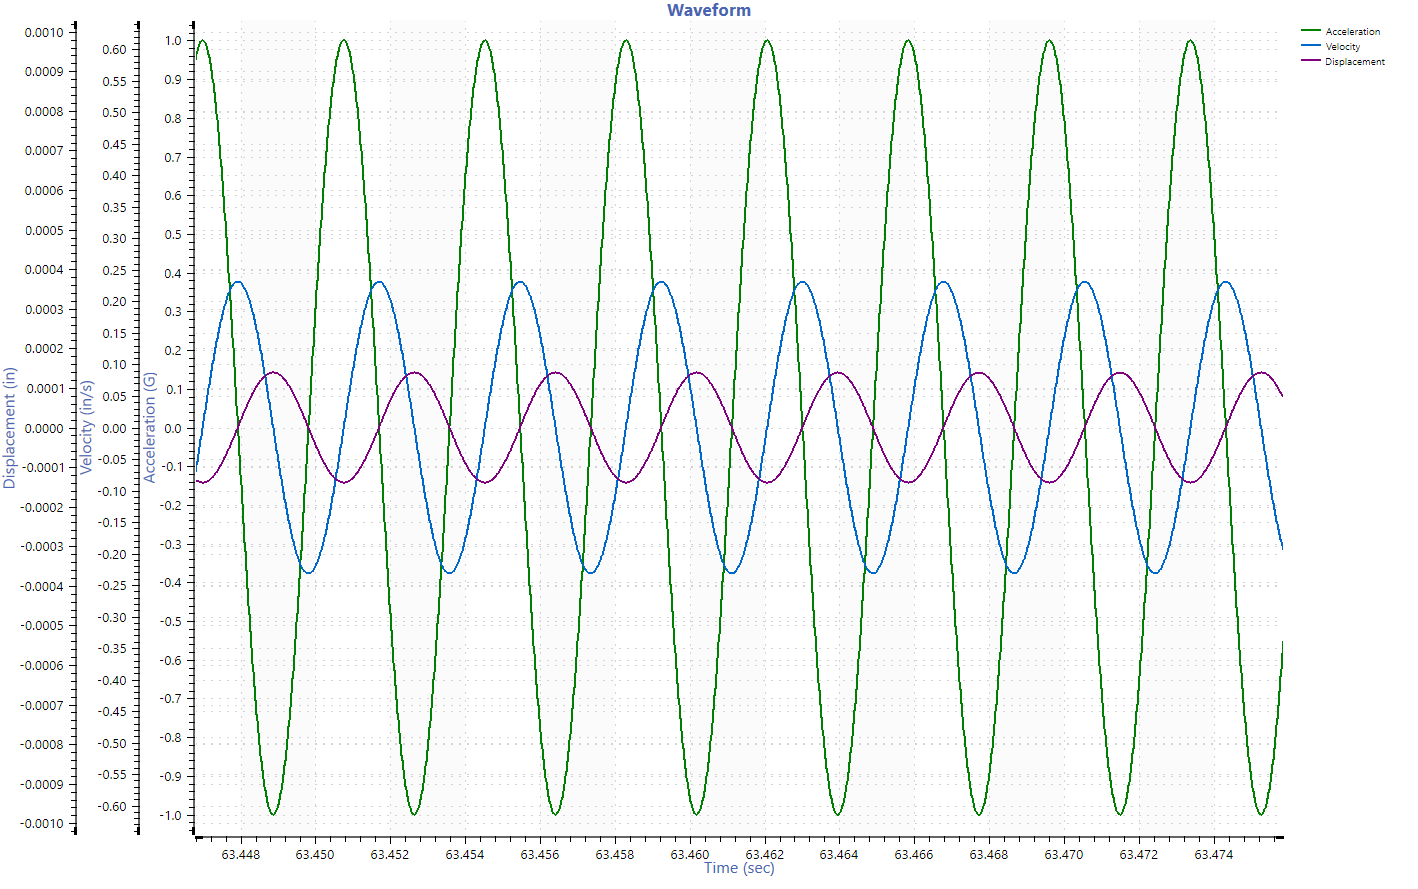
For example, if we plot a velocity curve versus time, we can calculate the acceleration and displacement for the data set. Displacement is the integral of velocity or the area under its curve. Acceleration is the differential: the slope of the velocity curve at a defined time is the acceleration at that time.
Issues with Integration
Integration/differentiation is the standard method of AVD conversion. However, the calculation alone results in deviation or distortion due to DC offset from transducers, linear drift, or low-frequency noise. The software must filter or process the original signal to remove the potential for error. There are several methods of pre-processing data, such as zero-mean processing, least-squares fitting, high-pass filtering, baseline correction, etc.
Selecting a Cutoff Frequency
The cutoff frequency, or corner frequency, is the minimum value the unit conversion allows through the integration low-pass filter. The cutoff frequency value should be the lowest valid signal frequency for the sensor and device under test. A value lower than the measurement’s frequency range will produce an output that does not start or end near zero. A cutoff frequency that is too high will limit the low-frequency data, resulting in incorrect data.
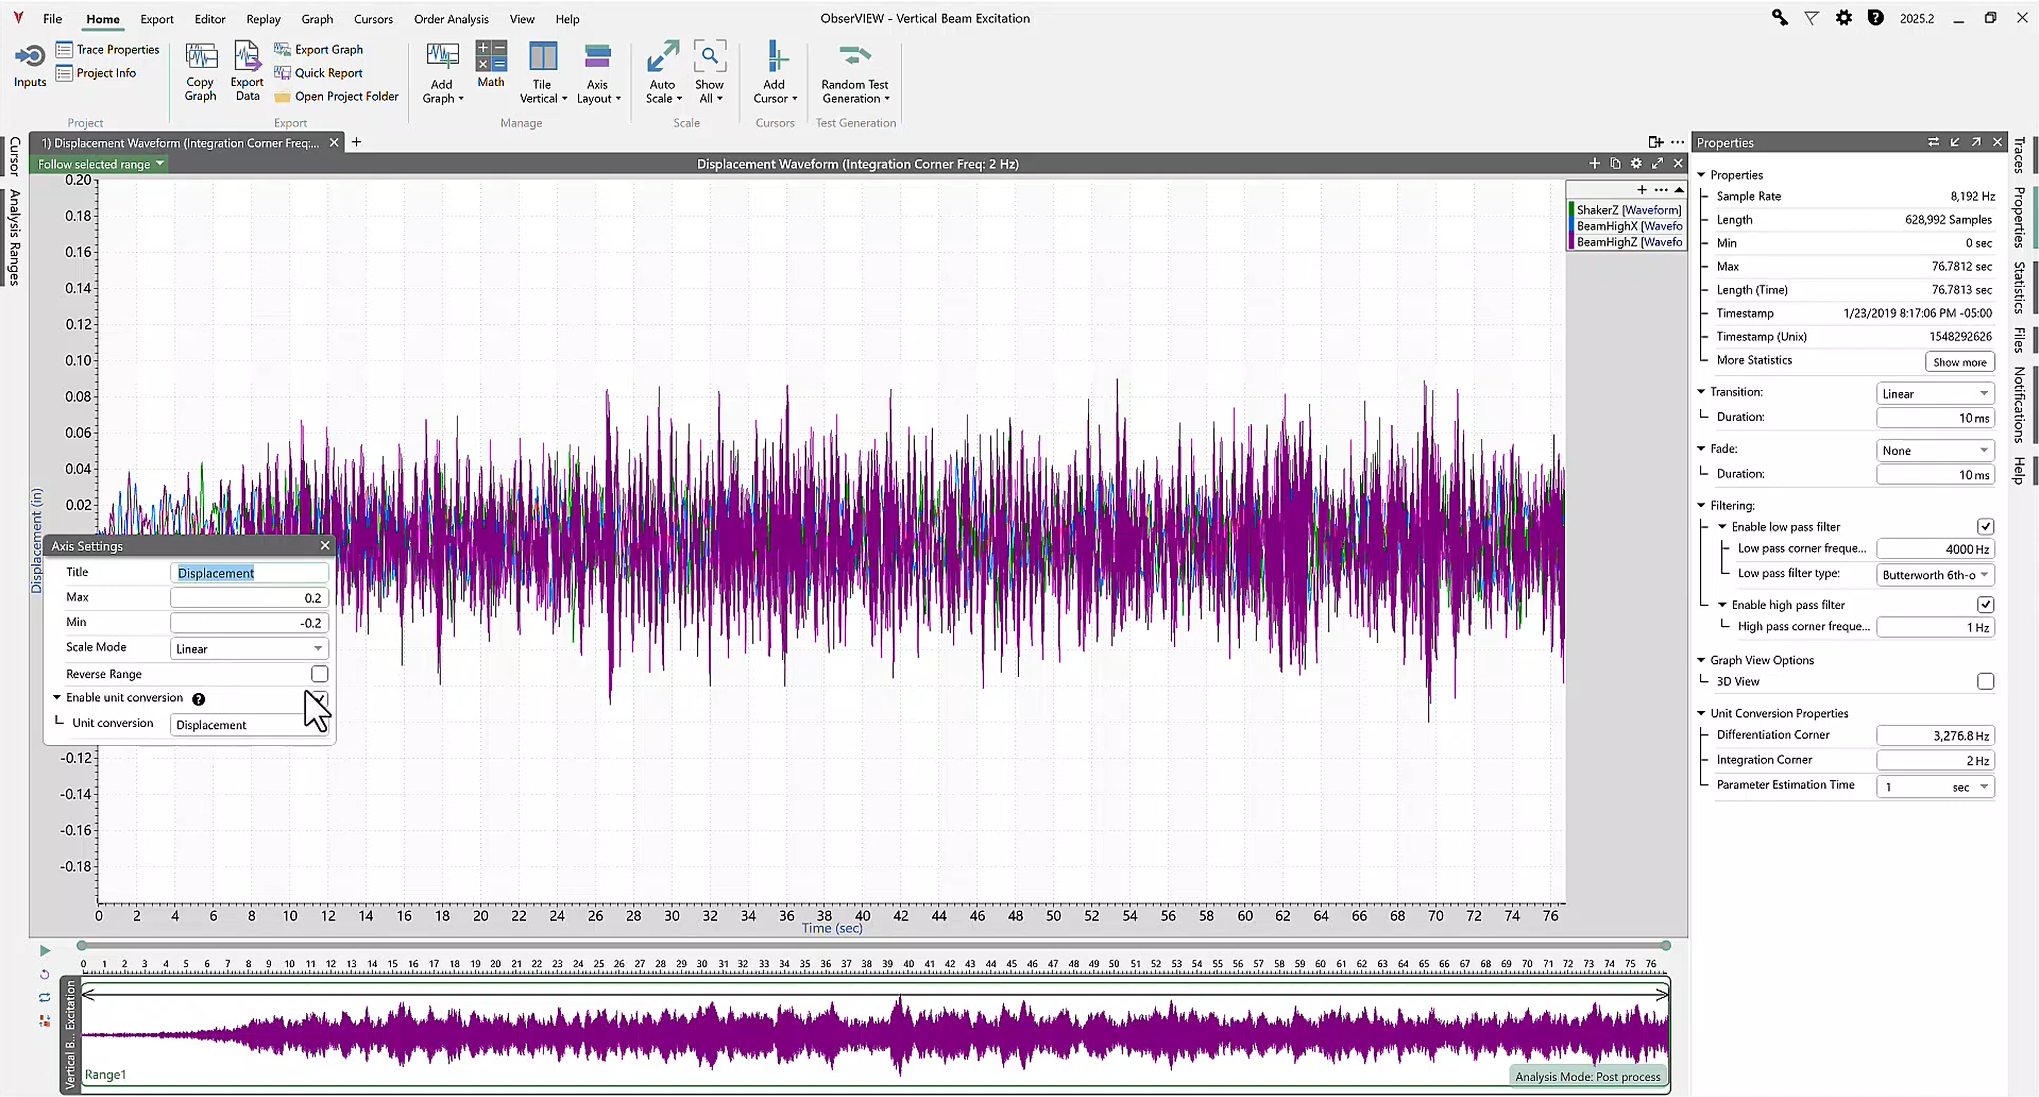
Convert Time Data to Velocity and Displacement in ObserVIEW
In ObserVIEW, users can enable a unit conversion from acceleration to velocity or displacement, and the software automatically performs integration or differentiation.
This feature applies to time, FFT, PSD, and STAG graphs. Users can also specify the integration corner frequency or apply an additional low pass or high pass filter to the converted waveform.