Often, test engineers want to know how a product will function after years of damage accumulation. However, monitoring the lifespan of a product is not an efficient use of time, especially for products that are meant to last for decades. Instead, engineers use an accelerated test profile to simulate a lifetime of damage in a fraction of the time.
Accelerated vibration tests are useful for predicting a product’s life expectancy and anticipating potential failures with standard use. There are several methods of accelerating a test profile using recorded data. One of the most well-known in the industry is the fatigue damage spectrum (FDS).
What is the Fatigue Damage Spectrum?
The fatigue damage spectrum (FDS) software option in ObserVIEW generates an accelerated random test profile using time-history files. The resulting test is the damage equivalent to the product’s lifespan.
Engineers can convert the FDS into a single power spectral density (PSD). The result is one PSD profile for multiple time-history files. The FDS-correlated PSD is a cumulative spectrum that represents the relative damage experienced by the product for all the combined and weighted environments. Engineers can use the profile for comparison or export it for vibration testing on a shaker in the lab.
The FDS is a suitable option when an engineer wants to accelerate a random test and has recorded waveforms from the field environment. However, what happens when the recordings are not purely random?
Rotational Components
In some operational environments, sinusoidal vibration exceeds the acceleration of the random background vibration. For instance, all aircraft have base random energy as well as a sinusoidal vibration that typically derives from the turbine engine or rotor blade. When sine vibration affects the underlying background random, engineers must include it in the test profile.
The Sine Tracking, Analysis and Generation (STAG) software generates an accelerated sine-on-random test profile using a time waveform. It accelerates the sine and random profiles separately to do so. The software extracts the orders from a waveform and generates an accelerated sine tone profile. The remaining random content is accelerated in ObserVIEW with the FDS and then combined with the sine profile.
STAG allows for the analysis, acceleration, and generation of a test for a device under test (DUT) with a rotational component.
Should I Use FDS or STAG?
If you want to accelerate a random test, you might consider both FDS and STAG as methods of test profile acceleration. Which is the best test to simulate the operational environment? The selection comes down to sinusoidal vibration. Is there rotational content that translates as sine tones on the shaker table? Do the sine tones exceed the acceleration of the random background? If so, STAG is the better option. STAG is not necessary if there are no instances of sine or if the effect of the sine vibration is negligible.
Comparison
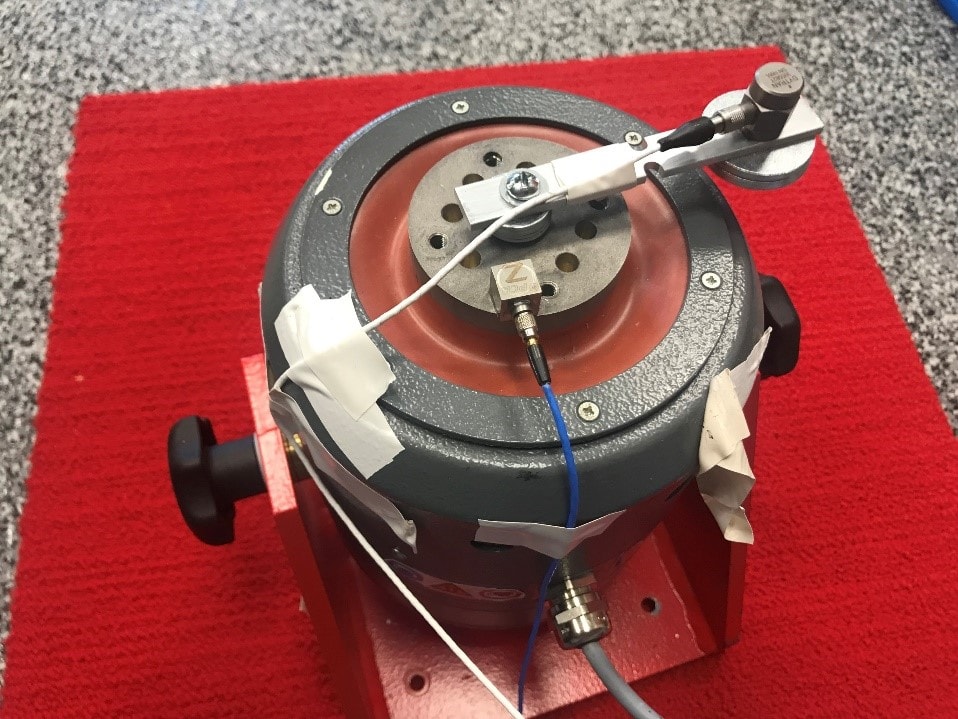
Notched aluminum beam mounted to a shaker.
A Vibration Research engineer wanted to compare the efficiency of FDS and STAG for time waveform recordings that contained both sine and random vibration. The goal was to create a test profile from the same recordings using FDS and STAG. Then, they would run both tests on a notched aluminum beam (a standard DUT) and record the time to failure.
Selecting the Recordings
The STAG software requires a ramp-up or ramp-down of rotational data, which can be recorded with a tachometer or proximity sensor. The engineer also aimed for reasonable vibration levels and a resonance corresponding with the standard DUT (around 70 to 80 Hz).
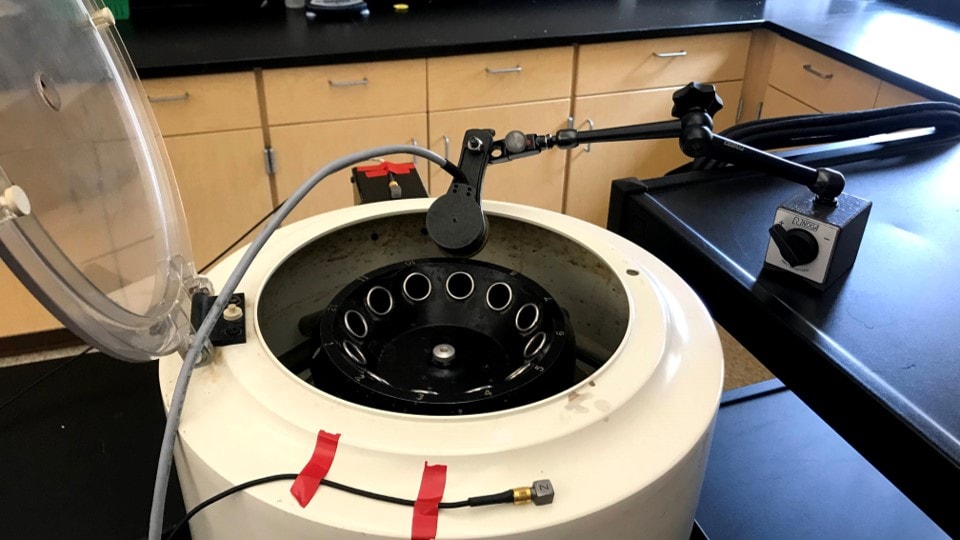
Laboratory centrifuge.
The engineer collected data from many sources but derived the best recordings from a laboratory centrifuge. The data had a steady ramp down, high accelerations, and several orders identified using the ObserVIEW Order Tracking feature. The second order was at 72 Hz, which was close to the average resonance of the notched aluminum beam.
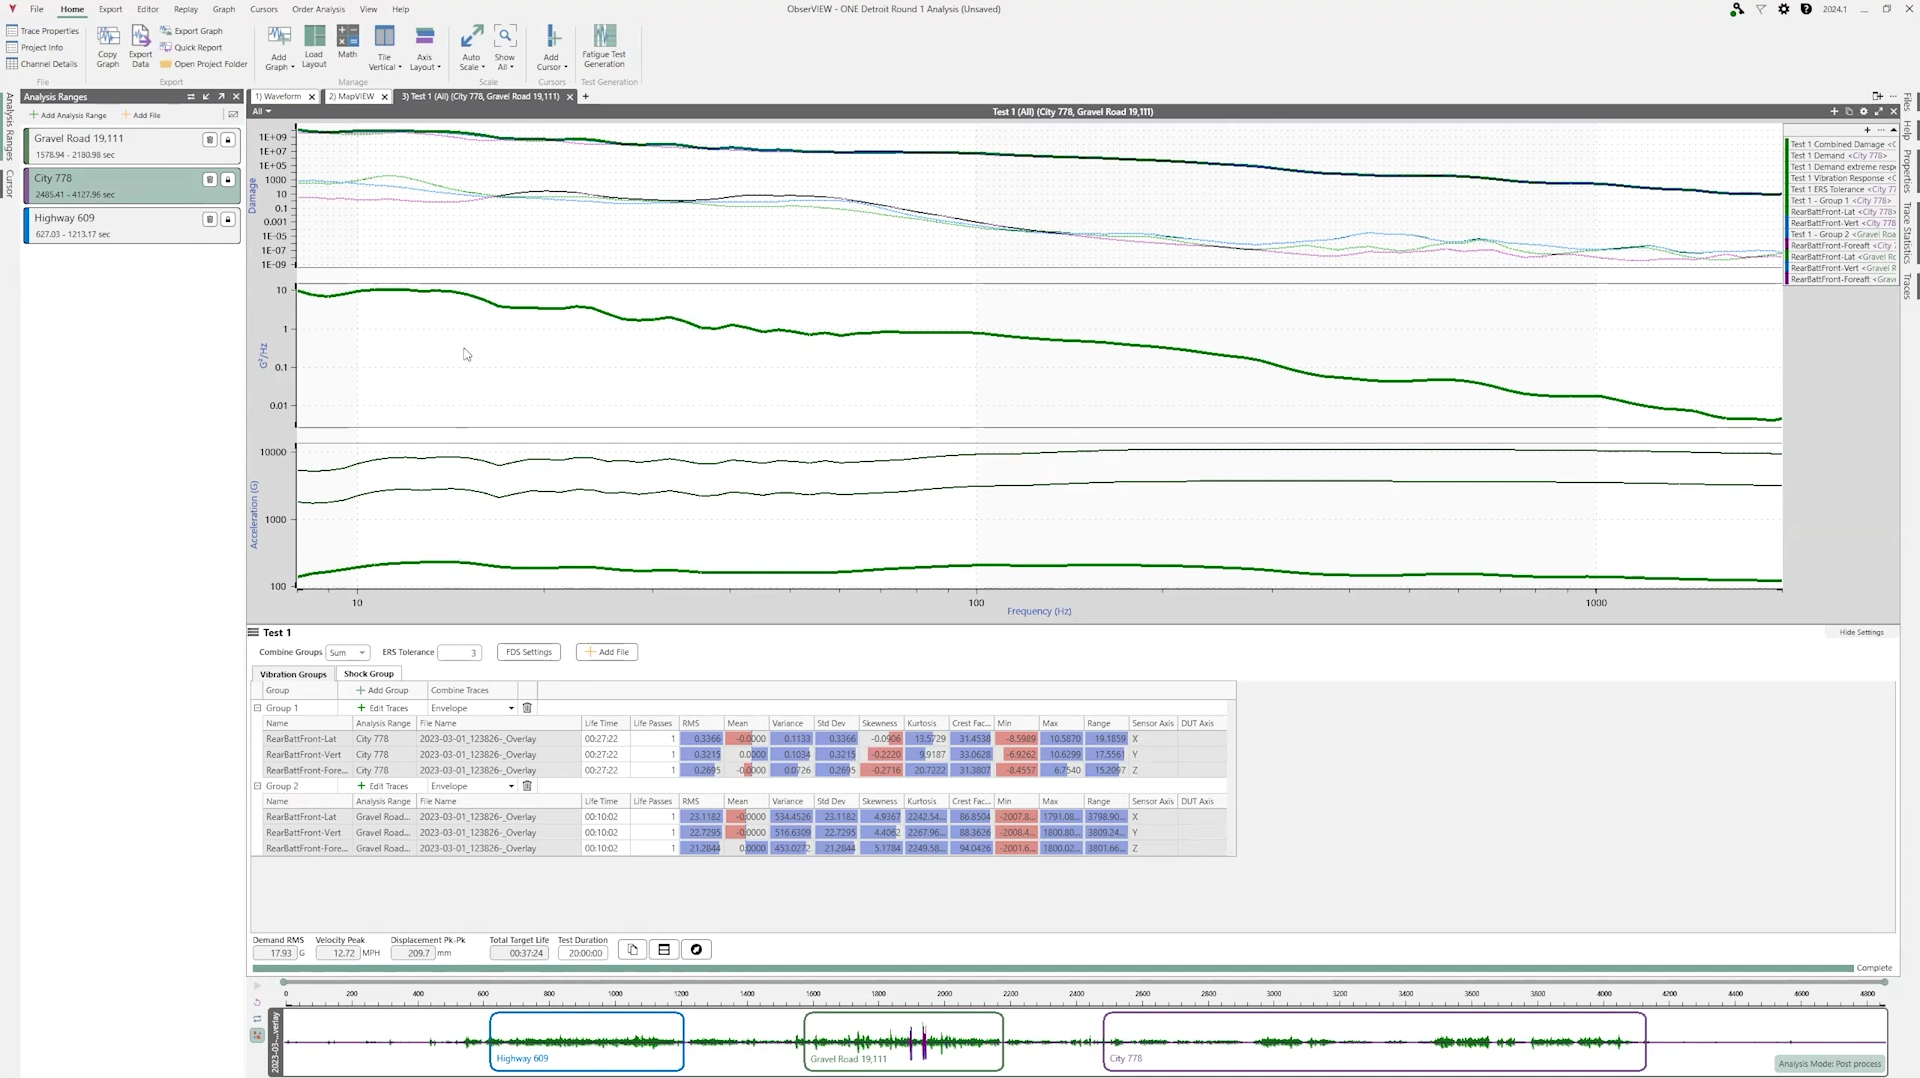
Figure 1 displays the time waveform (above) and the order analysis (below) of the recording. The steady orange trace on the time waveform indicates the tachometer speed.
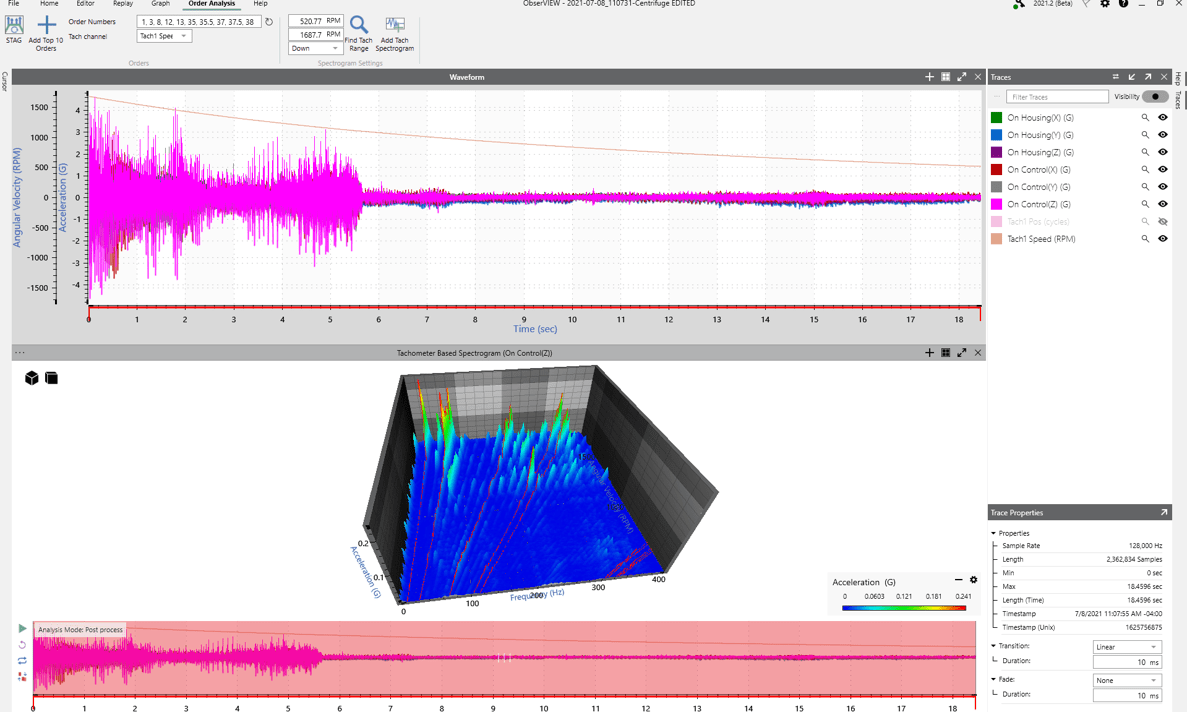
Figure 1. Recording from a laboratory centrifuge.
The engineer generated a test profile from the recordings using STAG and a second using the VibrationVIEW FDS software. Then, they ran the tests and documented the time to failure. A break or a significant crack constituted a failure. When the beam weakens, the acceleration on the end of the beam cannot remain at high levels. The engineer monitored the values and recorded the lower acceleration levels at the end of the beam as a break.
A sine sweep was also performed prior to each test to confirm the beam’s resonance as each piece varied slightly. The beams’ resonances were used in the STAG procedure to adjust the width of the first SoR resonance.
Conclusion
Twenty trials of each test profile were run. The tests run with the STAG profile failed faster than those with FDS. The average time to failure was 51.731 min for STAG and 125.684 min for FDS.
If a service environment contains sinusoidal vibration from rotational components, the STAG tool will bring the DUT to failure more efficiently than FDS alone. STAG replicates the fatigue from high acceleration sine vibration and the interaction between random and sine. FDS lacks those components and therefore takes longer to bring the DUT to failure.
If your product’s operational environment contains rotational data, it will read as sine vibration on the shaker table. For an accelerated test, STAG will create a profile closer to the operational environment than FDS. For random test profiles, FDS remains satisfactory.