The quality (Q) factor of a resonance describes the damping of its oscillation. It is defined as the ratio of the resonance’s center frequency to its half-power bandwidth. A high Q value indicates low damping and energy loss at a lower rate. In such instances, the resonance may be referred to as underdamped.
There are several characteristics of underdamped resonances that can be identified on a graph. Understanding these characteristics is beneficial when setting up or troubleshooting a sine test with potential high-Q resonance(s). They are true of all resonances but are more pronounced when the Q-factor is high.
Four Characteristics of High-Q Resonances
Large change in amplitude corresponding to frequency
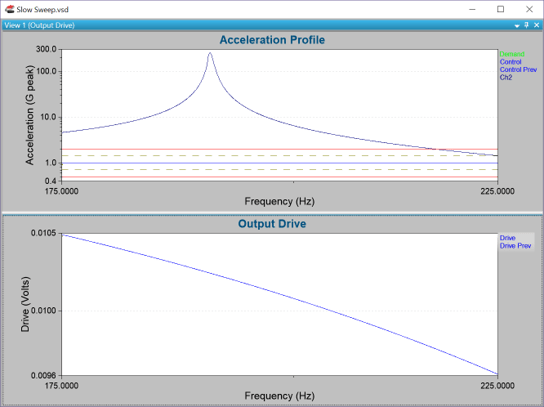
This characteristic is perhaps the most obvious of the four. Small changes in frequency result in large changes in amplitude.
When you control a channel with a large resonance, the output’s response must keep up with the change. The control algorithm should move fast enough to keep on the demand. If it does not, you can check VibrationVIEW to determine if a setting is limiting the control. We recommend checking the two following parameters:
- Slew rate
The slew rate (increasing/decreasing rate) controls how fast the drive output changes in response to a change in the input. Units are dB/sec in the parameters but dB/min on the graph.
- Sweep rate
By slowing down the sweep rate, the frequency (and therefore amplitude) does not change as fast; thus, the drive does not need to change as fast. The slower the sine sweep, the more opportunity for control. However, this results in a more severe test because the test spends more time at resonance and runs for longer.
Slow response time
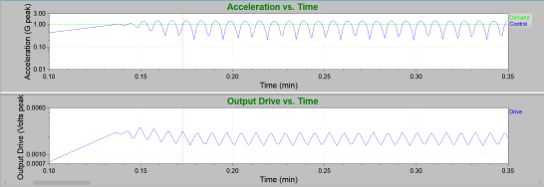
A resonance can take time to respond to a stimulus. Its response is inversely proportional to the bandwidth of the resonance.
The system’s response time should be less than the resonance’s response time. If the control is faster than the resonance can change, oscillations can occur. Here’s why:
If the control is above demand, the VibrationVIEW software will attempt to drop the drive so the control will meet the demand. However, the control is still rising as the drive drops because it is responding to the previous output. By then, the control is below the demand, so the VibrationVIEW software begins to pull the drive back up. This flow creates an oscillation.
The response time should be slower than the resonance. If it is not, we recommend checking two parameters: the response time and tracking/input filter. The response of the filter is inversely proportional to its width. The system’s response time is either the response time or the bandwidth of the tracking filter, whichever is smaller.
Long ring-down time
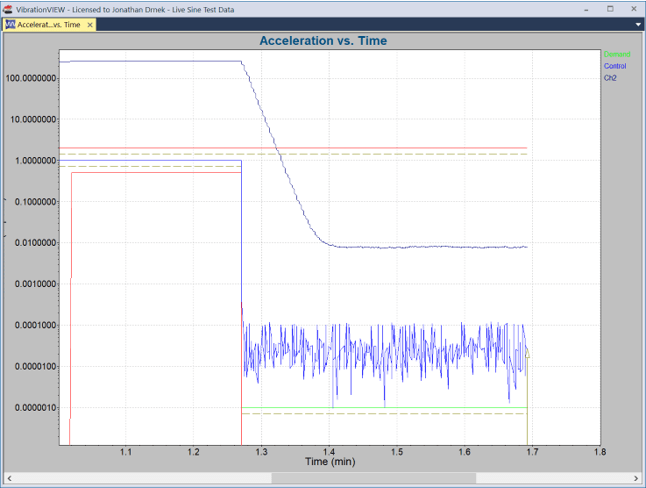
A resonance’s ring-down time is inversely proportional to its bandwidth. A narrower (higher Q) resonance will have a longer ring-down time. From a control standpoint, this can cause a problem because it can result in beat frequencies.
However, the engineer should not try to control this characteristic as it is dictated by physics and will lead to poor control. Instead, we recommend adjusting the response time parameters so that there is no attempt at control.
Location changes with frequency
A resonance can shift location with the amplitude of the response channel. This characteristic has implications when sweeping at a low level and dwelling at a high level. Many choose to perform a low-level sweep to find resonances before a higher-level dwell, but they should be aware of this behavior.
To account for resonant shifts, you can consider the following:
- Hold the amplitude of the accelerometer on the resonance constant.
- Notch the response channel to set a fixed amplitude. The SRTD control would be easier; however, notching too close to the peak can result in oscillations.
- Start the SRTD test at a higher frequency and sweep down to the resonance.
- Use the Peak Tracking feature in VibrationVIEW.
Tech Talk Video
High Q Sine Resonance Track & Dwell
SRTD Testing
In VibrationVIEW, track high Q or sharp resonances with advanced phase tracking controls that allow you to dial in on resonances and maintain peak amplitude by way of phase versus transmissibility. When running an SRTD with high-Q resonances, we recommend the following:
- Make sure the resonance settings are not too fast.
- Use the SRTD control buttons to find the phase with peak transmissibility.
- Look for a peak in the transmissibility versus phase graph.
To learn more about the VibrationVIEW SRTD software, please visit the software page or download a free demo of the software.