At the start of 2022, the Vibration Research team set off in nine small groups to test the ObserVR1000 dynamic signal analyzer in real-world applications. The goal was to understand our product better in an operational setting and note any potential improvements. The groups presented their findings to the rest of the VR team. This series relays pertinent (or simply fun) information we found.
Meeting the Data Where It Is At
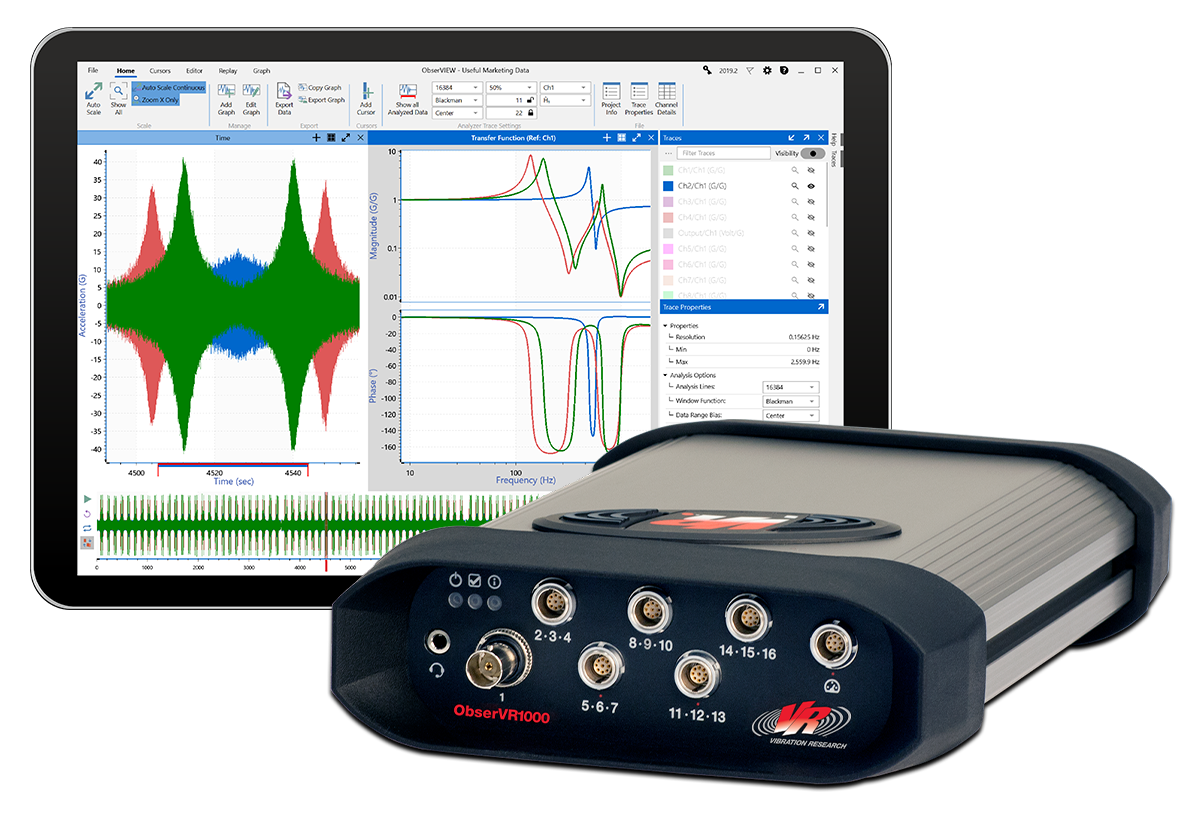
ObserVIEW Software: FDS
Group 8 rented a Tesla Model X for their excursion, which turned out to be farther than they anticipated. The rented vehicle was a 2016 model, and the range of 240 miles had been reduced to about 100. Additionally, a complete charge took about one hour. Therefore, the team could not reach their destination as planned; there were not enough charging stations on the way.
While waiting for a battery charge at the local Wawa station, one team member watched The Grand Tour on Amazon Prime, which sparked an idea for a project.
Clarkson Drops a Citroën 2CV from 500ft! #Shorts
While they couldn’t drop the rented vehicle from 500ft (it would be a breach of the contract), they could use the tools they had at their disposal to complete the project. Namely, they could use the Tesla they’d rented for the trip.
Recording Setup
First, the group wondered: what would be the best way to judge the quality of a ride? Was there something they could do with the vehicle that was 1.) easy to implement and 2.) would give an idea of its ride quality?
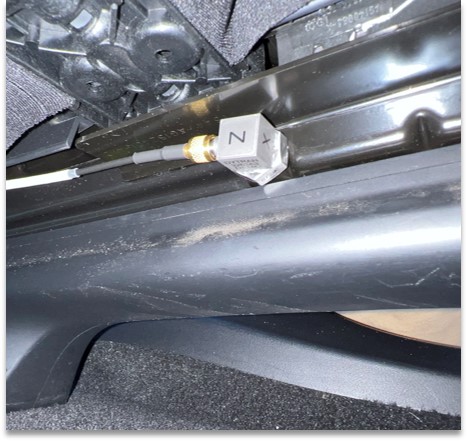
Triaxial accelerometer attached the seat rail.
The group decided to implement a recording setup similar to ones they’d done in the past. They attached a triaxial accelerometer to the metal seat rail and acquired data while driving on the freeway.
This setup was quick and easy, and they could control the recording with the VR mobile application. After, they could add the data to an archive of other automotive field recordings for future use.
Data Analysis
After recording, Group 8 imported the data into the ObserVIEW software for analysis. An FDS plot displayed the potential fatigue damage at each axis.
They selected a lower frequency range (2 to 150Hz) because most of what the passenger would feel is in this range. They also chose a default value of 8 for the m value (material property value).
To sync the recording to the GPS location, they located the freeway recording on the map and had the software re-process the FDS plot for that data section.
Data Comparison
Group 8 had access to a Tesla Model 3 back in Michigan, so they performed the same data acquisition on that model for comparison. Below is the power spectral density (PSD) of the two models.
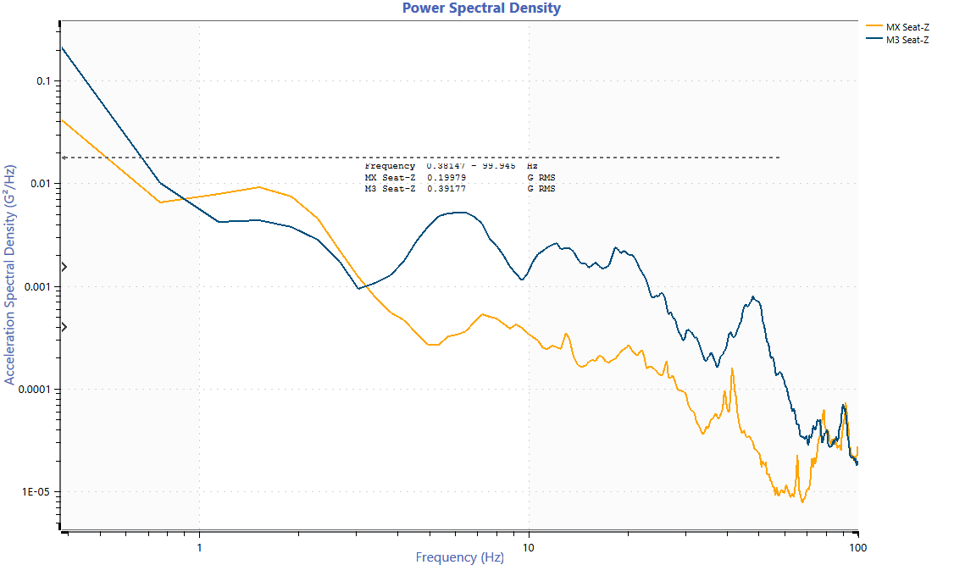
PSD comparison of the MX and M3.
The orange trace is the Model X, and the blue is the Model 3. The data for both were harmonically spaced. The MX had less energy across the defined frequency range, which would lead to less damage. Additionally, the RMS value of the M3 was about 1.5x higher than the MX.
They also converted the time data to displacement. The maximax cursor showed that the peak displacement of the MX was about 6.2cm, and the value for the M3 was 7.8cm. The displacement was not caused by the very low-frequency data like potholes but by the vibrations from the ride.
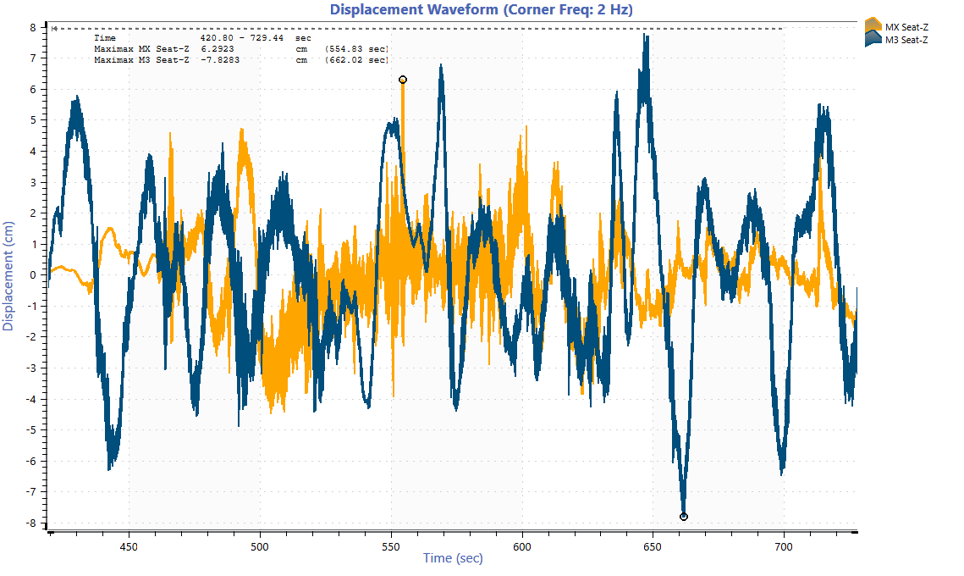
Displacement comparison of the MX and M3.
The FDS shows that the M3 experienced more damage than the MX except at very low hertz, which are the frequencies humans are more likely to feel. Group 8 could reasonably conclude that the M3 was a bumpier ride than the MX.
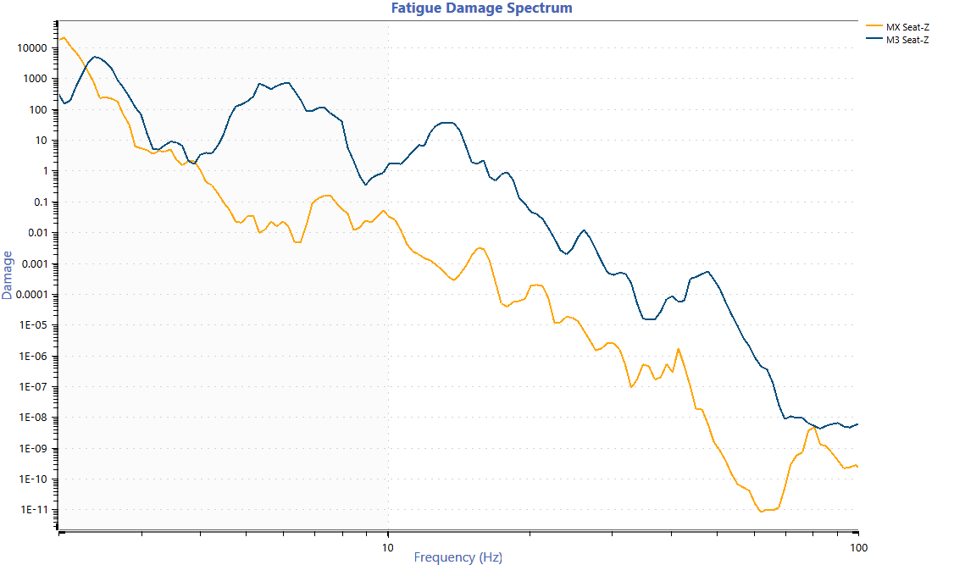
FDS comparison of the MX and M3.
Project Review
The team hopes to keep collecting seat data as they travel to build a database of different rides in various locations. The more data collected, the closer they can get to a generalized conclusion. As-is, the data are specific to the model type, the condition of the car, and the road conditions.
Featured Software

Fatigue Damage Spectrum (FDS)
ObserVR1000 Recording Checklist
There are a few items to keep in mind when setting up the ObserVR1000 for recording. To make it easy, we’ve compiled a checklist to review before you begin.