Even when familiar with a software program, we may not know all the functions that can save us time. Vibration control and signal analysis can be involved processes, and the VibrationVIEW and ObserVIEW software programs include many features to help engineers along the way. The following examples highlight several ways to optimize your testing and analysis processes in these programs.
Vibration Control with VibrationVIEW
Software overview: VibrationVIEW Controller Systems
Import Test Profiles via Excel Application
Engineers rely on manual entry when entering a new test profile from a standard. This process takes time if there are a dozen or more plot points, and it risks typing errors. In the Excel application, the user can scan data from a table to a sheet. From there, they can copy the table and paste it into VibrationVIEW.
Auto-calculate Random Breakpoint Values
A test specification does not always define all frequency, amplitude, and slope values for a random breakpoint table. For example, if a profile is missing an amplitude value between two points, the VibrationVIEW software can calculate it from the two frequency values, slope, and known amplitude value.
Save Settings for a Quicker Setup
Re-entering small amounts of information for each test run can add up when factoring in the setup and equipment, test settings, and report settings. In VibrationVIEW, engineers can save several settings to the program to streamline their process.
- System limits: select the User Defined Limits option to save a shaker setup, including moving mass
- Inputs: select the Save configuration option to add a sensor to the database
- Test profiles: save a test profile to your local disk. A Save As dialog will appear after the user creates a test profile or select File > Save As > Test Profile
- Graph layouts: select Graph > Save Graph Layout to save a layout of graphs and their settings for future use
- Report templates: customize and save report templates that meet test specifications
- Memorized drive: store the required output signal with a Random, Shock, or FDR test profile so the output quickly comes up to the desired level when the test starts running
Multitask with Notifications
An engineer may leave a test running without supervision if the schedule is hours-long. Likely, they’ll perform periodic checks, which can be time-consuming in a large facility. Additionally, a test may abort and sit idle for a while before the engineer returns to the laboratory. With email/text notifications, VibrationVIEW can inform the engineer of test completion, level changes, test status, or aborts. Automated notifications keep track of the test for the engineer.
Schedule Test Runs
The VibrationVIEW test settings have a Schedule tab, which allows the engineer to schedule run times, level changes, timed pauses, report generation, and more.
Auto-annotation
In Sine and Random, the auto-annotate command adds the amplitudes and frequencies of the detected resonance peaks to the current graph. Navigate to Cursor > Auto-Annotate Settings to set the number of values to annotate.
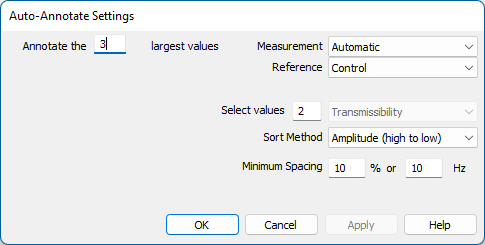
Auto-Annotate Settings dialog.
Learn the Shortcuts
If an engineer uses VibrationVIEW frequently, it is advantageous for them to learn the software’s shortcut keys. For example, Shift + Insert adds an annotation at the nearest peak.
Signal Analysis with ObserVIEW
Software overview: Vibration Analysis Software
Overlay, Resample, or Filter Multiple Files
If importing multiple files for analysis, the engineer can use ObserVIEW’s Batch File Processor to import/manipulate data simultaneously.
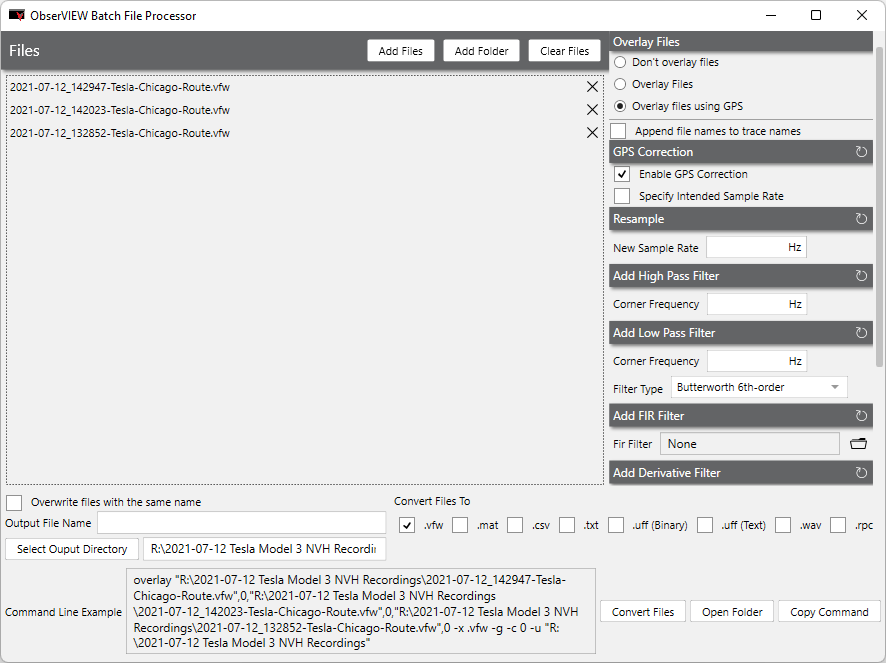
Batch File Processor dialog in ObserVIEW.
Text File Import for Data with Missing Information
The Text File Import feature simplifies import when information is missing. Using the Text Import dialog, the user can:
- Define the waveform sample rate
- Define the units for each channel or apply the same one to all
- Exclude channels from the analysis
- Define the text file’s delimiter
- Toggle between raw data and parsed data
Add Different Analysis Ranges to a Project
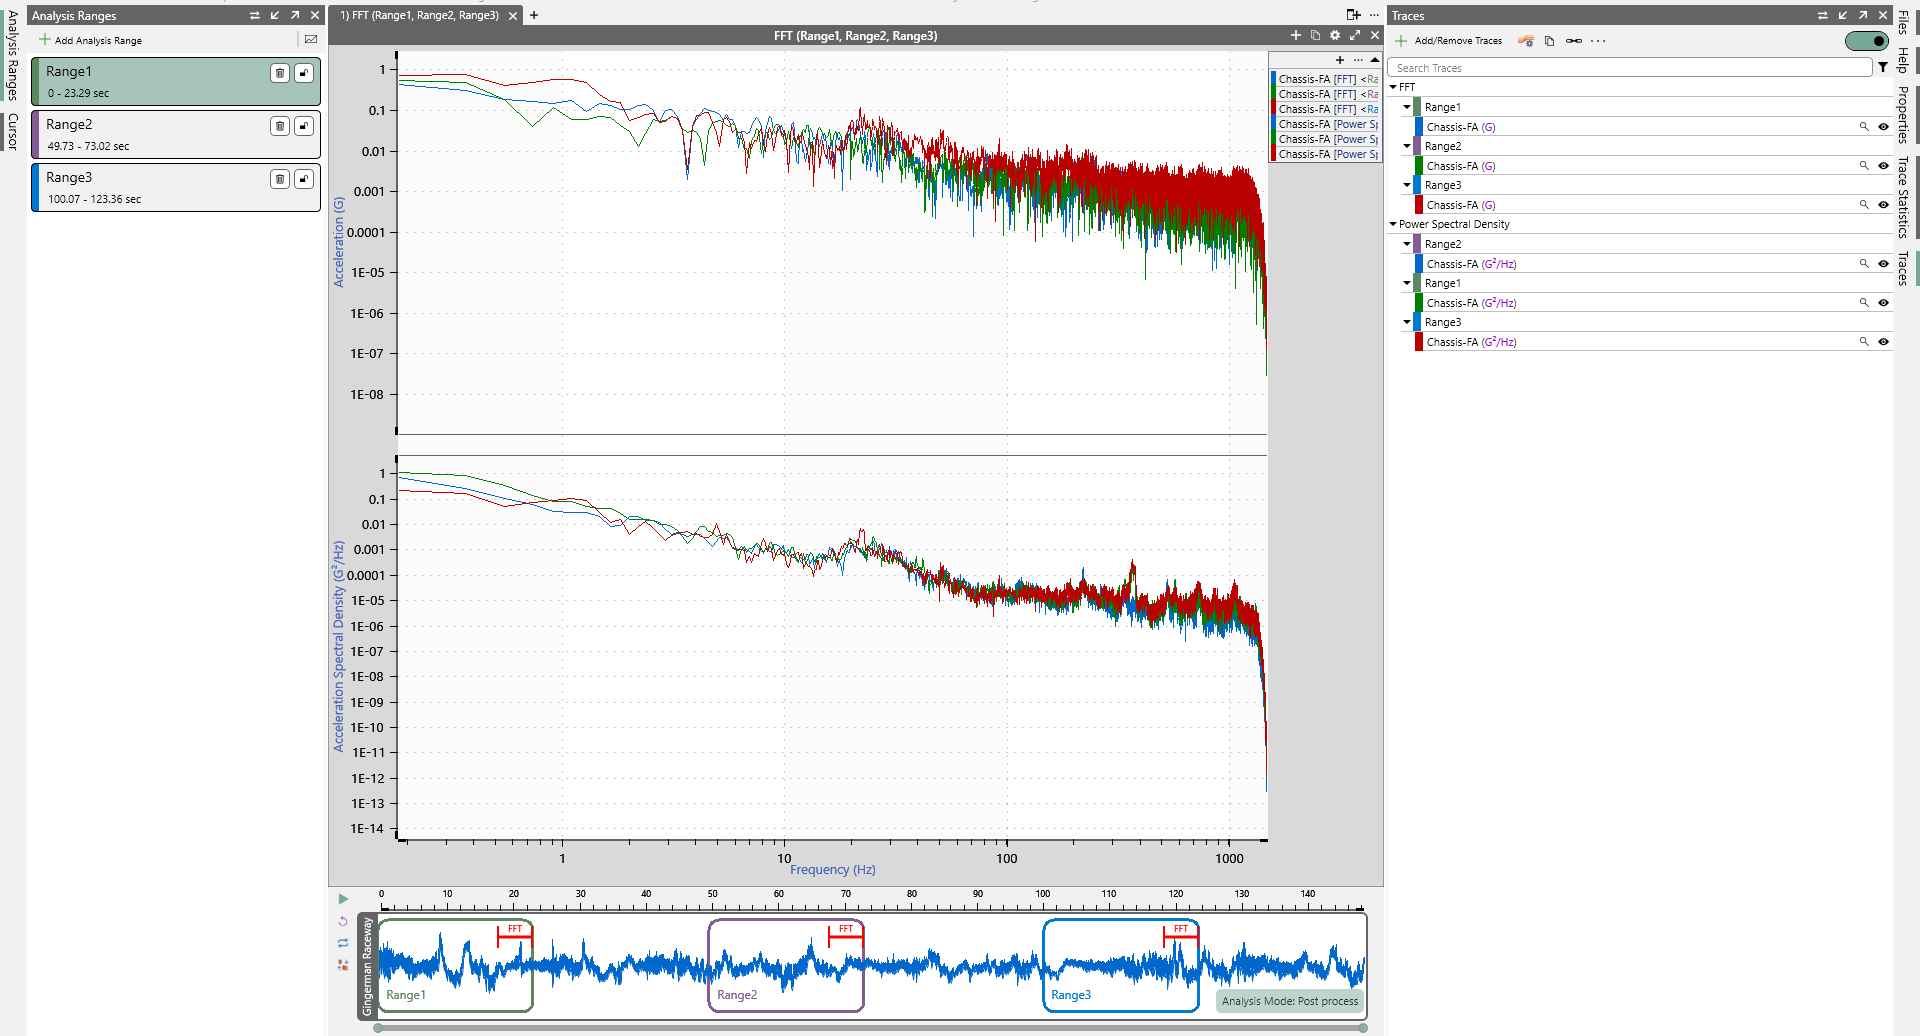
Add Analysis Range pane in ObserVIEW.
Engineers can add multiple analysis ranges to their project and easily navigate between them rather than create a new project for each data range of significance. This option allows them to compare data of differing times, frequencies, etc.
The Analysis Ranges pane is to the left (by default) of the main graph next to the Cursor tab. Select the Add Analysis Range button to define an analysis range. Use the summary graph to adjust the range. To lock an analysis range, select the lock icon button.
Group Selecting/Deselecting Traces
In ObserVIEW, traces represent the input data. Engineers can select the visibility of each trace individually, which can be time-consuming if they are analyzing many traces. Holding the Shift key, the engineer can group-select traces and mass-change their visibility. They can also invert visibility by right-clicking in the traces pane and selecting Invert Visibility. If they select the wrong group of traces, they can right-click and select Invert Selection.
Remove Extraneous Low/High Frequencies
When performing an analysis, there are often frequencies that are not of interest/importance to the engineer. Removing frequencies on the low/high end of the spectrum allows the engineer to focus on relevant data. To manipulate all data, they can apply a high-pass or low-pass filter. If only one trace (input) requires filtering, they can apply individual filtering via a math trace.
Copy-and-paste Traces
Within the ObserVIEW software, traces can be copied and pasted to any graph to create a static trace, including the same graph from which it was copied. If you want to compare data from a graph in VibrationVIEW to data in ObserVIEW, you can do so with the copy-and-paste command. A graph or trace from ObserVIEW can also be copied and pasted into Microsoft Excel or another text document application.
Apply Math Functions
The Math option allows engineers to add custom math operations to time or frequency graphs. Example applications of math traces include enveloping data, averaging channels, and integrating/differentiating data. Engineers can add math functions to their analysis graphs for comparison, averaging, creating virtual channels, and more.
Set a Tolerance Min/Max
The Tolerance Lines options allow the engineer to set a trace as the minimum or maximum tolerance. The software will identify data above/below the tolerance with a red/green background for quick identification.
Data Acquisition
Properly recorded data contributes to the ease of signal analysis. The following articles provide guidance on preparation before field data acquisition.
- Checklist: ObserVR1000 Recording Setup
- Video tips: ObserVR1000 Hardware Considerations
- Article: Sensor Orientation for Vibration Data Recording
- Article: Time Sync GoPro and ObserVR1000 Recordings
- Video tips: ObserVR1000 Headset Microphone
If you need any assistance with these features, please visit the Help file in the software or contact our support team.