At the start of 2022, the Vibration Research team set off in nine small groups to test the ObserVR1000 dynamic signal analyzer in real-world applications. The goal was to understand our product better in an operational setting and note any potential improvements. The groups presented their findings to the rest of the VR team. This series relays pertinent (or simply fun) information we experienced.
Transient Shock Events: On Ice!
ObserVIEW Software: SRS
Group 9 wanted to perform a unique recording project that celebrated the state of Michigan and embraced winter. Their selection also needed to include a device to mount the sensors on. Curling at Stormcloud Brewing was an ideal option. Curling is unique, Michigan is known for its microbreweries, and the ice rink is an element of winter.
Unfortunately, Michigan is also known for its unpredictable and inconsistent weather. After uncharacteristically warm and rainy days foiled two attempts to go to the brewery, the team had to switch to a backup plan and traveled a shorter distance to an outdoor ice rink nearby.
Preparation
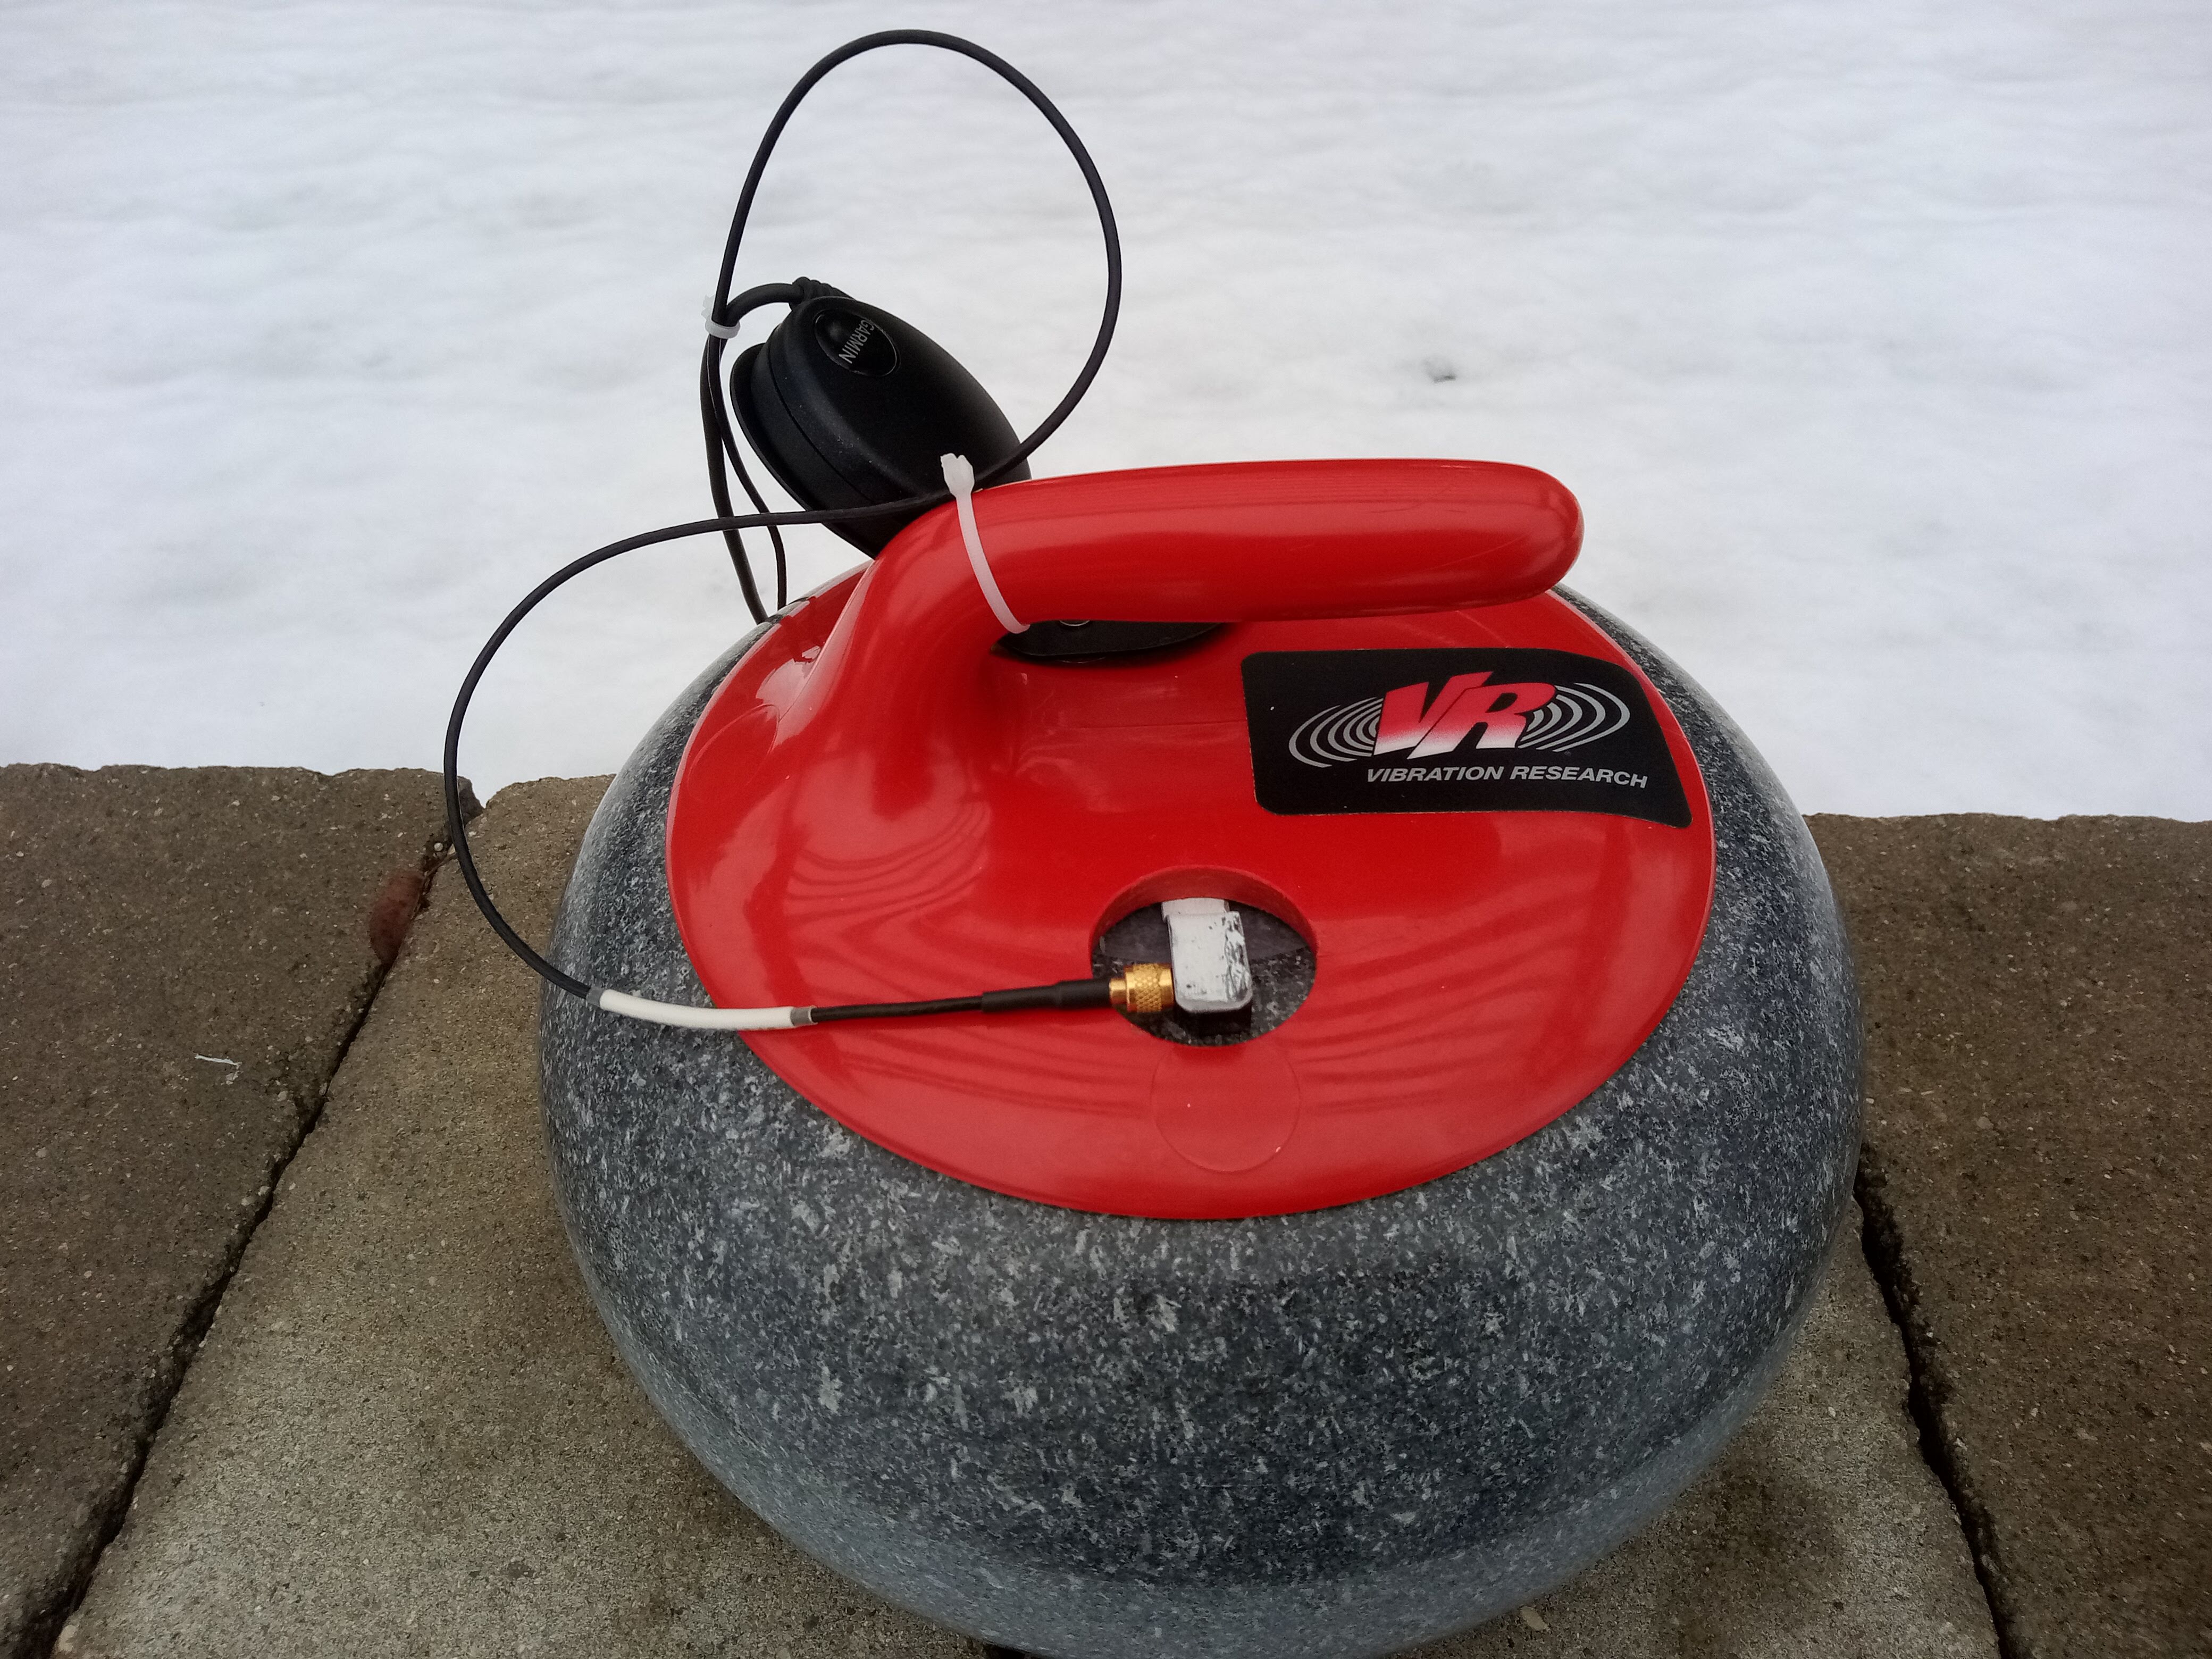 The team purchased two remanufactured curling stones from the Canada Curling Stone Company. They needed to pre-cool the stone before use, as a temperature difference between the ice and stone affects how quickly the stone curls.
The instrumentation on each stone consisted of a triaxial accelerometer superglued directly to the stone and a 5Hz GPS. The team used the VR Mobile app on a mobile device to configure the ObserVR1000s.
First Try
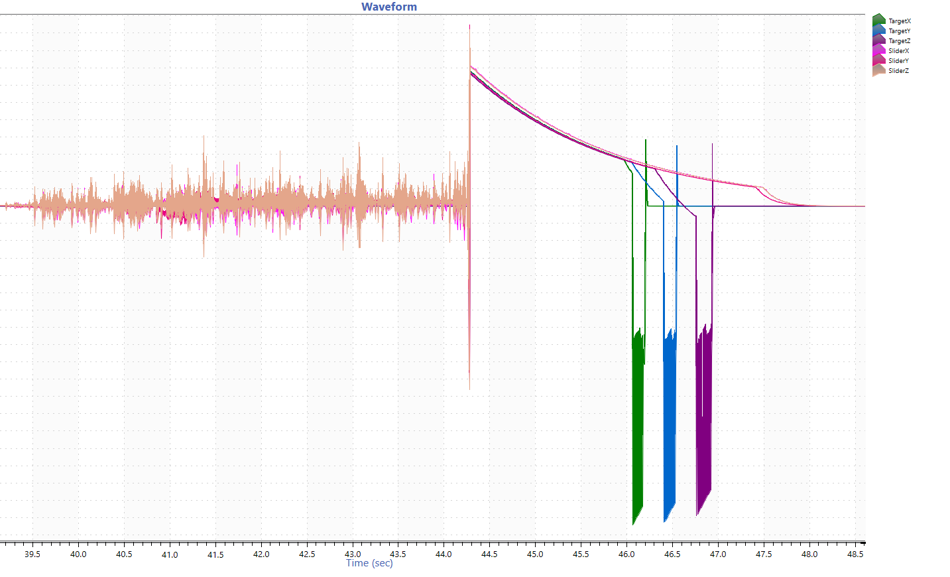
Group 9 ran several trials where they curled one stone into the other. One team member held the ObserVR1000 and ran alongside the moving stone.
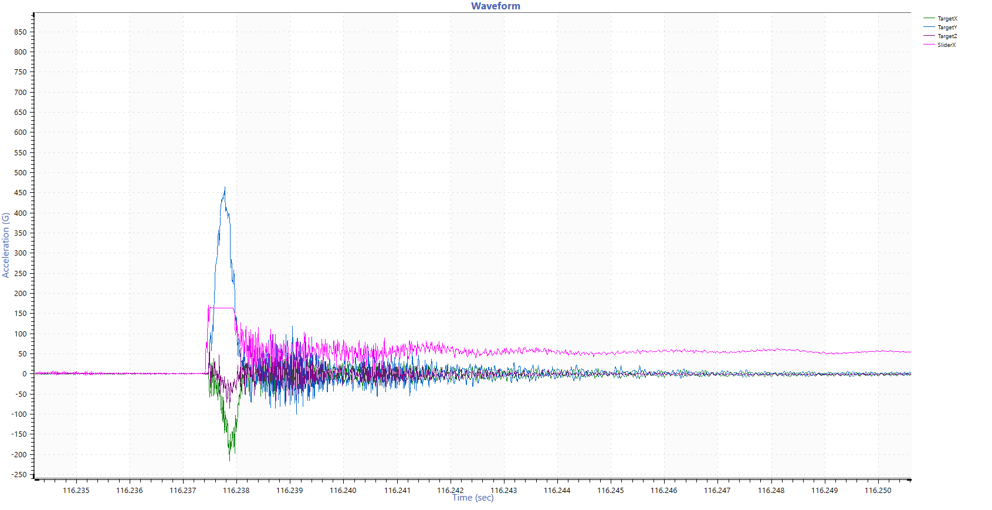
After reviewing the recorded data, however, they discovered a problem. One accelerometer had a maximum amplitude of 100G, and the other’s maximum was 500G. The impact of two curling stones was about 500G at the minimum. The solid hits saturated the accelerometers, rendering the data useless.
Even with a light hit, the 500G accelerometer registered 400-500G, and the 100G accelerometer was saturated (pink trace below).
In response, the group exchanged the 100G accelerometer for another 500G one and returned to the ice rink. They re-ran the impacts, being careful to use a gentler touch. This project provided a reminder to check data periodically (at the very least) during recording to ensure the collection is running smoothly.
Data Analysis
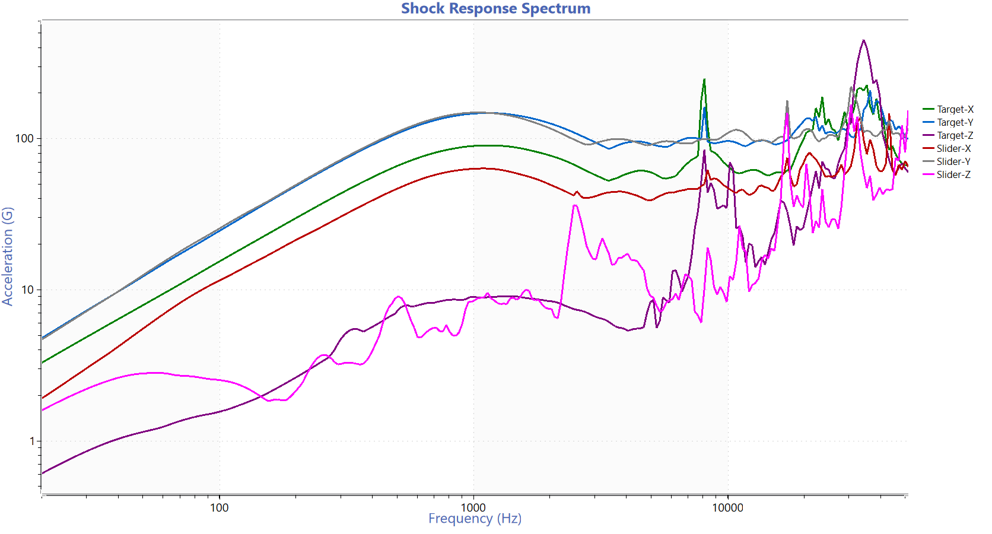
After the second recording, Group 9 had data to analyze. The time waveform displayed an initial hit, then a small double-hit after. In ObserVIEW, they generated a shock response spectrum (SRS) because the impacts were transient shock events. They applied the following SRS trace options:
- Spacing: 24
- Min Band: 20Hz
- Max Band: 60,000Hz
- Q: 100
- Damping: 0.5%
The x and y directions of the stones displayed a similar shock wave upon impact. In particular, the y-direction for both must have been aligned similarly upon impact.
The group found that the frequency data below 4,000Hz derived from the initial shock. The double-hit accounted for the higher frequency acceleration. If they wanted to attach the sensors to another part of the stone (such as the handle) and re-test, they would need to ensure that the handle’s resonances were outside the peaks in the SRS graph.
Vector Math
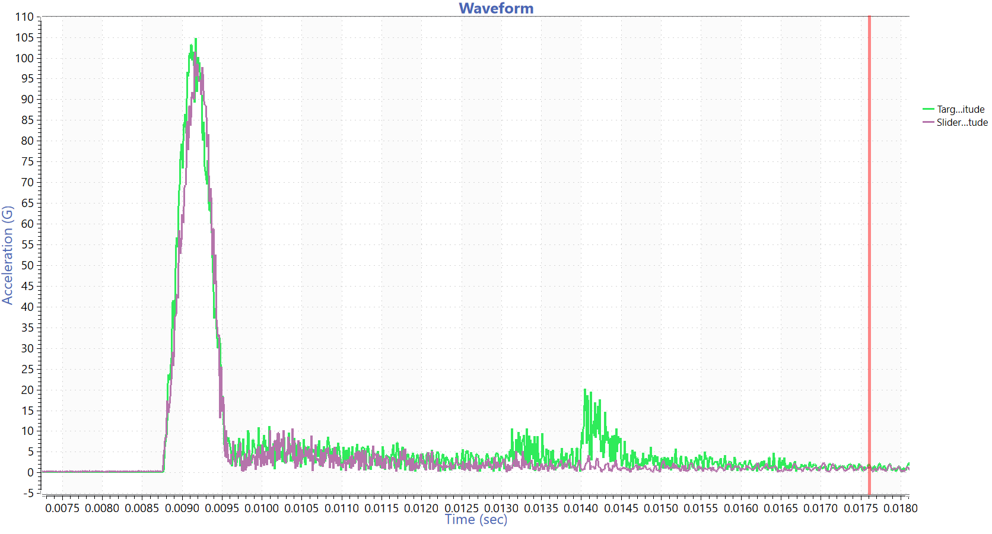
As there was an elastic collision of two stones with the same mass, the stones should have had the same acceleration. The group used math traces to calculate the magnitude of the acceleration as the vector magnitude of the x and y-components. They could not analyze the x and y-axes individually because the direction of the triaxial accelerometers was not necessarily the same.
G = √(𝑥2+𝑦2)
The calculation shows the response of the x and y axes to be the same. They could overlay the target and slider time waveforms using the GPS overlay option in the software for precise time synchronization. They were also able to use it to eliminate clock drift over time.
Featured Software
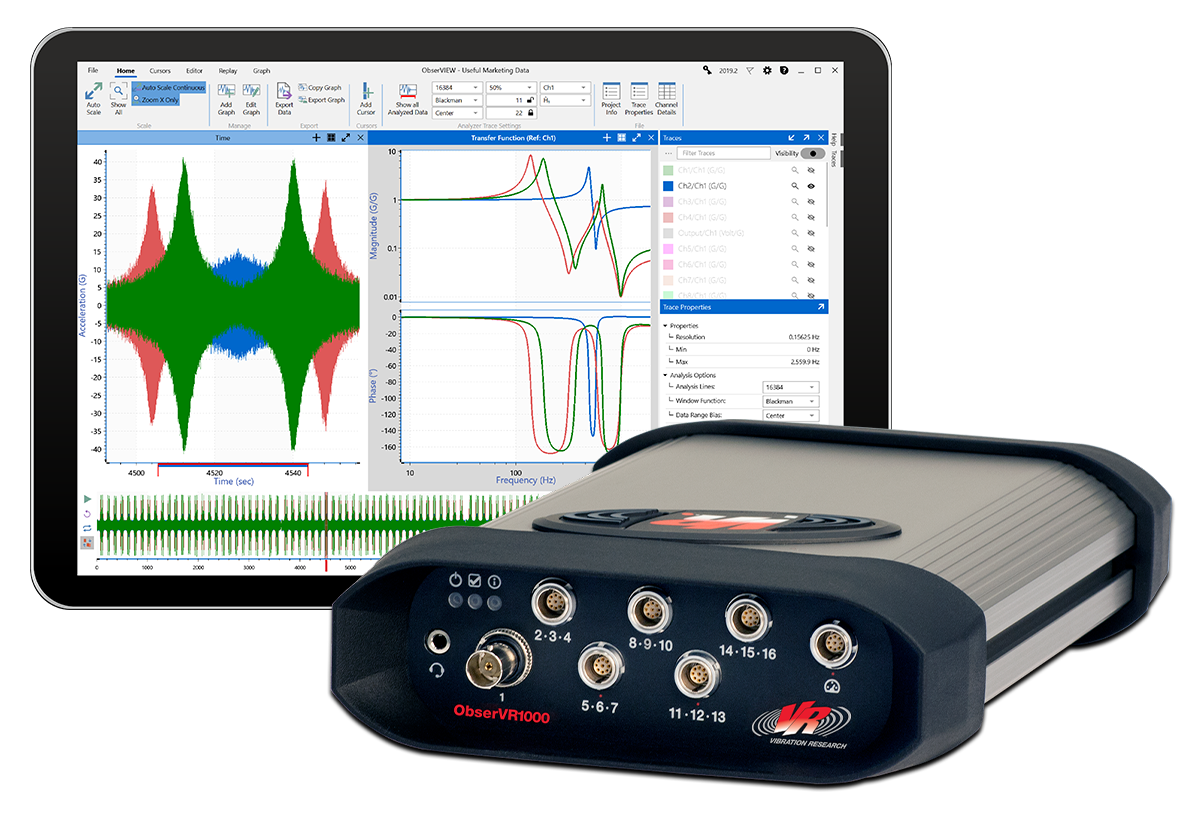
ObserVR1000 Recording Checklist
There are a few items to keep in mind when setting up the ObserVR1000 for recording. To make it easy, we’ve compiled a checklist to review before you begin.

