The reporting capabilities of the VibrationVIEW software are one of many features that set Vibration Research apart. The program includes default templates for quick reporting and tools for user-friendly custom reporting, including Report Builder: a built-in word processor for generating reports.
With a custom document, customers can add report parameters that adhere to test standards or customer requests. They can also add details like graphs, screen images, test notes, and company branding.
Custom Reports Using Report Parameters
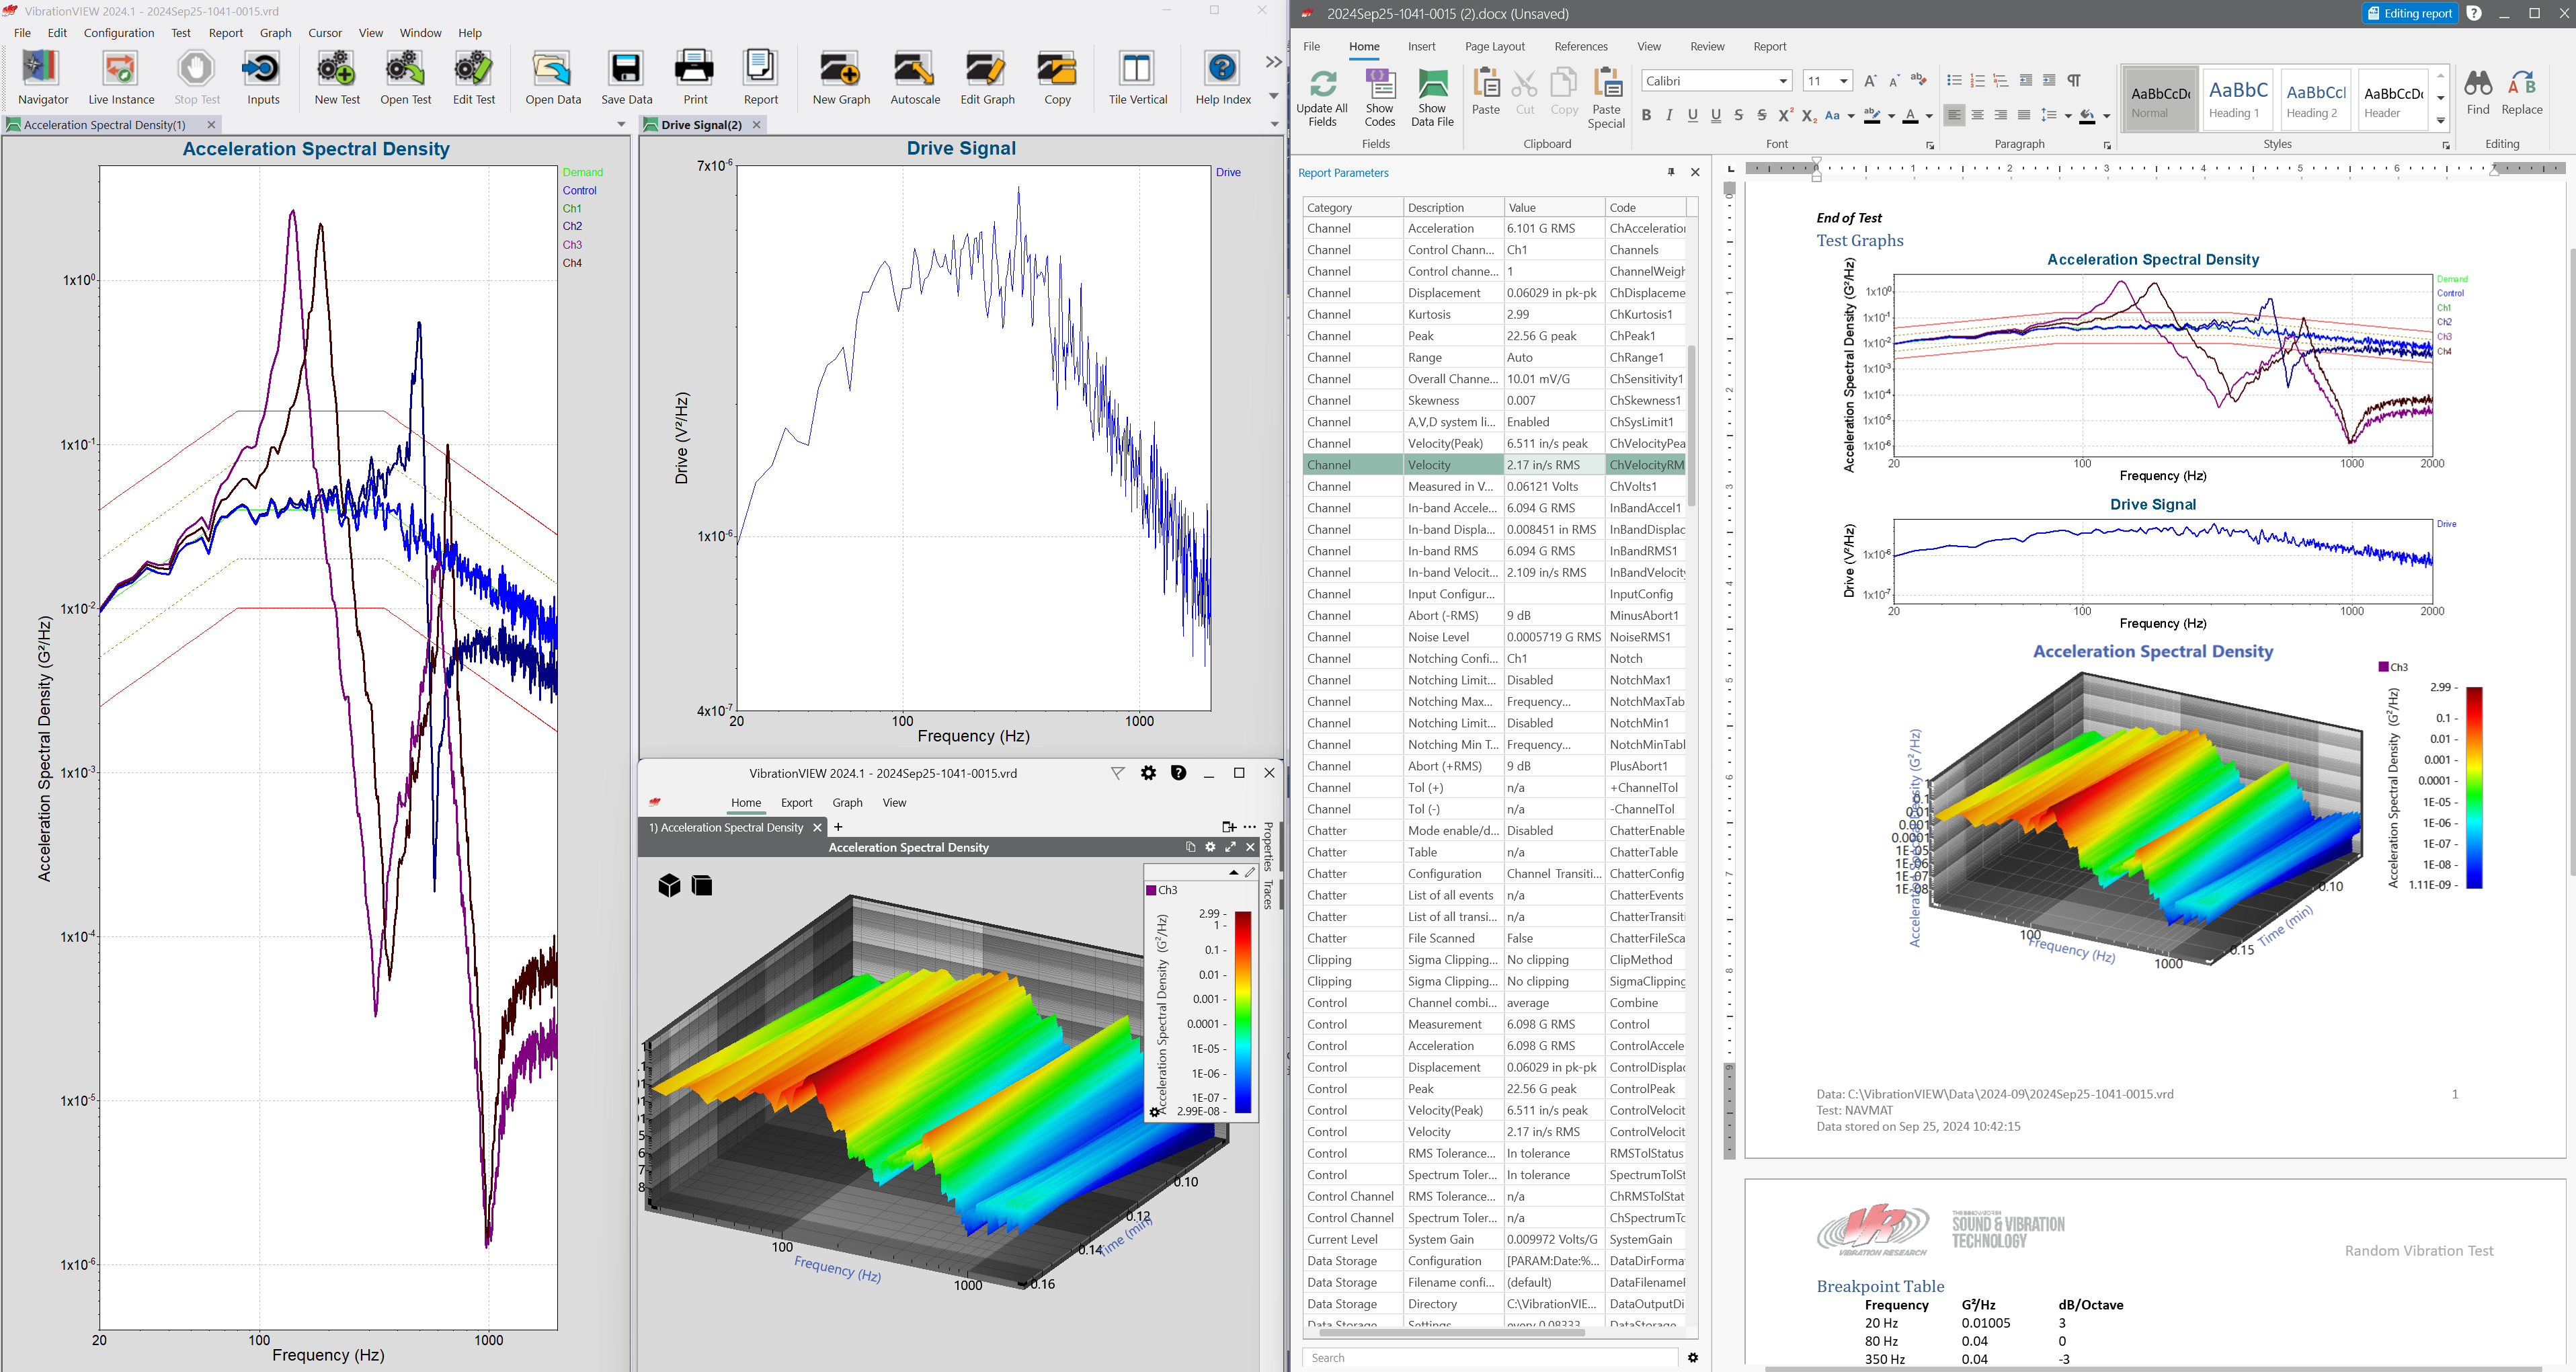
VibrationVIEW auto-generates reports using mail merge-type processing. The program reads a template file, substitutes data values and graphs in place of variables, and writes the resulting data to an output file. This process eliminates the need for the engineer to copy data from the test to their report.
Customers can access VibrationVIEW’s built-in Report Builder to create a custom report or template. This feature streamlines the report generation process, eliminating the need to generate, review, and edit a report in different programs.
With Report Builder, you do not need to be a designer to create polished vibration test reports. The feature previews the working design and updates automatically to adjustments. You can open the program while the test runs and make changes or schedule to view/save a report at the end of a test.
Download How-to PDF
Data Values
Customers can add data values to a file using report parameters. The parameter field appears as {DOCVARIABLE name}. The brackets indicate the beginning and end of the field, and the customer replaces “name” with the variable name. The parameter fields can refer to a loop or channel and include formatting, such as alignment or significant digits.
NOTE: VibrationVIEW versions 2023 and older use the [PARAM] field instead of {DOCVARIABLE}.
VibrationVIEW supports many parameters, which are specific to the active test type. There are report parameters to define the test profile and controller, display the test results, list events, detail accelerometer calibration, and much more.
To view the valid parameters for the active test mode, select View > Report Parameters. If the Report Builder is open, navigate to the Report tab and select the Report Parameters button.
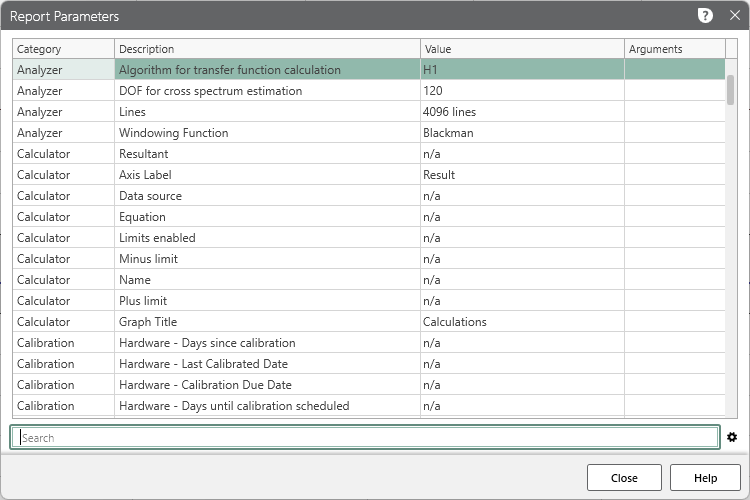
Right-click a row and select “Copy code:” to copy the parameter code or click and drag the parameter into the document. If a report parameter is channel-specific, you can use the drop-down list in the Arguments column to select a channel. This action will set all channel-specific parameters to the selected channel.
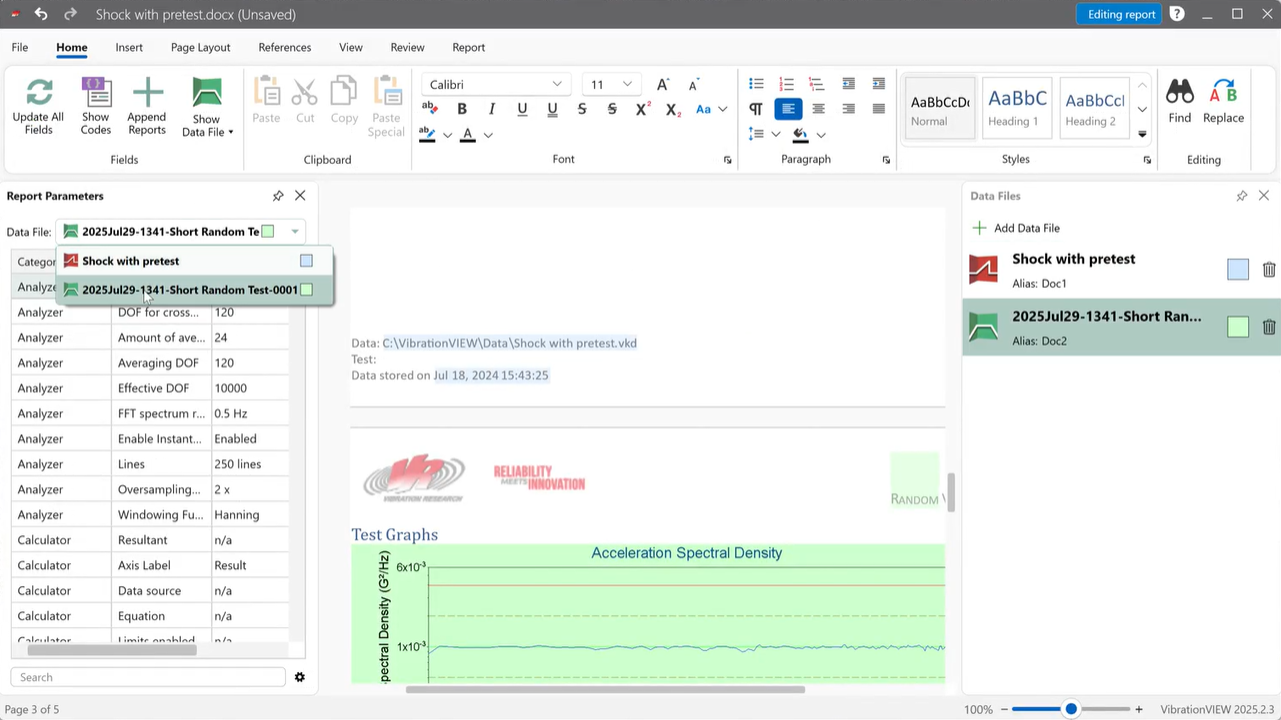
Parameters from Multiple Tests/Data Sets
Laboratories that run multiple tests or have multiple data files can include all data in a single report template. With the Data Files pane, engineers can add data files to a single project, select parameters by data file, and append report files.
HTML and Excel Reports
In addition to docx files for Word, the program can save reports as an HTML file or CSV file for Microsoft Excel®.
HTML Reports
VibrationVIEW includes HTML reports for remote data access and test control, and the program requires an HTML report to use the optional Web Server module. The user can generate HTML reports with any HTML editor.
Excel Reports
The program compiles Excel reports from a sequence of saved data files from a test run. The “history” option allocates a row for each saved data file and can include the 30 most recent files. Each row contains the control value at the time the program saved the data.
The user can restrict the number of files by including the number of desired files after the history keyword. For example, [PARAM:Control,History:10] will allocate a row for the ten most recent files.
Tech Talks
Version 2024
Version 2018
Scheduling Reports
Available for Sine, Random, FDR, Shock, SRS, and UDT
On the Test Settings dialog box, the Schedule tab includes the option to automatically create and save reports while the test is running. This scheduling option helps the user streamline the reporting process after they create a report template.
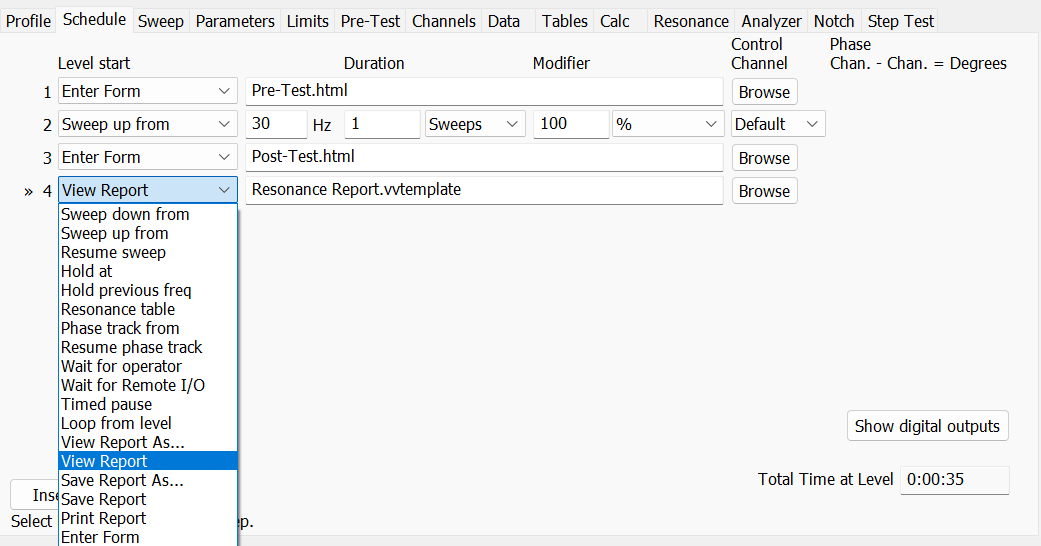 To define the schedule, point to the left-most drop-down list. The reporting modifier types are as follows:
- View Report As
- View Report
- Save Report As
- Save Report
- Print Report
The “View Report As” and “View Report” modifiers open a report after the test reaches the user-defined level. The software also saves a copy of the report to the hard drive of your system. The “Save Report As” and “Save Report” modifiers automatically save a report, and “Print Report” automatically prints a report. All modifiers require that the user select a report template.
Download Demo
Download a free demo of VibrationVIEW today and begin developing custom reports straight away. Interested in learning more? Visit the software page.