At the start of 2022, the Vibration Research team set off in nine small groups to test the ObserVR1000 dynamic signal analyzer in real-world applications. The goal was to understand our product better in an operational setting and note any potential improvements. The groups presented their findings to the rest of the VR team. This series relays pertinent (or simply fun) information we found.
You Recorded the Data. Now What?
ObserVIEW Software: FDS, Octave Analysis, Advanced Analysis
A big thanks to Wild Willy’s Airboat Tours!
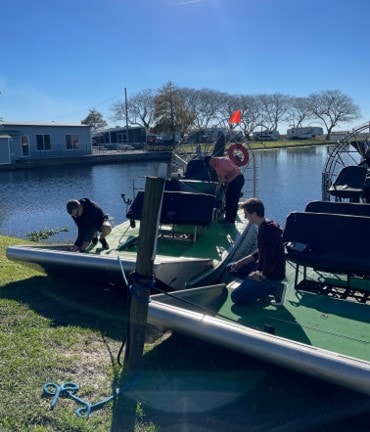
Group 3 headed to the everglades to compare the vibrational response of airboats. They mounted a single-axis accelerometer to two boats with similar construction and connected the transducers to an ObserVR1000. Boat 1 had an additional accelerometer mounted near the driver’s seat. Then, the team split up to record the responses during a one-hour tour.
Setup
The group mounted the accelerometers to the aluminum hull with glue. They also connected a GPS to each hardware system and set up a GoPro camera to capture any potential events that would cause a spike in acceleration. The VR Mobile application allowed them to synchronize the video timestamp and GPS.
Comparing the Vibrations
The vibrations were relatively similar between the two boats, including the responses of the hull and the driver’s seat. Unable to do much in terms of comparison, Group 3 turned to different options for analysis and test development in the ObserVIEW software.
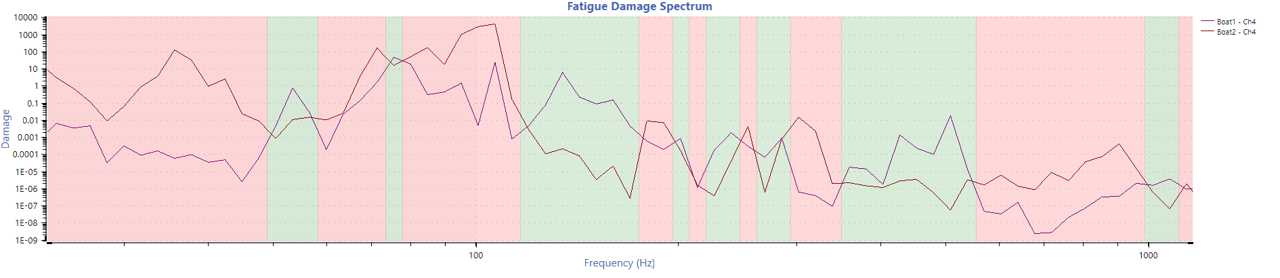
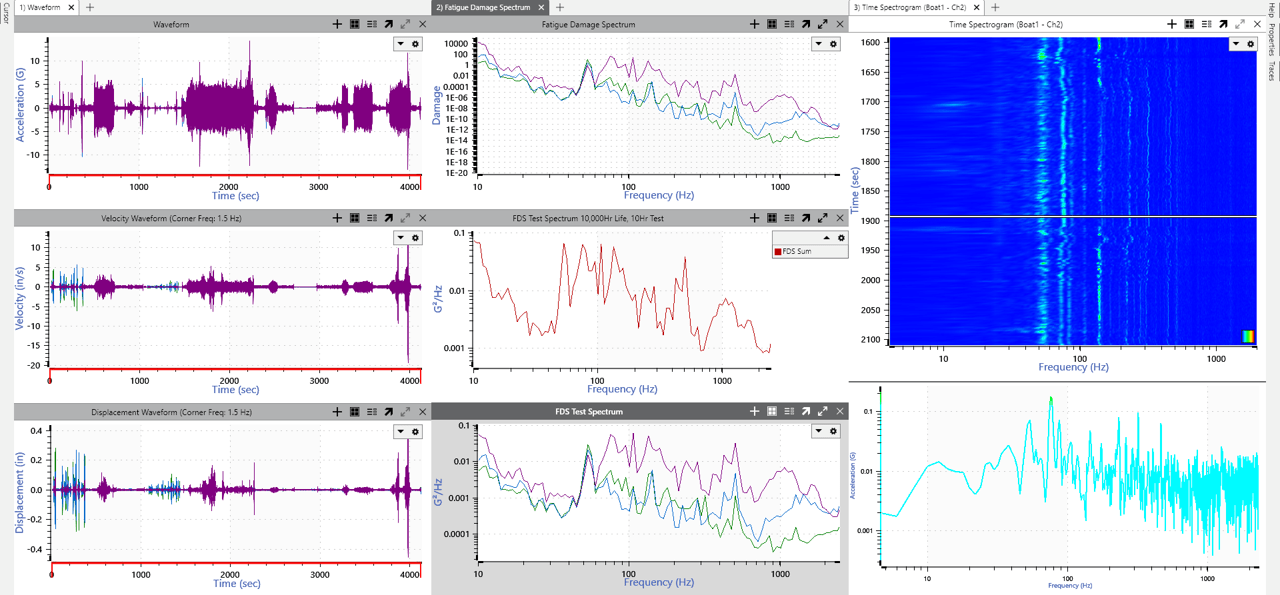
Comparison of FDS for boats 1 and 2.
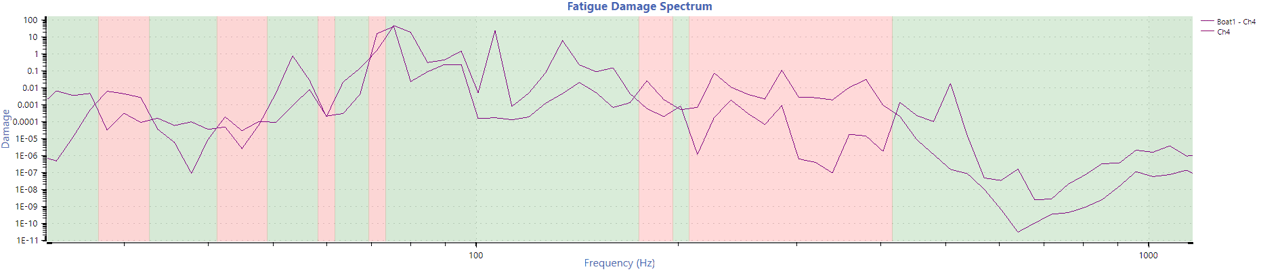
Comparison of FDS for accelerometers on boat 1.
Spectrogram Analysis
With the live spectrogram option, the group could view the changes in energy as the boat turned and started to accelerate. After it reached full speed, the engine RPM stabilized as a helicopter would. The airboat driver turned the pitch of the blades to increase/decrease speed more than accelerating and decelerating, which accounted for the stabilized RPM.
Octave analysis
The team also reviewed the differences in frequency and octave content. In comparing the acceleration waveforms, they found that the first boat started and stopped more than the second. The first boat had shorter sprints of acceleration versus the long durations of the second. An octave graph also displayed some of the differences in frequency.
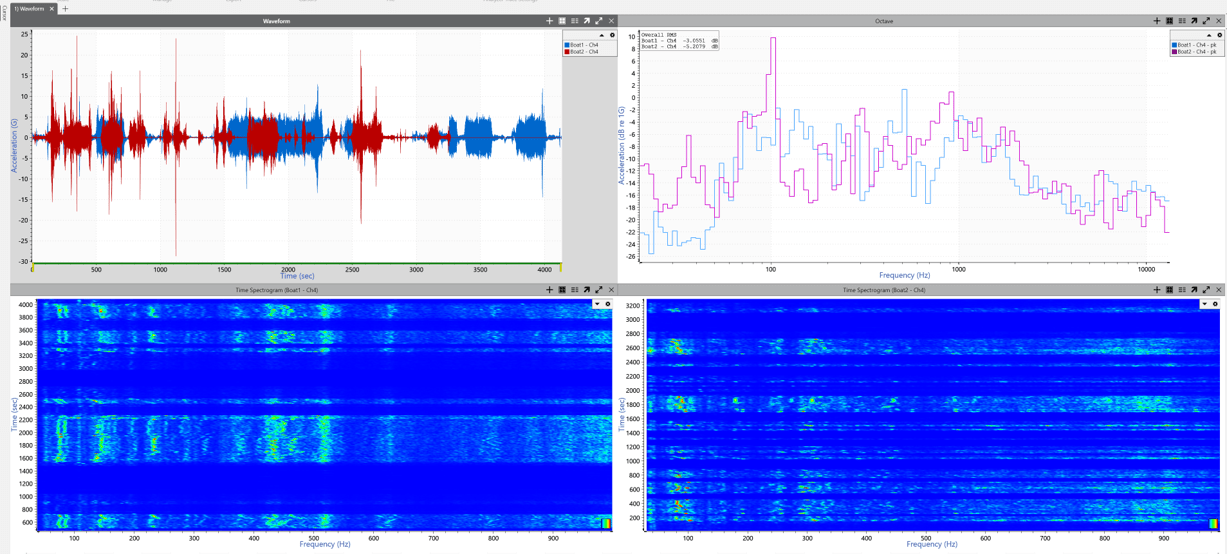
Data comparisons of boats 1 and 2. Graphs from top left: acceleration waveform, octave graph, time spectrogram boat 1, time spectrogram boat 2.
Generating a Lifetime Test
Using the new FDS feature, the group could develop a lifetime fatigue test profile. They used the assumption that a boat takes one-hour tours for 6 days each week over four years, which equated to a 10,000-hour life.
They generated a fatigue damage spectrum (FDS) from the recordings. The waveforms had some sinusoidal content, but it was not nearly as dominant near the hull, so they selected a purely random test.
They scaled the damage to 10,000 hours and accelerated it to a 10-hour test to generate a power spectral density (PSD) or “FDS test spectrum.” Using a math trace, they combined the channels to create an FDS sum. If the manufacturer wanted to run a lifetime fatigue test, they could copy the data and paste it into a vibration control software.
Filtering for Voices
Group 3 did not have a microphone during recording but recognized that the accelerometers were mounted to what was, essentially, a large metal plate. They wondered if audio could be extracted from the hull.
In ObserVIEW, they applied an FIR filter to the acceleration waveform. Filtering differentiates data based on frequency, and the FIR filter is a stable option.
Then, they added an octave graph and used the audio playback feature to locate a section of audio. Audio playback allowed them to listen to the audio while playing back the data. The following video is a snippet of what they were able to extract.
Featured Software

FDS
Octave Analysis
Advanced Analysis
ObserVR1000 Recording Checklist
There are a few items to keep in mind when setting up the ObserVR1000 for recording. To make it easy, we’ve compiled a checklist to review before you begin.