 In vibration testing, test engineers seek to create test profiles that reflect the real world as close as possible. This helps to ensure that the product can withstand the vibration events it will experience in its lifetime.
There are several test development methods where the original environment of a product can be replicated using actual field data. The result is a test profile that closely reflects—or is the equivalent to—the end environment.
FDS: Accelerated Random Test
A crack or deformation can incur gradually and appear only after many years. Therefore, a test standard may call for a test profile reflective of the fatigue that occurs for the product’s duration of use. The fatigue damage spectrum (FDS) is a test development tool that calculates a lifetime of fatigue damage using random data recordings.
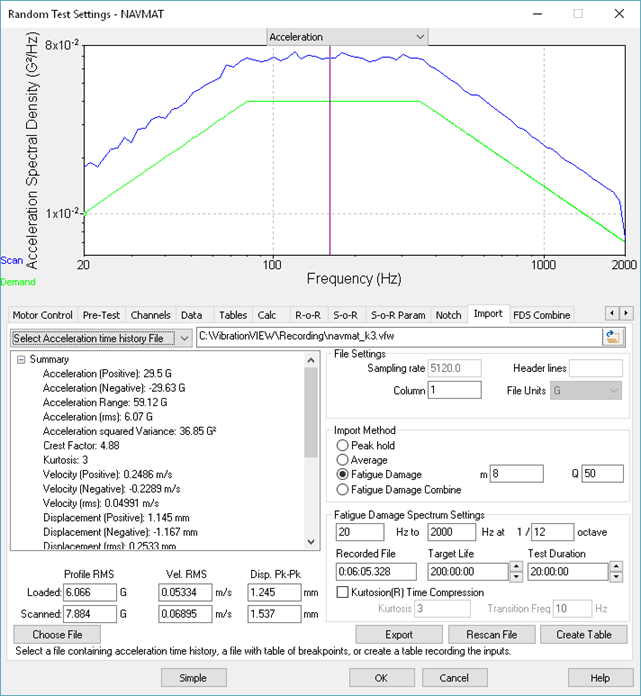
FDS test profile settings in VibrationVIEW.
A simple analysis can produce an average or peak hold power spectral density (PSD). The PSD displays the average/peak energy product experiences over time; however, it cannot be reliably accelerated, nor does it reflect a lifetime of use.
A random test developed with the FDS better represents the fatigue damage inflicted by the field environment. Engineers can also accelerate the FDS to generate the total fatigue damage in less time.
The FDS is a plot that displays the cumulative damage generated by a single waveform or a series. The waveforms derive from the different environments a product is exposed to throughout its lifetime. The cumulative damage is then calculated with the rainflow cycle counting method.
For test purposes, the FDS can then be converted into a PSD using Henderson-Piersol’s potential damage spectrum. The result is a single PSD profile for multiple time-history files.
The FDS-correlated PSD is a cumulative spectrum representing the relative damage experienced by the product for all the combined and weighted environments.
SRS: Complex Shock Test
Shock testing is integral to determining a product’s physical and functional performance during and after a shock event. Shock events can range from small and anticipated transient shocks to large and unexpected seismic events.
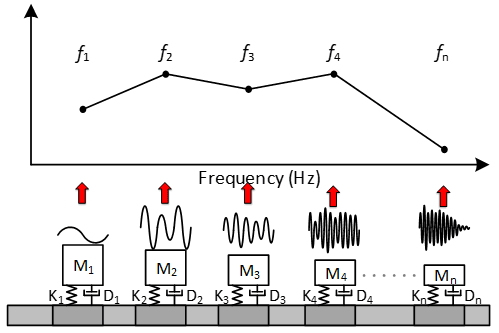
A basic model of the SRS.
A classical shock test controls regular shock pulses of a defined acceleration in the time domain. In comparison, the shock response spectrum (SRS) functions in the SRS domain, a frequency domain.
The SRS is not the product’s real response but rather a theoretical one. It displays the response of a series of single-degree-of-freedom oscillators to a shock event. Many industries use SRS for development and testing; in some cases, the required response spectrum (RRS) is defined as part of the specifications for product qualification.
A test-specified SRS is developed using wavelet control. Wavelet control uses a recorded waveform as a starting point and then uses feedback control to fine-tune it. This method ensures the control channel meets or exceeds the defined demand SRS.
The SRS feature in VibrationVIEW includes a variety of waveform synthesis generation techniques. The engineer can manually adjust the parameters of the underlying wavelets or have VibrationVIEW automatically create and run a test without intervention.
STAG: Accelerated Sine-on-Random Test
Sinusoidal and random vibrations often occur at the same time, and a sine-on-random (SoR) test is reflective of this real-world occurrence. An SoR test is a fitting choice for an environment with dominant sinusoidal vibration mixed with broadband random, such as that of engines, transmissions, gearboxes, electric motors, pumps, bearings, driveshafts, etc. Components mounted in and around these environments require an appropriate test profile.
Sinusoidal vibration constantly drives a frequency at a particular amplitude, while random vibration test excites the frequency at random amplitudes. Therefore, a combination of sine and random testing may be fitting. If the sinusoidal vibration exceeds the random levels, the test profile should include the sine tones to accurately represent the in-service environment.
The FDS is an accepted method for creating a random test. However, FDS is not ideal for processing sinusoidal content. In comparison, an SoR test can effectively generate random energy with sine tones superimposed in the background.
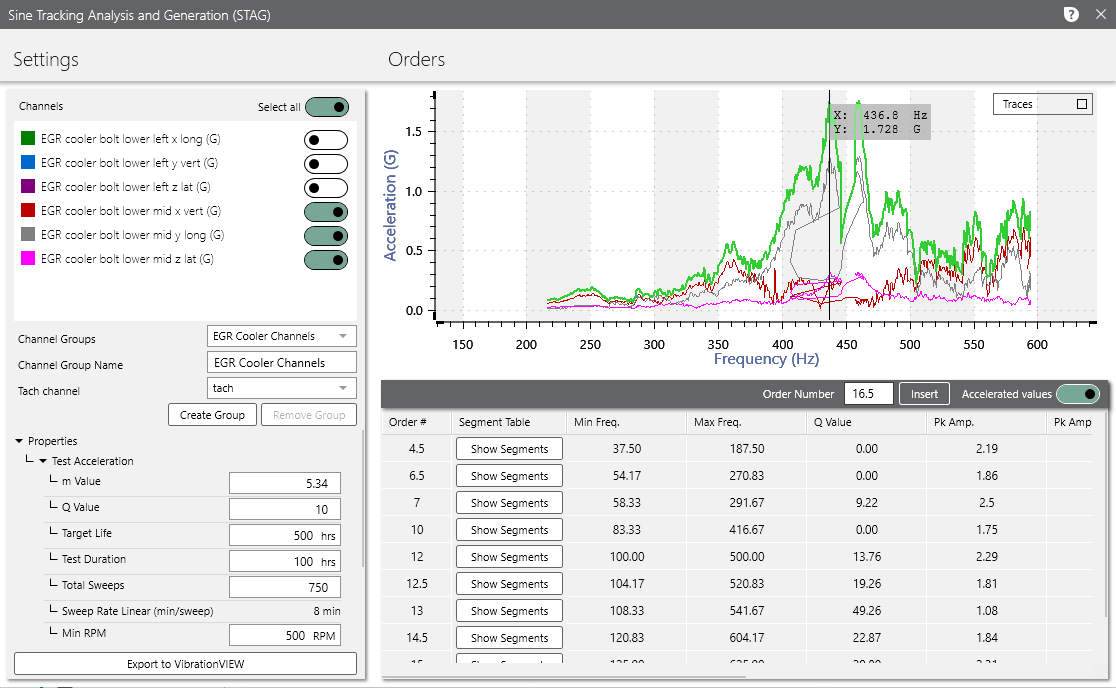
STAG dialog in ObserVIEW.
Vibration Research developed Sine Tracking, Analysis and Generation (STAG) to track, accelerate, and generate the SoR test profile needed to duplicate these environments on a shaker.
The STAG test development procedure uses a combination of order analysis, order extraction, sine tone profile creation, and sine tone profile acceleration to isolate, extract, and create an accelerated sine profile or series of sine profiles from a recording. Then, ObserVIEW analyzes the remaining random content with the FDS.
Combining the resulting sine and random tests allows the engineer to analyze, accelerate, and generate a test that represents real-world environments with dominant sinusoidal components.
Test Development VRU Course
Want to learn more? Enroll in our Test Development with Recorded Data course on VRU.