A new version of VibrationVIEW (2023.1) is available for download. In this latest software release, access a three-dimensional graph program, FDR with live playback, and increased lines of resolution.
Waterfall/3D Graph
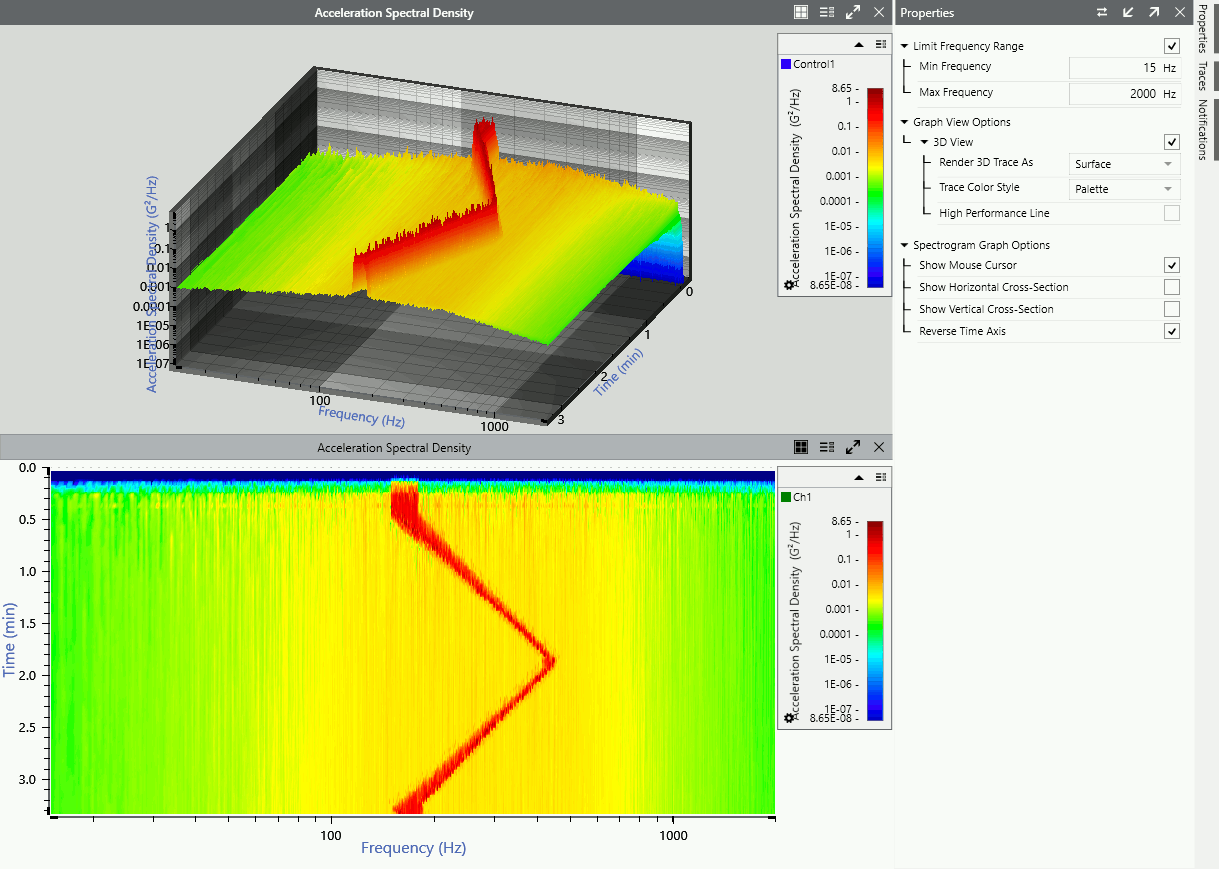
3D waterfall graph and 2D spectrogram in VibrationVIEW.
Access a new analyzer program that creates a three-dimensional plot from a set of Random data files or live data. It can display a 2D color map of a power spectral density (PSD) waveform or a 3D waterfall graph/color map spectrogram of a PSD waveform.
Test technicians can use a time spectrogram graph to visualize critical frequencies, particularly when the test environment is changing. Although the 3D program only runs in version 2023.1, technicians can upload random test data files from previous versions to create a 3D graph from stored data. They can also include the 3D plot in reports as an image file.
Increased Lines of Resolution
The software now supports a maximum lines of resolution value of 104,000 with the VR10500. A greater lines of resolution value improves resonance control out to high levels. More lines lead to a lower update rate; however, iDOF traces can be applied at this resolution to address this issue.
View Full Waveform in FDR with Live Playback
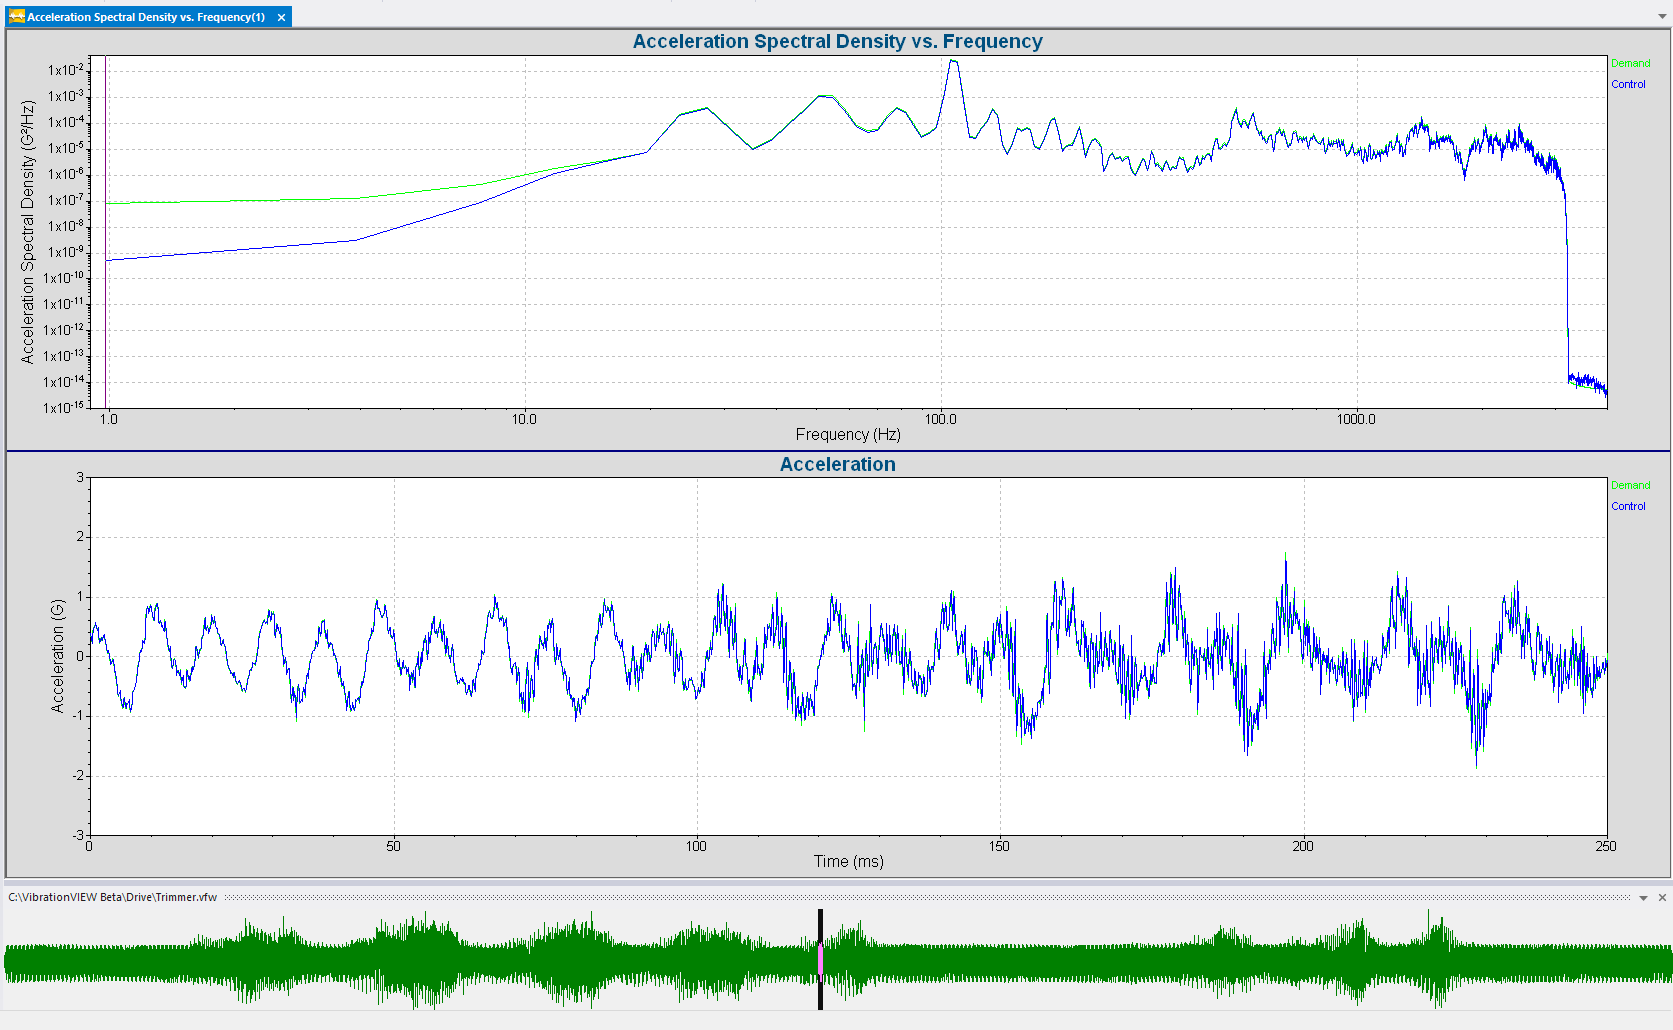
Live playback view in FDR.
Engineers use the Field Data Replication (FDR) software to reproduce a test environment on a shaker in the lab. In FDR, the user now has the option to view the complete acceleration waveform and the position of the time signal while the test is running. This update allows users to easily determine what point the test is at in the overall time history at any given time. They can also anticipate upcoming events in the file.
This view is optional and available for live data only. The user can access it under the View menu. They can also dock the view to the bottom of the VibrationVIEW window.
Memorize Notch or Boost for Level Changes
The VibrationVIEW Random software can boost/notch frequency ranges based on a response channel. Previously, the system applied the boost/notch after the test had reached the desired level. Now, when the test level increases, the system maintains the overall shape of the output and accounts for the boost/notch, overriding the control when it reaches the next level. This option minimizes the time it takes to boost/notch the response channel because it doesn’t have to re-calculate with each level change.
Improved Out-of-Band Displacement Control
The improved out-of-band displacement control in Random is helpful for low-frequency control (around 1-2Hz) when a low number of lines are below the first controlled bin. In version 2023, the low-frequency signal drops out significantly faster, resulting in less displacement on the shaker during these test types.
Additional Features
- Define test spectrum in units of velocity or displacement spectral density with any AVD control sensor in Random
- Specify a DC offset per channel
- Page through sets of channels with a shortcut (Ctrl + PgDn/PgUp)
- Report parameters for demand velocity and displacement in Sine
- Report parameters for amplitude and frequency in User Defined Transient
- Report parameters for demand velocity and demand displacement in Shock