 Traditional random vibration testing assumes a Gaussian distribution of data, where the highest peak accelerations are approximately ±3 times the average acceleration. Gaussian distribution is universally accepted as a legitimate averaging technique, in part because it has been assumed that real-world data are Gaussian.
However, several studies have determined that real-world data are non-Gaussian. As modern vibration controllers average data to produce a Gaussian distribution, how can we make a random vibration test more realistic? The answer derives from the statistics of random vibration or, specifically, the kurtosis value.
Random Vibration Statistics
We can use statistics to uncover many relevant details about a set of recorded data. For example, its mean and standard deviation are easily computable. These basic statistical concepts indicate the average and the range in which most data points fall, respectively. Perhaps a less familiar statistical concept is kurtosis.
Kurtosis measures the “peakiness” of a data’s probability distribution, which details the possible levels of a signal. A high kurtosis value indicates that the data are distributed with large outlier data points; a low kurtosis value indicates that most data points fall near the mean with very few and small outliers.
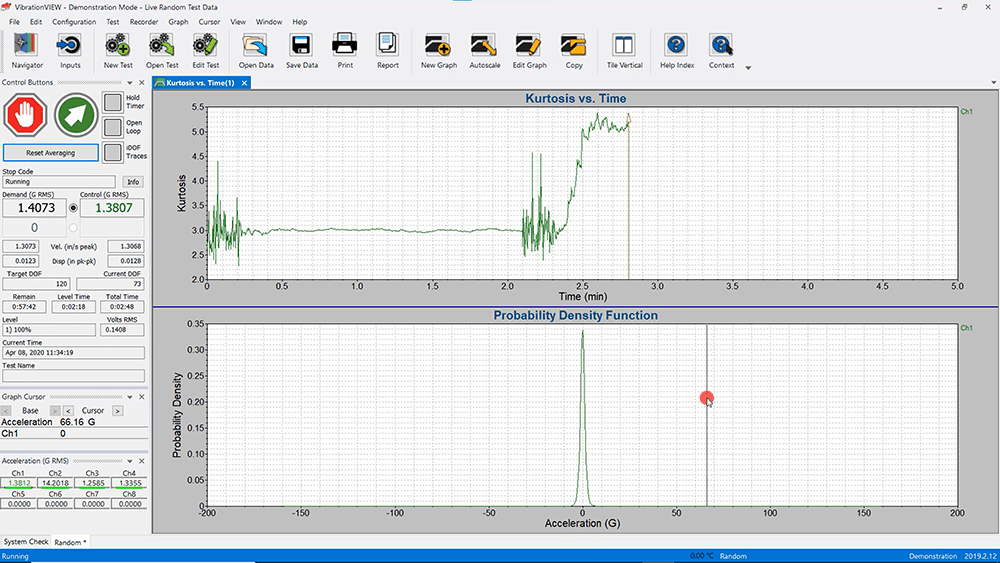
For a Gaussian distribution of data, the kurtosis value is 3, meaning the data points fall within ±3 standard deviations of the average/mean (Figure 1).


Figure 1: Random vibration waveform and probability density function (PDF) for a Gaussian data set.
Non-Gaussian (Kurtosis) Distribution
Modern vibration controllers use a Fourier transform calculation to produce a Gaussian waveform. As such, traditional random vibration testing averages data in such a way as to generate a Gaussian distribution of data. However, non-Gaussian data may have peaks that deviate further than ±3 standard deviations from the mean value. These peak values may damage the device under test, and omitting them would result in under-testing. Random kurtosis control is an option to adjust the distribution to fit the field data.
Figure 2 compares two data sets. One has a kurtosis value of 3 (Gaussian distribution) and is a smooth curved distribution with few large-amplitude outliers. The other has a kurtosis value of 7 (non-Gaussian distribution). Its distribution tails extend further from the mean, indicating many outlier data points.

Figure 2: PDF plot of a Gaussian data set (k=3) and a non-Gaussian data set (k=7).
The question pertinent to vibration testing is: “Can a test have a non-Gaussian distribution while maintaining the same average energy and power spectral density (PSD)?”
Example
The following table represents the test scores from a class of 26 students (Figure 3). The first row represents the first test the students took, and the second row represents the second one. Both tests’ averages are 79.5. The first data set histogram produces a Gaussian bell-shaped curve, while the second data set produces a non-Gaussian curve.


Figure 3: Gaussian (Test Scores #1) and non-Gaussian distribution of test scores (Test Scores #2)
This example shows that data can have the same average but a different distribution around the average. Consequently, you can take some energy from the center of the PDF tails (±1 sigma from the average) and distribute it at ±4 sigma. As a result, the extreme tails will contain more energy while the total energy under the curve is maintained.
When to Use Random Kurtosis Control
As real-world data are not always Gaussian, it is wise to adjust your test settings so that the distribution of data has a non-Gaussian distribution and maintains the same PSD. We must increase the data set’s kurtosis value to do so.
 Kurtosion® is a patented method of increasing the kurtosis of a test. There are two test situations where you should use Kurtosion for random kurtosis control.
If we want our test to represent real-life vibration, we should adjust the test’s kurtosis value to match the measured kurtosis value of the recorded data.
Additionally, if we want to fatigue an item to the breaking point, we can reach the failure mode more quickly by running the test at a higher kurtosis setting. This technique is valid because the test will apply the same amount of energy to the product, but the higher acceleration values will be present. These large acceleration values will break the product, and because more of them are present in the test than in the Gaussian distribution, the test will fail more quickly.
We can distribute data in ways other than the traditional Gaussian distribution. We should use random kurtosis control when:
- The vibration test needs to be more realistic to real-life situations
- The engineer wants to break a product quickly without using more energy