At the start of 2022, the Vibration Research team set off in nine small groups to test the ObserVR1000 dynamic signal analyzer in real-world applications. The goal was to understand our product better in an operational setting and note any potential improvements. The groups presented their findings to the rest of the VR team. This series relays pertinent (or simply fun) information we found.
Field Data-driven Test Development
ObserVIEW Software: Triggering, STAG
The VR team sent the ObserVR1000 data acquisition device on its first solo flight with the assistance of a high-powered drone. Of course, they didn’t want the ObserVR1000 to have all the fun. Luckily, there was plenty of space at Wallaby Ranch in Orlando, Florida, USA, to fly a drone and hang glide. A plane towed each member up to 2,000ft (610m) in a tandem glider, then released the tug for a 15-minute free fly.
Before take-off, they drew up a plan to measure the response of a drone arm and create a vibration shaker test from the data. The hang glider take-off served as the basis for the drone’s flight path.
Overall Goals
- Analyze recorded drone data in the ObserVIEW software
- Verify the twist/torsional frequency of the drone arm
- Measure the precise motor rotations per minute (RPM) for order analysis
- Create an accelerated STAG test to run on a shaker in the lab
Drone Setup
The team ordered parts to custom build a drone frame and mounted the ObserVR1000 underneath the drone. The main goal of the setup was to collect usable vibration data. It required a powerful enough drone to get the ObserVR1000 off the ground and fly steadily.
They also mounted two accelerometers to one of the drone’s arms. One sensor was on either side of the arm so that the team could measure its twist or rotation with a bit of math.
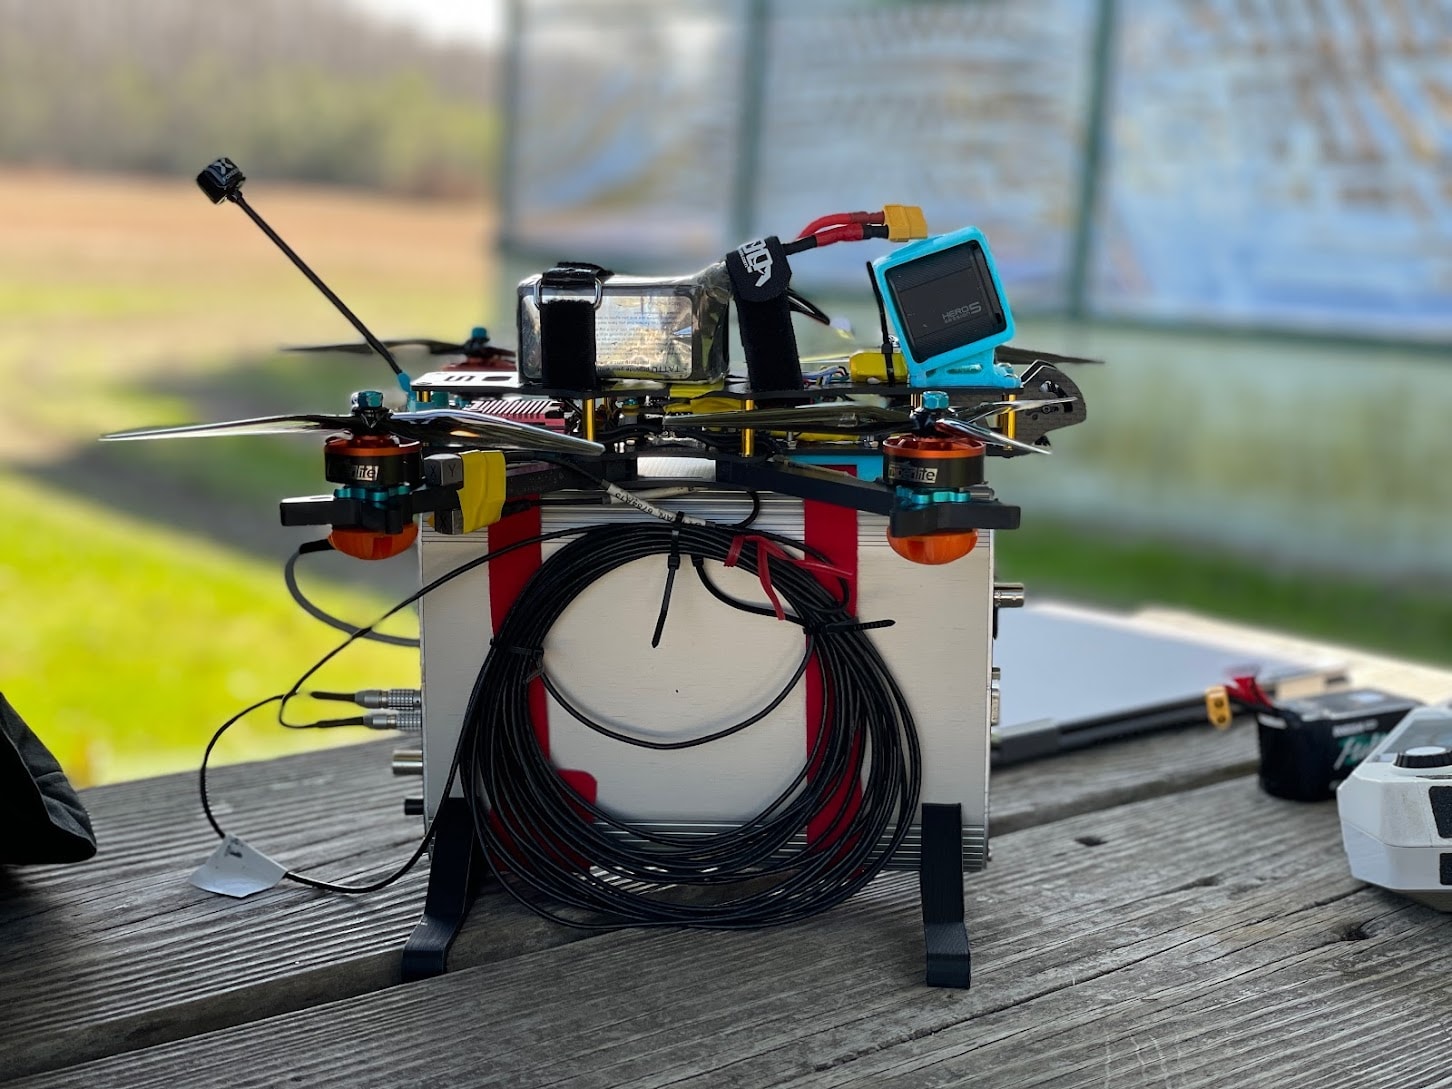
Drone data recording setup.
A tachometer connected to the hardware allowed the team to measure RPM data from one of the motors.
Additional Accessories for Recording
- GoPro
- GPS
- Microphone
Triggering
To take advantage of the ObserVR1000’s full functionality, the team set up triggering with the VR Mobile application. They set a trigger event to start the recording and another to stop it. When the recording stopped, it triggered the system to reset the tachometer readings. The events were handled through a switch on the radio control to make it easier to start/stop recording.
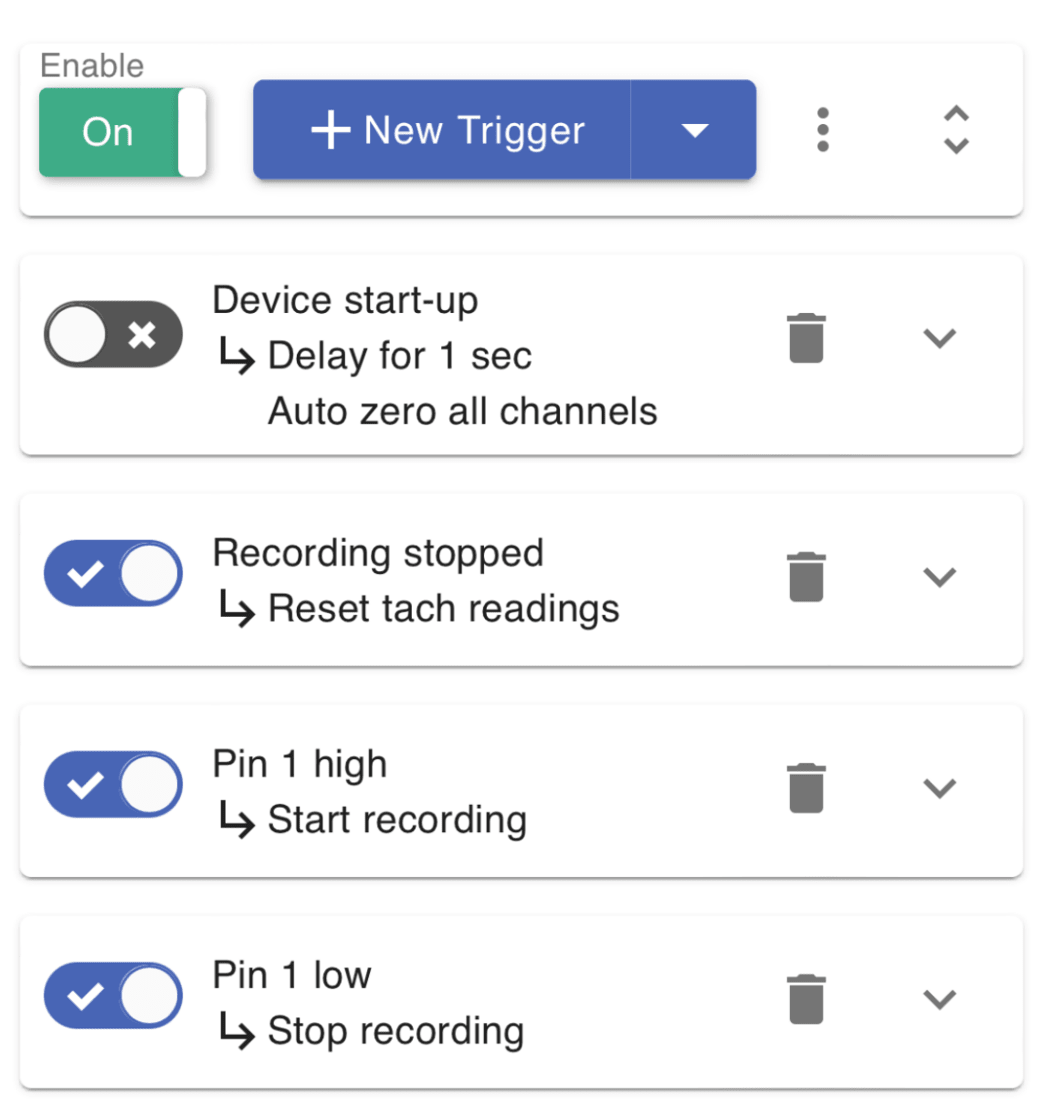
Trigger settings in VR Mobile.
Data Acquisition Flight Path
The drone’s flight path was derived from a hang glider take-off event. The following image shows three camera angles of the reference hang glider. A GoPro captured video from the left wing, and the drone’s camera captured the event as it followed the take-off.
Drone Vibration Analysis in ObserVIEW
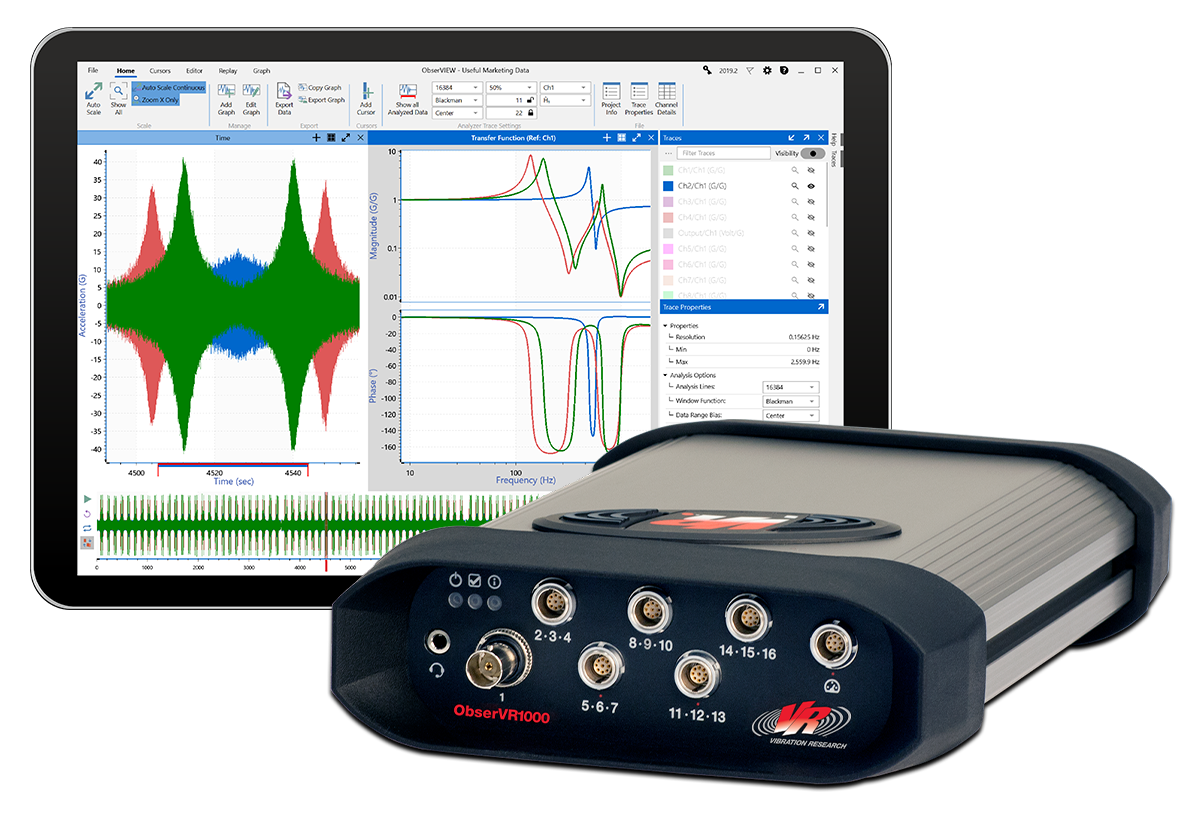
After the team imported the data into the ObserVIEW software, it looked as follows.
The top-left graph shows acceleration versus time, and the one in the middle shows angular position versus time, which came from the torsional arm vibration or arm twist/angle. The bottom left graph is the RPM for motor 1.
Time Spectrogram
There is a clear order at around 500Hz in the time spectrogram. The highest peak is the 3rd order because there are three propeller blades. Once the drone reaches its intended pace, there is a natural vibration frequency at every 3rd order.
The team derived the video’s audio from an accelerometer because there was too much wind noise on the microphone. They used the audio to acceleration converter in ObserVIEW to do so.
Identifying Arm Twist
Drones have different mode shapes at different frequencies. The team contacted the designer for the frame’s mode shapes. In turn, the designer asked for the twist frequency of the arm. (They knew the frequency but sought confirmation.) Most frame designs use one leg per arm, but the drone frame under test (AOS 7) was designed to be stiff in twist.
The twist mode (3rd mode) occurred at ~250Hz. Using the math trace feature in ObserVIEW, the team calculated the arm twist angle with the following equation.
(1) 
The calculation subtracted the acceleration between the two accelerometers and divided the difference by the distance between the sensors. A high-pass filter at 5Hz cleaned up the data. Then, the calculation converted angular acceleration to angle using double integration with an order of 2.
There was rapid movement in the time data at 254Hz. An overlay of the angle’s PSD and the individual accelerometers also displayed a clear peak at 254Hz. Therefore, the twist resonance was determined to be 254Hz.
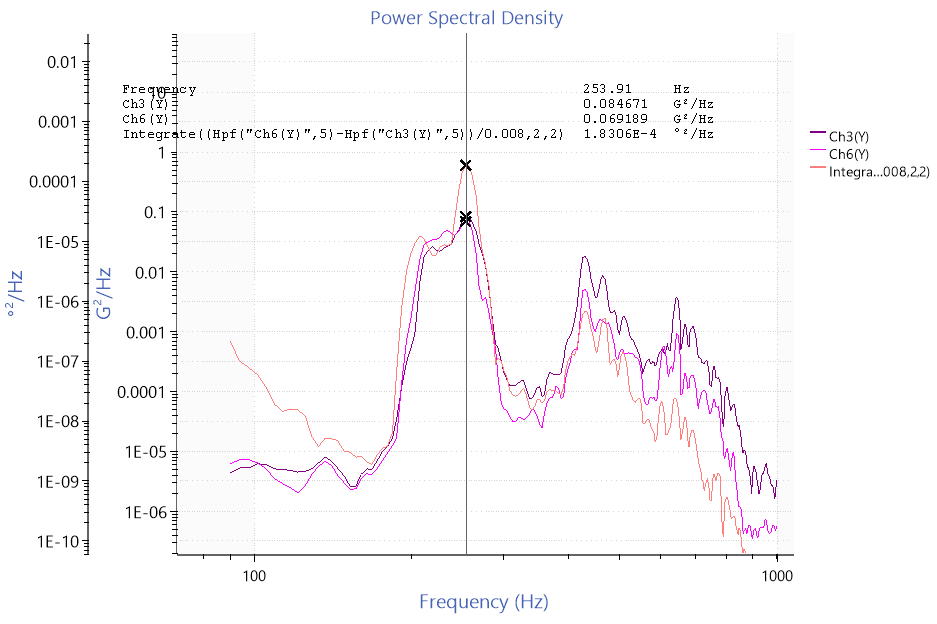
PSD overlay with a clear resonance at 254Hz.
How to Measure RPM for STAG
ObserVIEW’s Sine Tracking, Analysis and Generation (STAG) software requires RPM data from a ramp-up or coast-down. Tachometer data can be noisier than a technician anticipates, so it is helpful to have an alternative method to measure RPM data.
The team’s initial tachometer data was very noisy, so they ran it through an oscilloscope and applied an analog filter. The cleaned-up data made it easier for the tachometer to count the pulses per revolution. Then, the team used VR Mobile’s rotational encoder to measure 7 pulses/rev.
Learn how to address noise in RPM data in the tech note Using Noisy Data in the STAG Software.
Create STAG Test
The drone data had large sine tones from the fast-spinning motors, so a random-only test would not capture the real-life environment. Instead, the team selected the STAG software to create an accelerated sine-on-random test.
However, the data did not have a smooth ramp-up from low to high RPM, as the drone’s blades were spinning at various speeds. This type of data can be difficult for STAG to process.
In this case, the data was too noisy for the software, so the team manually entered the order numbers (rather than automatically with STAG). Even afterward, the sine tone profiles had fast-changing amplitudes, so the team first smoothed them out with an exponential function in Microsoft Excel and then pasted them into the VibrationVIEW test profile. From there, they could run the test on a shaker.
Running the sine-on-random test on an electrodynamic shaker.
Featured Software

Triggering
STAG
ObserVR1000 Recording Checklist
There are a few items to keep in mind when setting up the ObserVR1000 for recording. To make it easy, we’ve compiled a checklist to review before you begin.