Lines of resolution are a hardware feature relevant to random vibration testing. For example, the VibrationVIEW software supports 104,000 lines of resolution. But how does this value relate to generating a test profile and running the test?
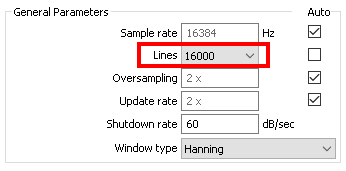
Figure 1. The Lines parameter in VibrationVIEW’s Random Test Settings.
The lines parameter helps define a test’s frequency resolution. A higher resolution makes consecutive frequencies more discernable, which produces more distinct peaks in the resulting graph. However, it takes longer for the controller to process.
Lines of Resolution and Random Testing
During a random vibration test, the controller collects the vibrational response on the shaker table as a function of time. However, random vibration is generally displayed in the frequency domain as a power spectral density (PSD). To generate a PSD, an algorithm combines the response using a spectrum averaging method. The steps of PSD averaging will help explain the function of the lines of resolution parameter in random testing.
PSD Averaging
First, the algorithm divides the time-history data into frames of equal length. Then, it applies the fast Fourier transform (FFT) to each frame to transform the data into the frequency domain.
Along with the sample rate, the lines of resolution determine the width of each frame of time data. A higher lines value creates wider frames—or frames of a longer time, where each has more data.
In Figure 2, the recorded time history was sampled at 8,192Hz and 4,096 lines of resolution. The resulting frame width was one second. If we changed the lines of resolution to 1,024, the frame width would be 0.25 seconds.
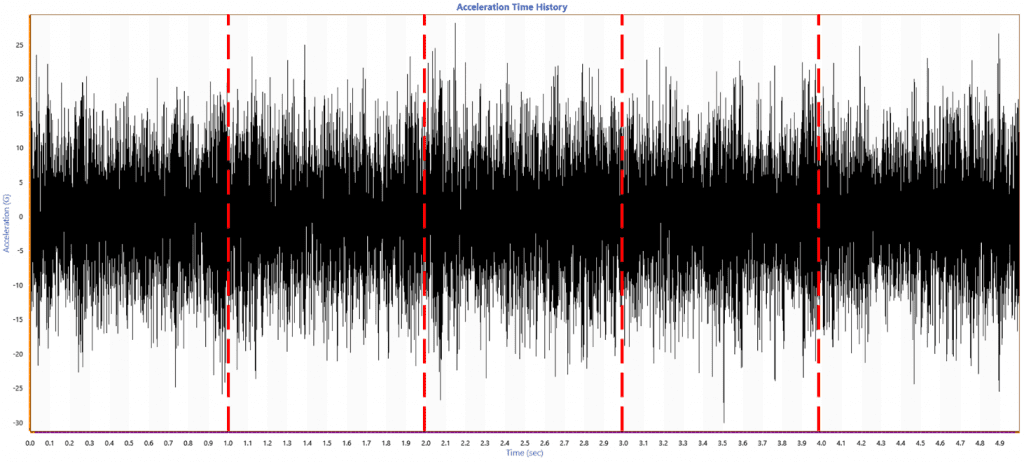
Figure 2. A time-history graph divided into equal frames.
Frequency-domain Data
Next, the algorithm determines the power value of each frame of frequency-domain data (or “frequency bin”) by calculating the squared magnitude of each frequency point. It then calculates the average power spectrum of the frequency bins and divides it by the sample rate to normalize it to a single hertz (Hz). The result is a single PSD for the time-history data.
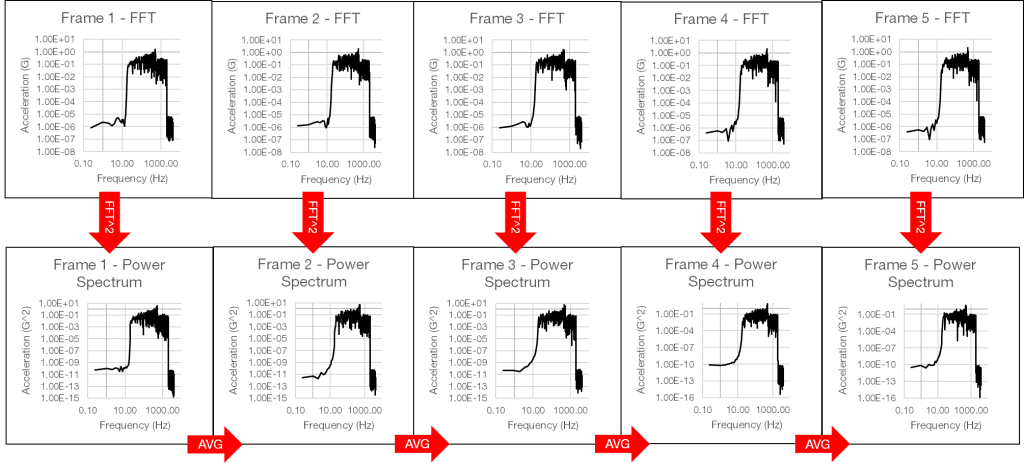
Figure 3. The process of PSD averaging.
After the FFT converts each frame of time data to the frequency domain, the lines affect the resolution of each frequency bin. Higher lines of resolution results in narrower frequency bins, which have a higher resolution than wider bins. There are several advantages to higher lines of resolution in random testing.
Advantage of Higher Lines of Resolution
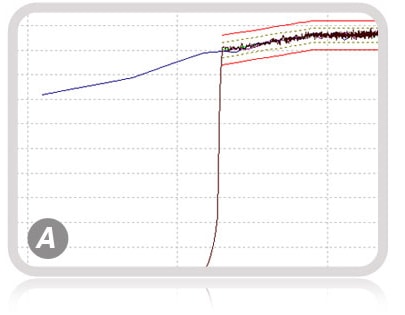
First, higher lines of resolution offer low-frequency control. A limitation of all vibration controllers is the control roll-off, which is approximately 6dB between frequency lines. Control roll-off refers to how quickly the control excitation drops outside the test parameters.
Lower lines of resolution produce frequency bins that are too wide to drop the control excitation quickly. With higher lines of resolution, the control roll-off is much sharper.
As low-frequency energy is near a shaker’s displacement limits, a sharp roll-off requires up to 20% less displacement from the shaker. Graph A illustrates the difference in roll-off between the blue trace at 400 lines and the red trace at 26,000 lines.
Control of Resonances
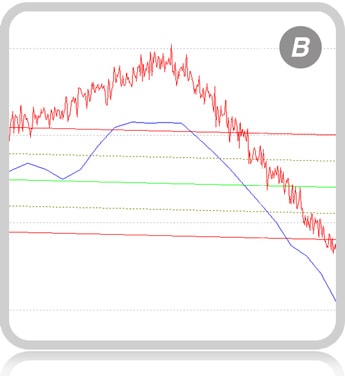
Secondly, a test with higher lines of resolution offers better control of sharp resonances. For the most accurate control/excitation of resonances, a minimum of three resolution bins should exist at the 3dB frequency bandwidth of the resonance.
Graph B illustrates the difference in control between the blue trace at 400 lines and the red one at 26,000 lines. Note the difference in the resonance peaks between the two resolutions.
Learn more: How to adjust random lines of resolution in VibrationVIEW.
Conclusion
Vibration controllers can control a closed-loop test to a certain number of lines of resolution. Increasing the number of lines allows better control of low frequencies and sharp resonances but makes the controller start and respond more slowly to changing system dynamics.
If you’re interested in learning more about vibration controller features, we suggest reading What to Look For in a Replacement Vibration Controller.