VibrationVIEW’s Demonstration mode is a valuable tool that engineers can use to set up and design tests before running them on a shaker. With this simulation option, they can view and playback data files and display the real-time velocity and displacement values from acceleration measurements. They can also review shaker environments and sensor values to predict how a test will run. The features of the Demonstration mode are detailed below.
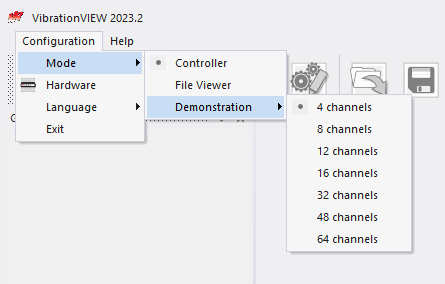
To access Demonstration mode, select Configuration > Mode > Demonstration. Select the number of channels you want to simulate. Then, point to Select Network Card and select Demonstration Mode.
Test Setup and Design
Firstly, engineers can use the Demonstration mode to set up and design a vibration test. The engineer can design and run the test to determine the validity of the test setup. This feature is particularly beneficial when a lab has a designated computer for product testing with the VibrationVIEW software. While a test is running in VibrationVIEW, the engineer can design/set up other tests in the software.
This feature increases productivity because engineers can design and save test profiles for upcoming tests without disturbing the current test. They can also open a test and adjust the test settings according to the test specifications (Figure 1). The profile, test schedule, and other parameters and limits can be adjusted in Demonstration mode.
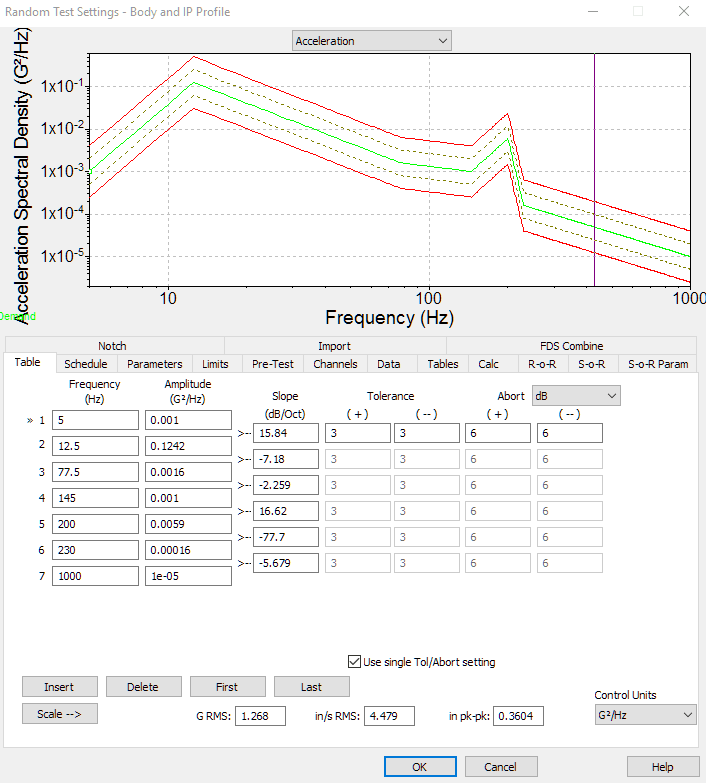
Figure 1: Random test settings edited in Demonstration mode.
Secondly, engineers can adjust the inputs, shaker limits, and other parameters to simulate how the test will run in the lab (Figure 2).
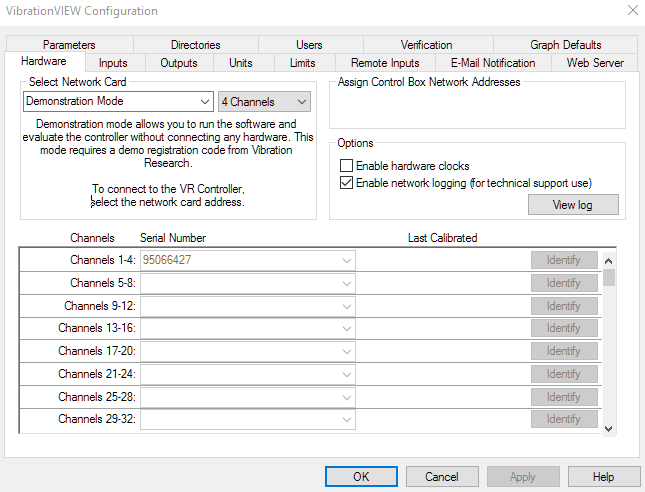
Figure 2: Global Configuration in Demonstration mode. Adjust parameters including shaker limits, input sensitivity, and system limits.
Viewing Data Files
With Demonstration mode, test labs can send authentic data files to their customers for inspection before running the test. The customer can open the data files in the VibrationVIEW’s Demonstration mode to analyze the data (Figure 3).
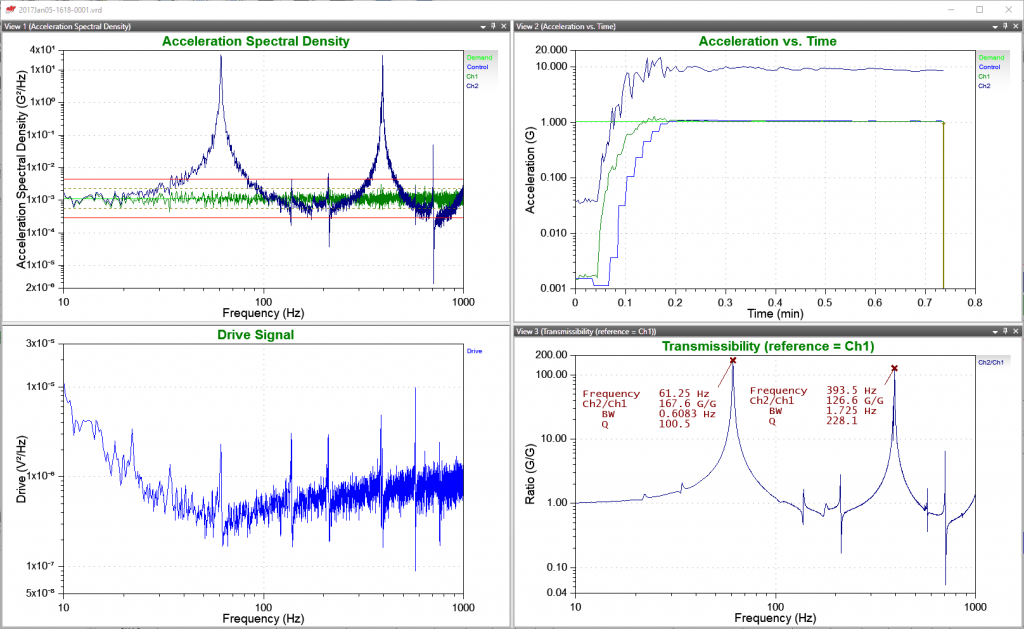
Figure 3: A data file opened in Demonstration mode. Engineers can view the data from different perspectives and perform analysis as necessary.
This feature eliminates the need for recreating reports with various data sets and graphs based on the customer’s request. With an actual data file, the customer can gather most, if not all, of the necessary information.
In addition, engineers can view the files away from the testing facility and/or share the data within a department. Anyone can view and analyze the data in Demonstration mode.
Playback Field Data and Display Real-Time Values
One of the significant features of the Demonstration mode is the ability to playback field data and display real-time velocity and displacement values. Accessing this option requires several steps.
Setting up VibrationVIEW to Display Real-Time Velocity and Displacement Values
To display the velocity and displacement values from an acceleration measurement, the VibrationVIEW programming code must be adjusted. Don’t worry—this task is fairly simple!
- First, run Notepad or another text editor as an Administrator. To do so, right-click on the text editing software and click Run as administrator (Figure 4).
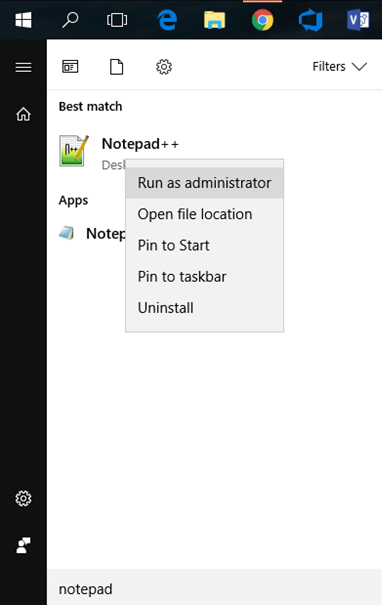
Figure 4: Opening Notepad as an Administrator.
- Select File > Open > All Files. Locate the file titled “Shaker.ini” in C:Program FilesVibrationVIEW 2017shaker.ini and open the file. The Shaker.ini file with the [Simulation] and [Filter*] sections will appear (Figure 5).
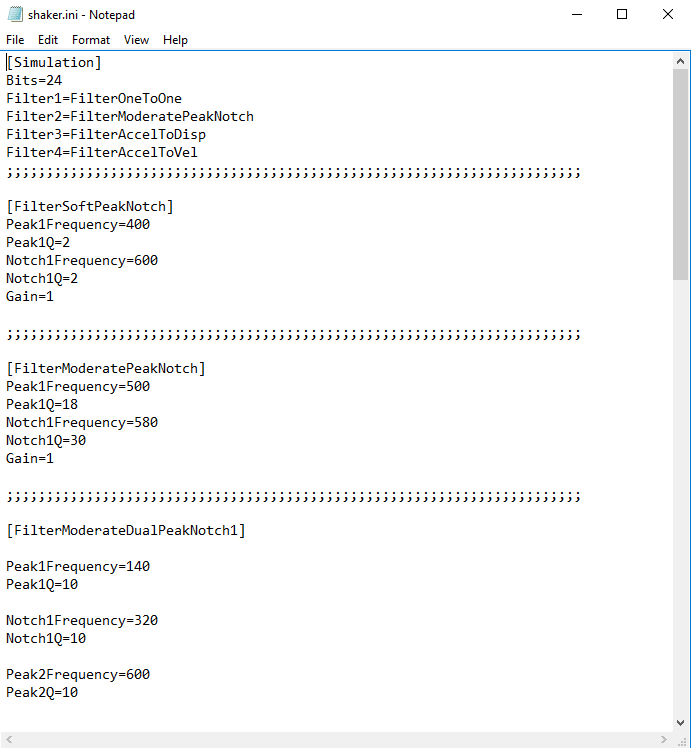
Figure 5: Shaker.ini file consisting of Simulation and Filter* sections.
The [Simulation] section selects the simulation models for each input channel and the global configurations. The [Filter*] section includes the characteristics that can be used with any input channel. When initially installed, the [Simulation] section looks like the following:
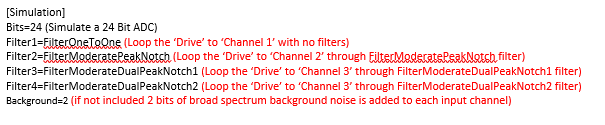
- To display the displacement and velocity plots calculated from the acceleration measurement, adjust the [Simulation] section as follows:
- Adjust the VibrationVIEW software configuration senitivities for Channel 2 (displacement) and Channel 3 (velocity) to 1000 mV/in and 100 mV/in/s, respectively (Figure 6).
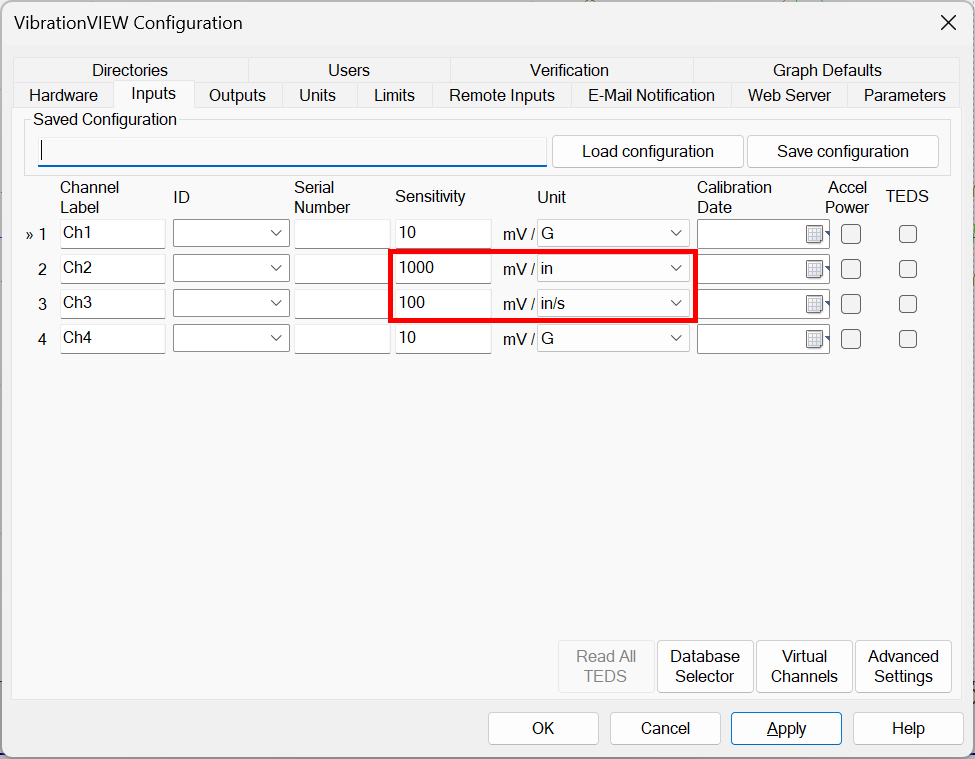
Figure 6: Adjust the input sensitivities for Ch2 and Ch3 in VibrationVIEW.
-
- Use the configuration values found in the Shaker.ini [Format] section for the displacement calculation from acceleration and for the velocity calculation from acceleration. As explained in Figure 7, the values should be 1000 mV/in and 100 mV/in/s, respectively.
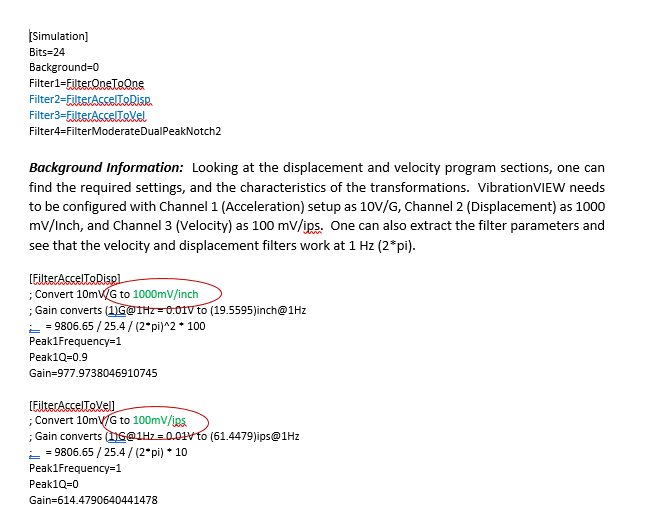
Figure 7: Configuration values in the Shaker.ini [Format] section.
- When the setup process is complete, you can import a recorded data file into the Field Data Replication software in Demonstration mode. From there, you can generate graphs to show the displacement and velocity waveforms calculated from the acceleration measurements in the original recorded file. To do so, complete the following steps:
-
- Open the Field Data Replication (FDR) software module and import a recorded file (Figures 7, 8).
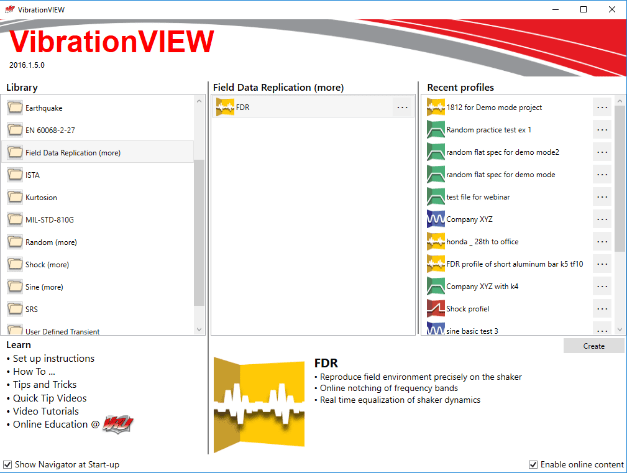
Figure 7: Creating a new Field Data Replication (FDR) test.
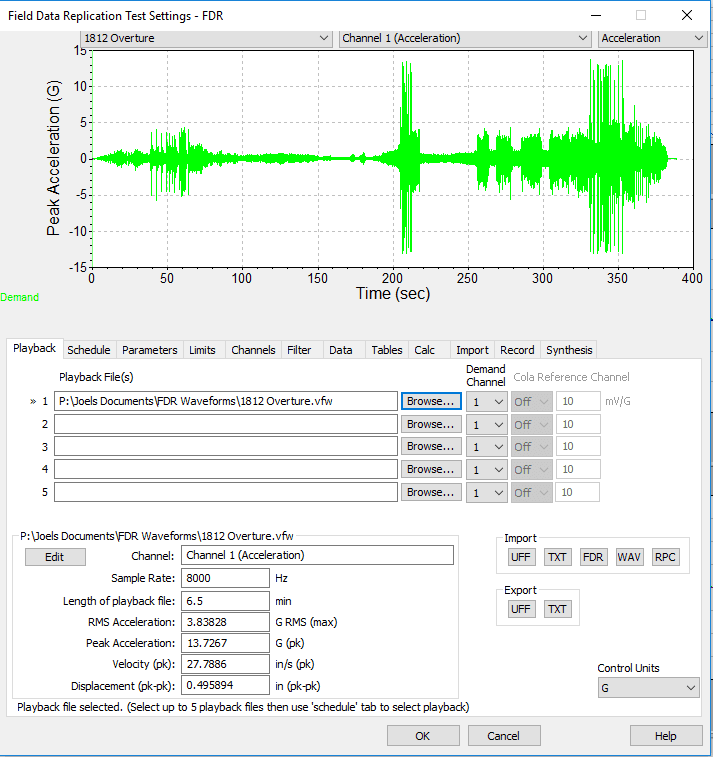
Figure 8: Importing a recorded file; in this case, Tchaikovsky’s “1812 Overture.”
-
- Click Edit Graphs and create an acceleration waveform graph for displacement (Ch.2) and velocity (Ch.3) (Figures 9, 10). This action will produce a waveform of displacement because the [Simulation] programming is set for the double integration of the acceleration data to produce a displacement plot.
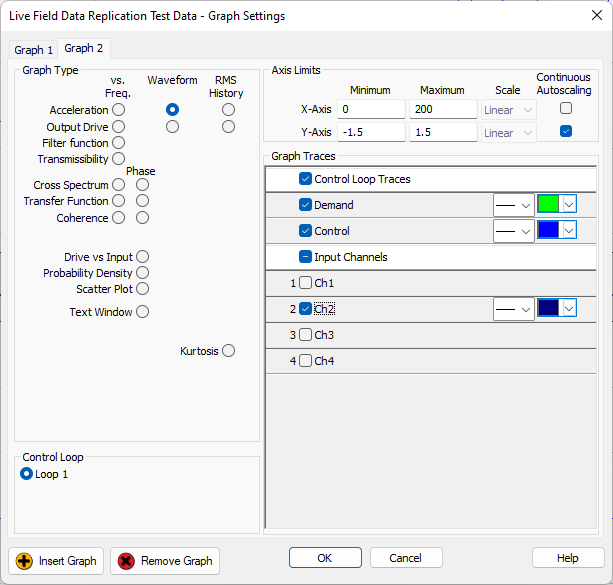
Figure 9: Adding an acceleration waveform graph for Channel 2.
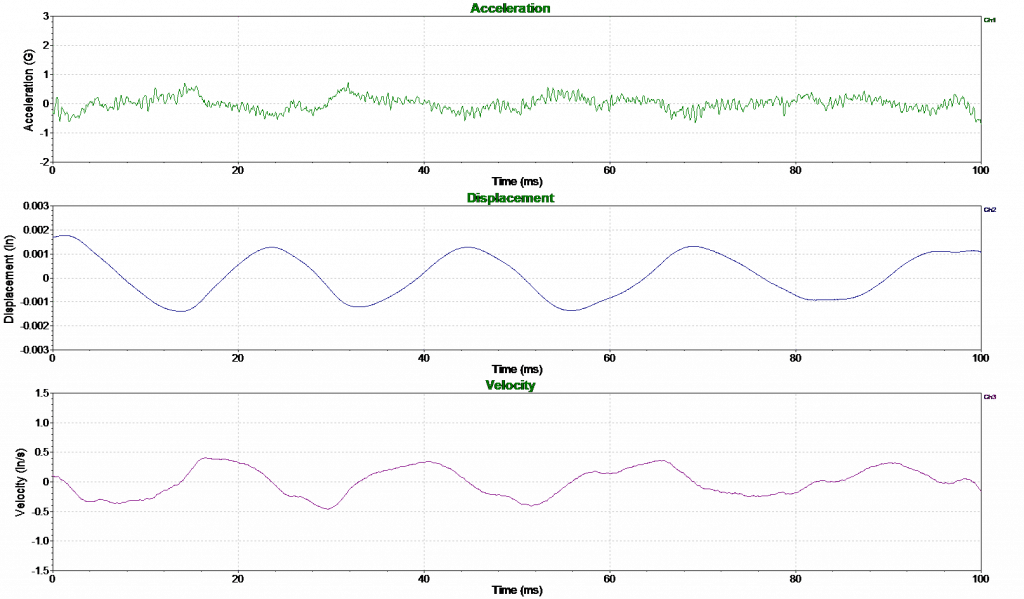
Figure 10: acceleration waveform graphs for Ch1 (acceleration waveform), Ch2 (displacement waveform), and Ch3 (velocity waveform).
With this feature, test engineers can design the Simulation program to plot the displacement and velocity graphs that are generated by the integration of the recorded acceleration measurements. Not only can engineers playback recorded files in Demonstration mode, but they can also see the displacement and velocity values they should expect if they run the test in the laboratory.
Simulating Shaker Environments
In Demonstration mode, users can also run a simulated shaker with user-defined characteristics. This allows the user to predict how a test will run in different environments.
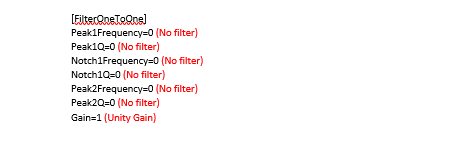
The simulation requires the tweaking of the [Filter] scripts in the Shaker.ini file. Each filter is defined as a section in the Shaker.ini file. For example, the simplest filter defined is Filter One to One (see image below).
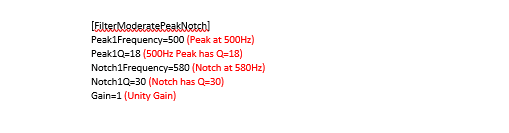
As displayed in the image below, the Filter Moderate Peak Notch is more complex.
More advanced filters can be selected from the file. Additionally, users can make new filters with different characteristics for gains and peaks to change the high pass filter. Consider the following image.

Conclusion
VibrationVIEW Demonstration mode is a helpful tool that saves costs and increases productivity. With Demonstration mode, test engineers can:
- Set up and save test profiles
- Open data files and analyze the results of test data
- Playback recordings and tweak the Simulation software to integrate acceleration data to obtain the velocity and displacement waveforms
- Adjust the Simulation software according to user-defined characteristics
If you are new to the VibrationVIEW software, you can download a free demo here. Access free laboratory exercises in Demonstration mode by visiting the VibrationVIEW Syllabus course.