At the start of 2022, the Vibration Research team set off in nine small groups to test the ObserVR1000 dynamic signal analyzer in real-world applications. The goal was to understand our product better in an operational setting and note any potential improvements. The groups presented their findings to the rest of the VR team. This series relays pertinent (or simply fun) information we found.
Cart Path vs. Golf Course: Which is the Fairer Way?
ObserVIEW Software: Waveform Editor, Multimedia Sync, FDS
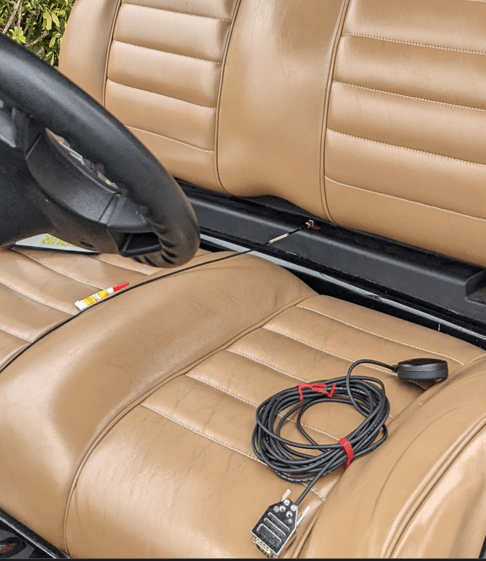
Triaxial accelerometer mounted to the cart seat.
Group 5 took to the fairway to analyze the vibration of golf carts. At the start, they considered two aspects of the cart’s vibration: first, the effect on passengers when they ride on the cart, and second, the fatigue damage that the cart incurs over its warranty. They sought to determine the most damaging route for a golf cart: the path or the course.
Recording Setup
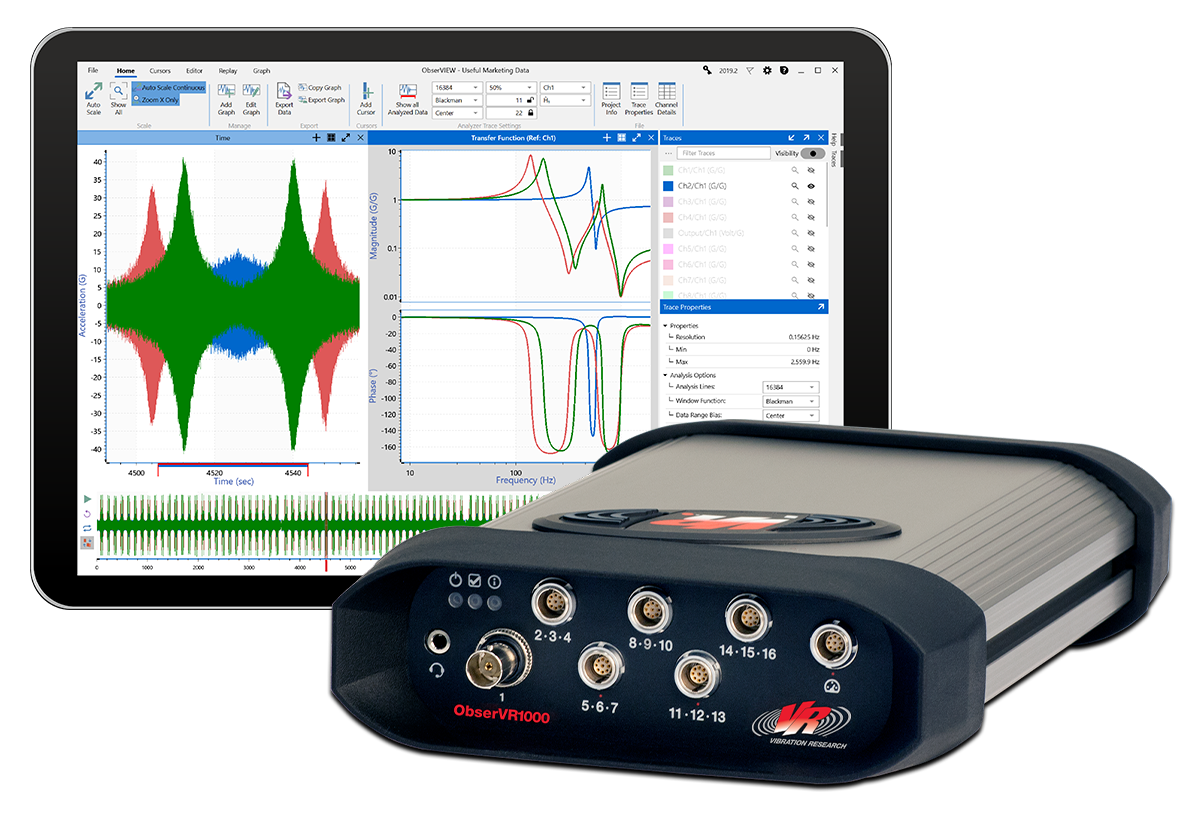
The team drove two carts with the same recording setup. They attached two sensors to each cart: a triaxial accelerometer was on the seat, and a single-axis accelerometer was on the cup holder tray. A triaxial accelerometer captures vibration in the three linear directions, which is more representative of the passenger’s experience. There were also a GPS and GoPro on each of the carts.
The group’s mounting method was superglue, but the plastic was too cold for the accelerometers to adhere to the material. Instead, the group put tape down first, then superglued the sensors to the tape.
The team split up and set off for a game: one took the cart path, and the other drove on the fairway. They noted the condition of the course and the weather conditions, understanding the effect of these factors.
Warranty Period
After recording, the group concluded that the data would be most beneficial to third-party manufacturers of golf cart accessories/parts. For example, speaker manufacturers may want to test their product using a field recording before it is attached to the cart.
Electric and gas club carts have different warranties; both the team’s carts were electric, and the warranty is as follows:
| 4-year | Batteries (20,000 – 25,000 amp hours, dependent on deionizer and filter system), canopy, electronics, pedal group, standard seats, suspension |
| 3-year | Body panels, electric powertrain, premium seats |
| 2-year | All remaining components |
| Lifetime | Frame |
All unlisted components have a 2-year warranty (about 17,520 hours). The team used this value as a target lifetime for additional components.
Golf Course Analysis
Cart Path: The highest acceleration in the time waveform was about 16G. There were higher points in the waveform due to the sensor falling off the cart, but the group removed the erroneous peaks using the time waveform editor in the ObserVIEW software. The GPS data confirms that they did not deviate from the cart path.
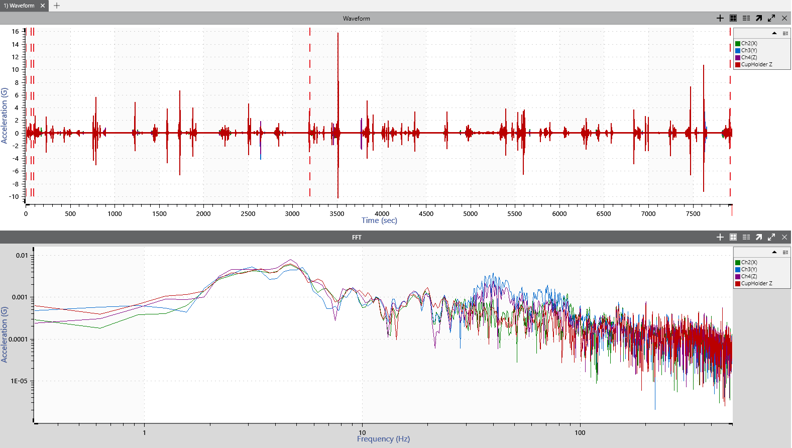
Time and frequency waveform recordings of the golf cart on the cart path.
Golf Course: The peaks in the time waveform are similar to those of the cart path data. In both cases, the highest peaks are from the sensor near the cup holder. There are also several transient peaks at the end of the recording.
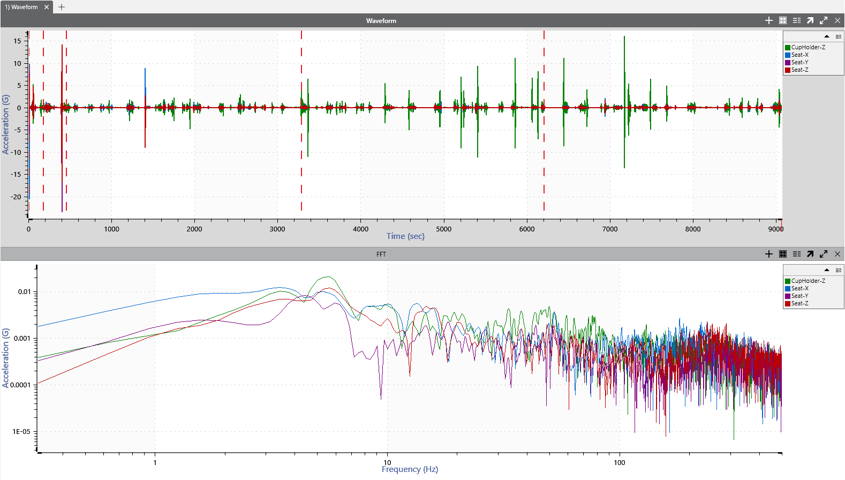
Time and frequency waveform recordings of the golf cart on the golf course.
Comparison
Group 5 generated an FDS test spectrum for the x and y-axis data from both carts for comparison. The target lifetime was 17,520hrs, and the significant data fell between 3 to 500Hz. The behavior was similar across the frequency range.
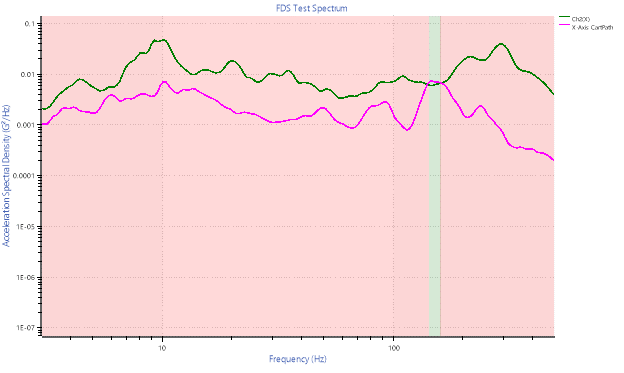
FDS test spectrum (x-axes).
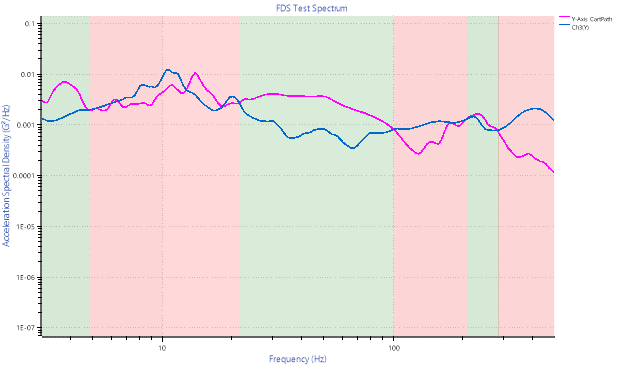
FDS test spectrum (y-axes).
However, the z-axis data had significant differences. The cart on the path incurred more damage, especially at lower frequencies (0 to 10Hz). The group hypothesized that the cool winter months affected the concrete path, especially at the expansion joints.
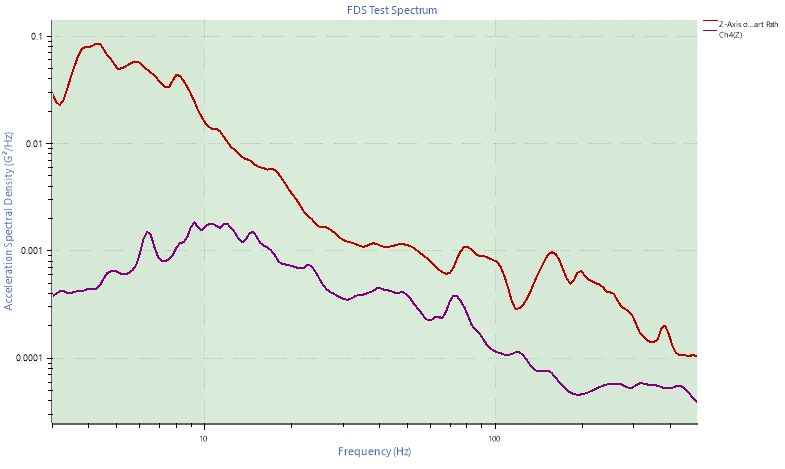
FDS test spectrum (z-axes).
Conclusion
From the recordings, Group 5 concluded:
- Horizontal damage is similar regardless of the driving path
- Vertical damage is greater in the cart path data, likely due to the concrete being harsher than the golf course; the expansion joints on the cart path also played a role
- The difference in damage is most significant at the low frequencies
- A more accurate test would include data from multiple golf courses around the country
- Gas-powered golf carts would introduce more noise that the manufacturer would need to account for
Cup Holder Analysis
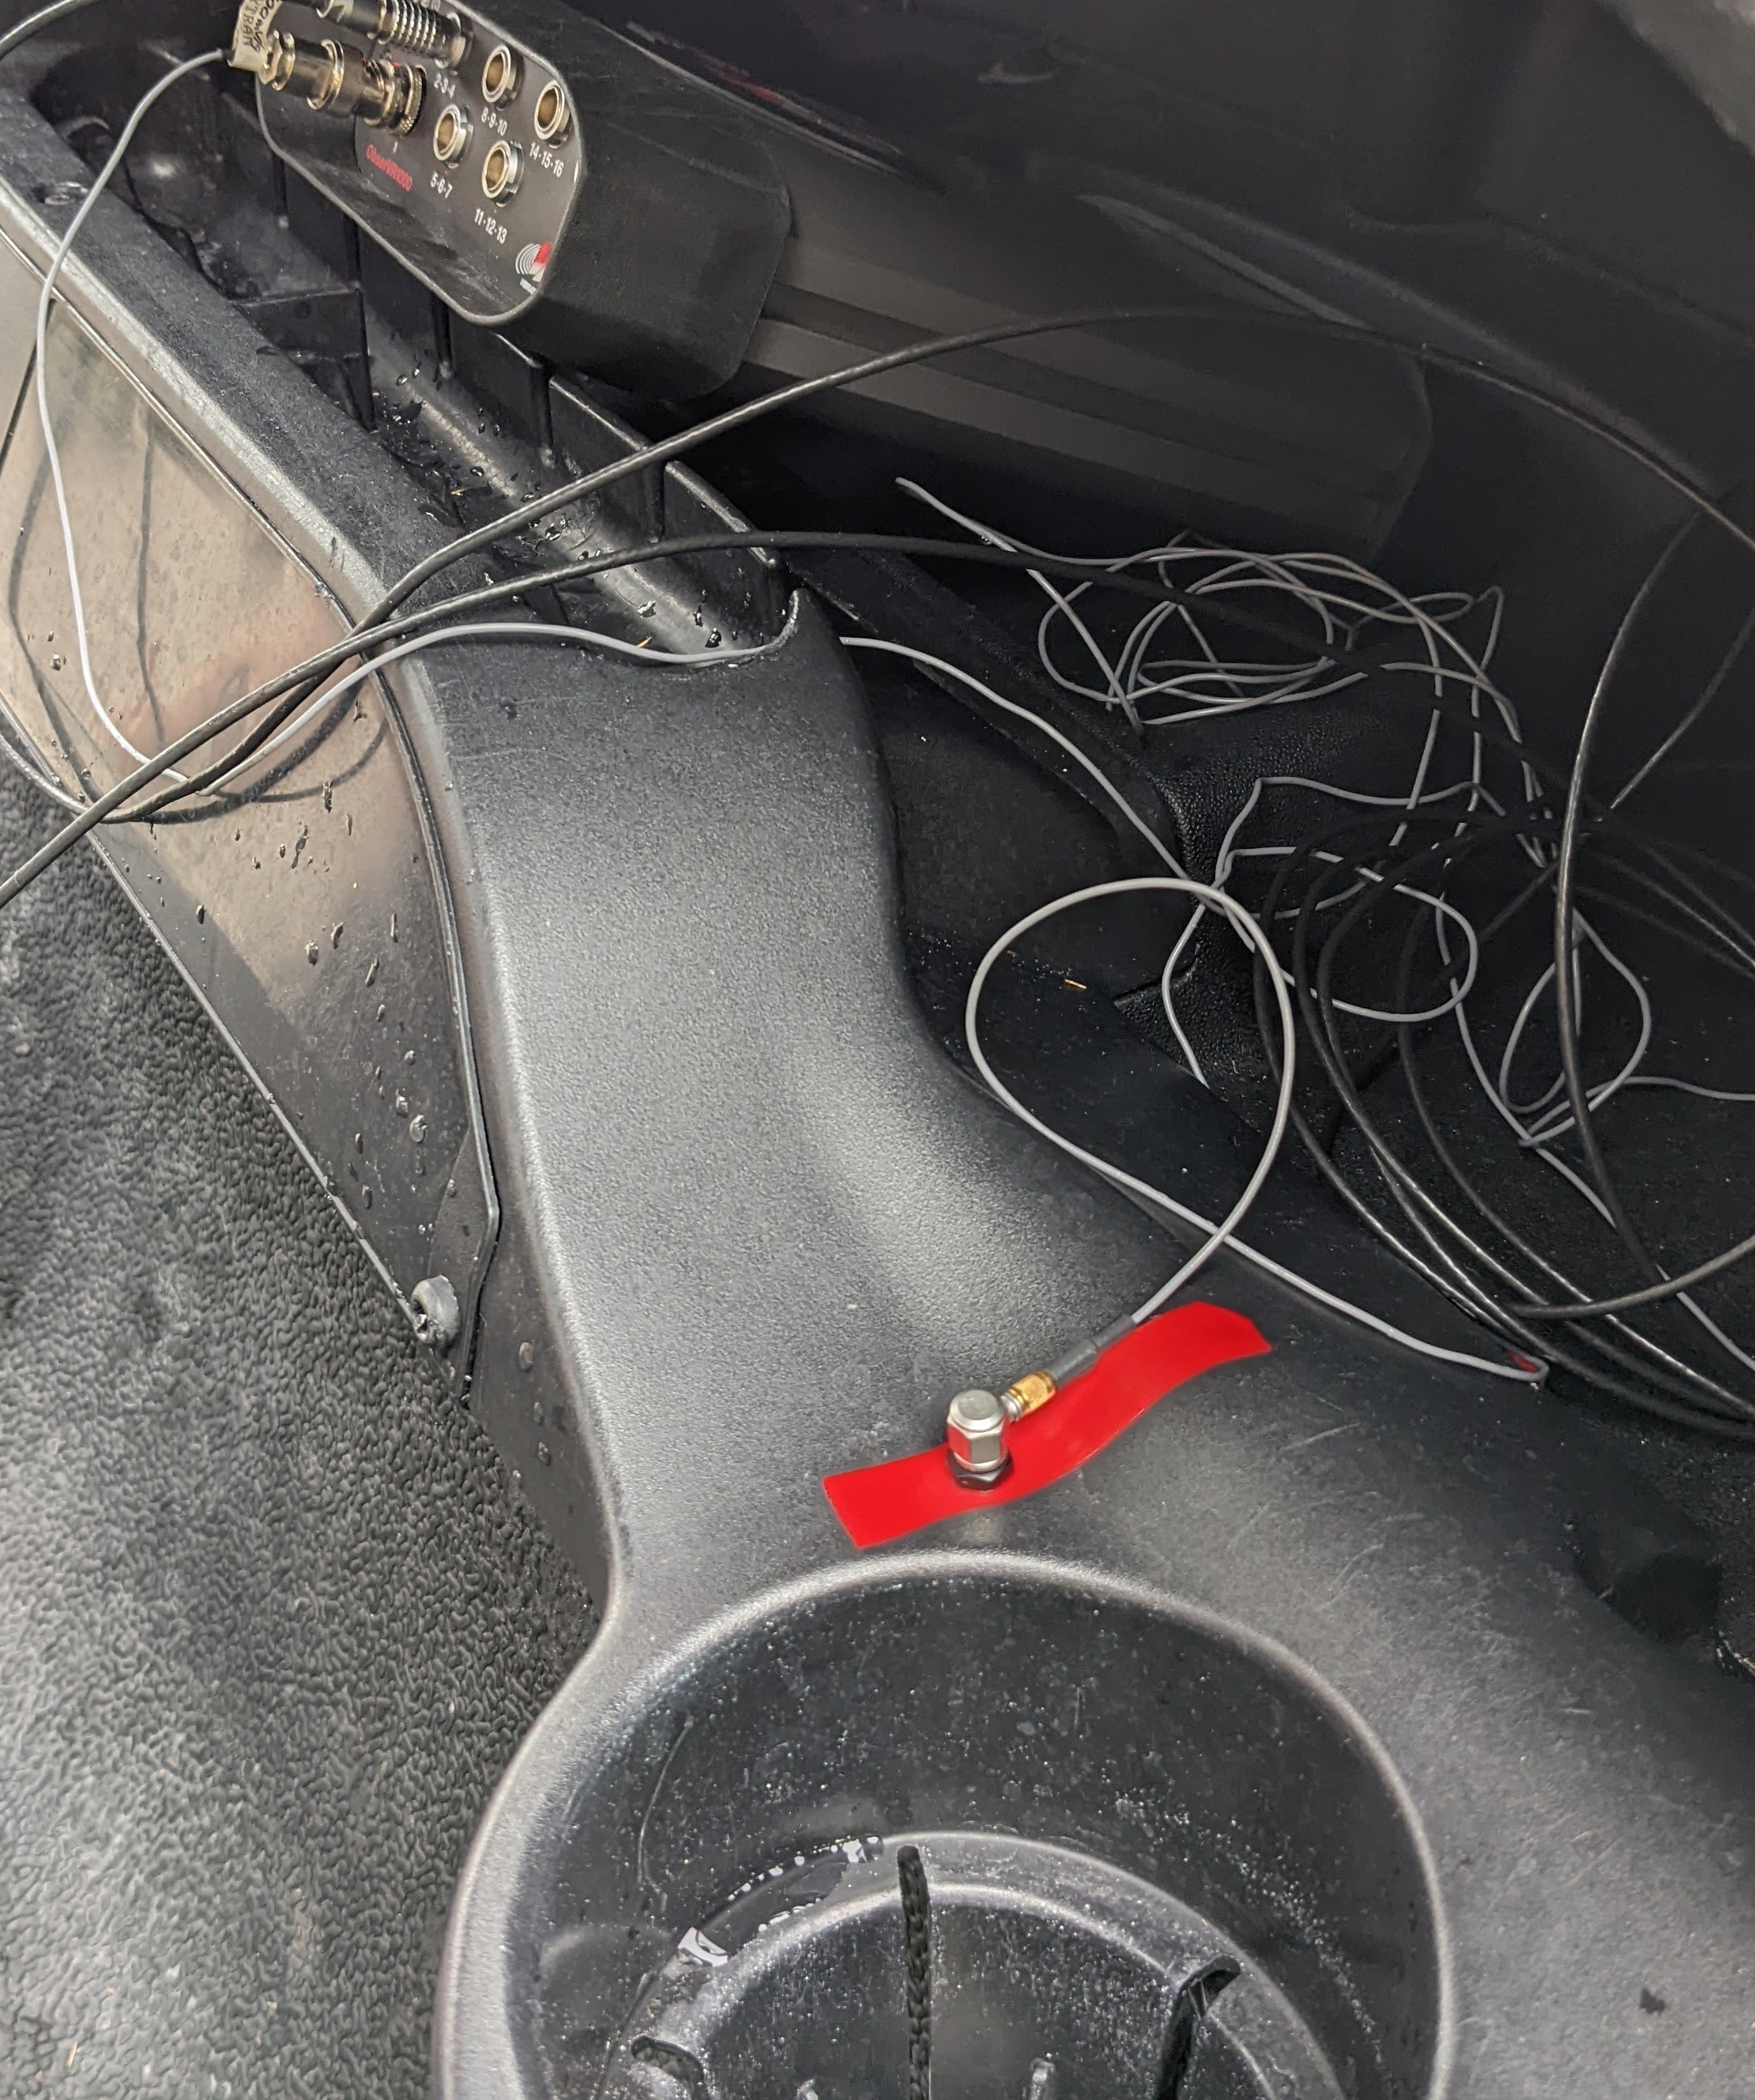
Single-axis accelerometer mounted to the cup holder tray.
A cup holder’s response to vibration can be (and is often) severe enough to spill the drink it is holding. Group 5 analyzed the recorded data to note any potential issues or solutions.
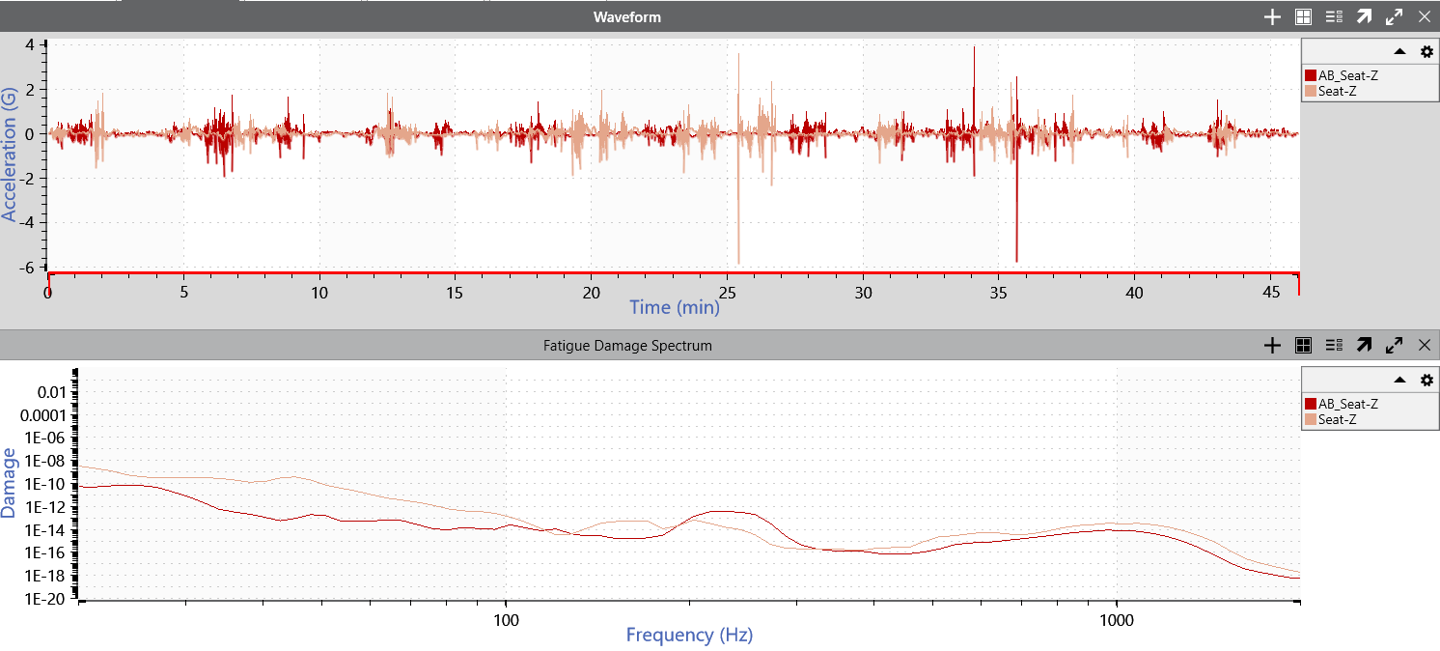
First, the group compared the seat’s vibration on the z-axis to the cup holder’s z-axis recording. The seat was rigidly fixed to the frame, while the cup holder was attached on one side.
The data were compared before drinks were added to the cup holder, and the recordings were similar. After a beverage was added, however, the cup holder’s response displayed more acceleration peaks.
An analysis of the crest factor also shows the difference in the data when the cup holder is in use.
(1) 
| Before beverage (z-axis) | After beverage (z-axis) | |
| Crest factor | 90.3 | 914 |
Still, the team wanted to ensure that there wasn’t any significant difference in the route before and after they added a drink to the cup holder. The seat data before and after did not differ significantly; in fact, the data before the beverage had slightly greater acceleration levels. Therefore, they could confirm that the path did not affect the variation in the cup holder data.
Comparison of routes before and after the beverage was added to the cup holder.
Comparison
Adding a beverage to the cup holder led to higher frequency content. Group 5 was reminded that it is important to consider all inputs and simulate them during data recording. If the team did not use the cup holder, the results would have been very different: the difference in cup holder vibration would be consistent for the time. The shocks from the system were not nearly as influential as adding a beverage to the cup holder.
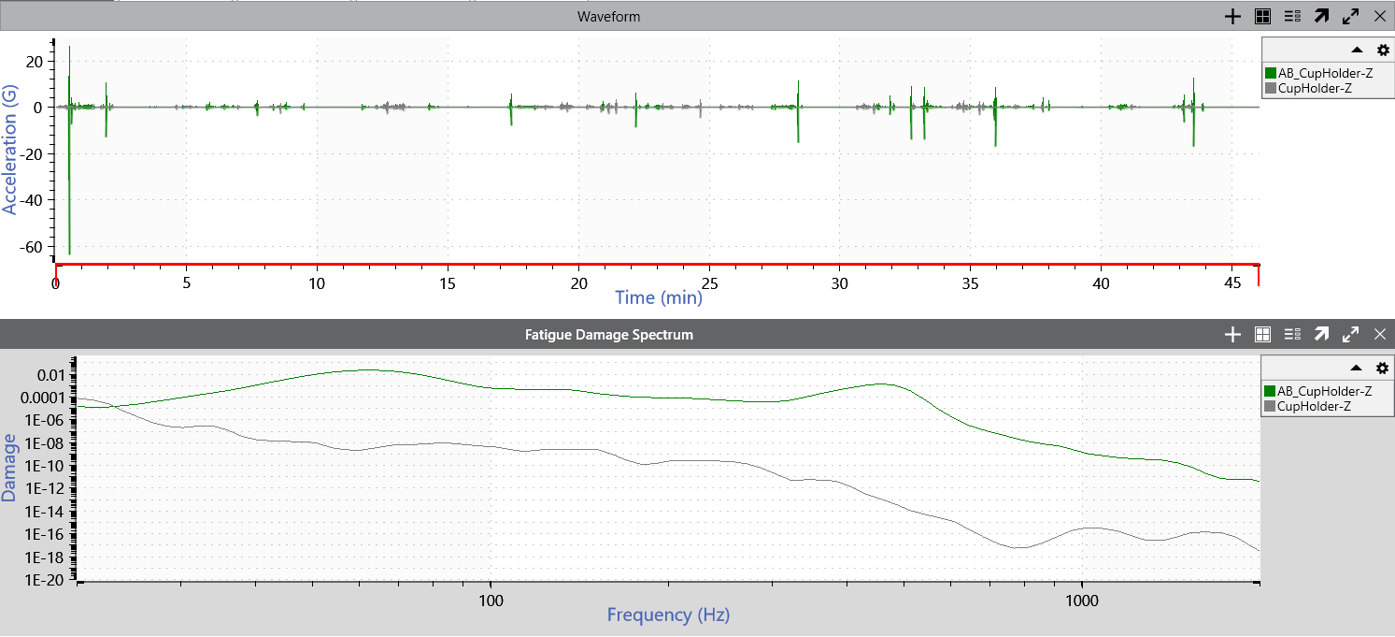
Fatigue damage spectrum of the cup holder before and after beverage was added.
Featured Software
Waveform Editor
Multimedia Sync

FDS
ObserVR1000 Recording Checklist
There are a few items to keep in mind when setting up the ObserVR1000 for recording. To make it easy, we’ve compiled a checklist to review before you begin.