At the start of 2022, the Vibration Research team set off in nine small groups to test the ObserVR1000 dynamic signal analyzer in real-world applications. The goal was to understand our product better in an operational setting and note any potential improvements. The groups presented their findings to the rest of the VR team. This series relays pertinent (or simply fun) information we found.
Helicopter Data Comparison: Is MIL-STD Severe Enough?
ObserVIEW Software: Multimedia Sync, STAG, FDS
Group 2 aimed to compare recorded data from two helicopters of the same manufacturer: the Robinson R22 and R44. The R22 is a smaller aircraft with two seats; the R44 has four seats.
The group installed an ObserVR1000 in both helicopters along with a GoPro, GPS, headset microphone, cabin microphone, and triaxial accelerometer. The cabin microphone picked up noise inside the cabin, and the group used the other to hear the pilot and tower communications.
The group was careful to mount the accelerometers to an equivalent location on both aircraft. The x-axis measured the horizontal direction, the y-axis measured the lateral, and the z-axis measured the vertical.
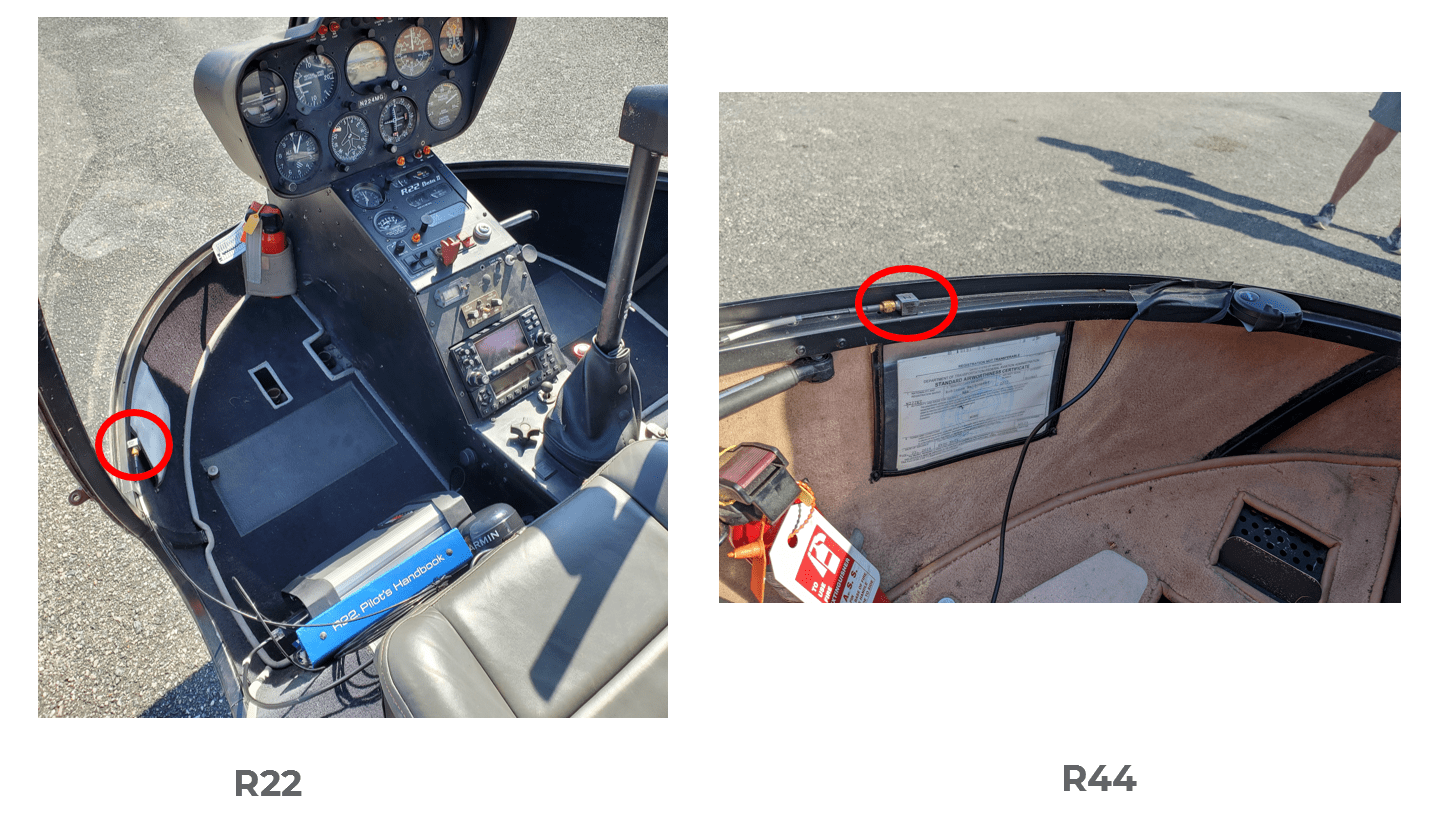
Accelerometer locations on the aircraft.
Data Playback
The following is a playback of the data with synchronized GPS, video, and recording data.
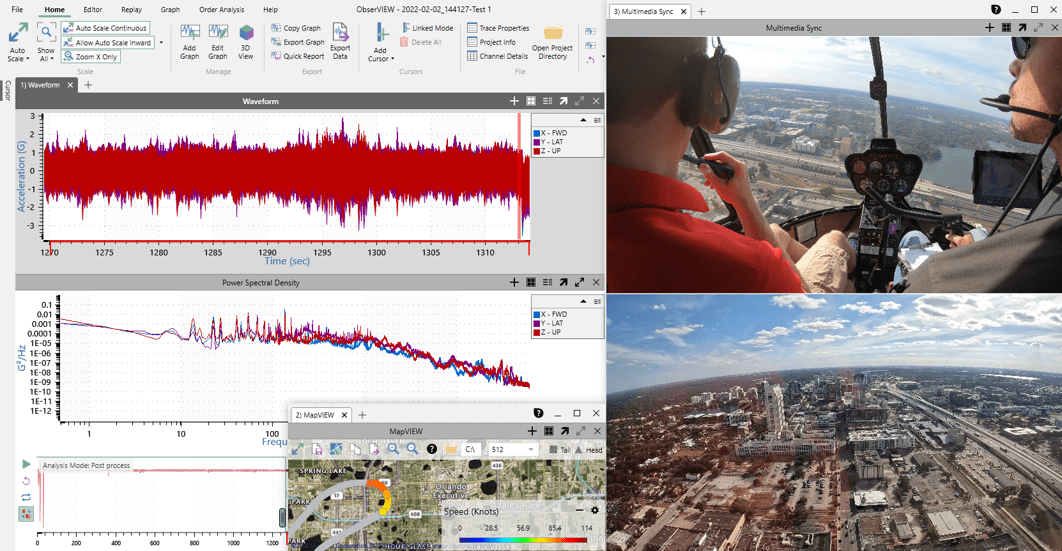
Synchronized multimedia.
Which Helicopter Had Higher Vibration Levels?
The lateral (y) axis of the R22 had significantly higher acceleration levels in the time domain than the other two measurement directions. In the frequency domain, the y-axis acceleration largely accounted for the energy spike around 200Hz.
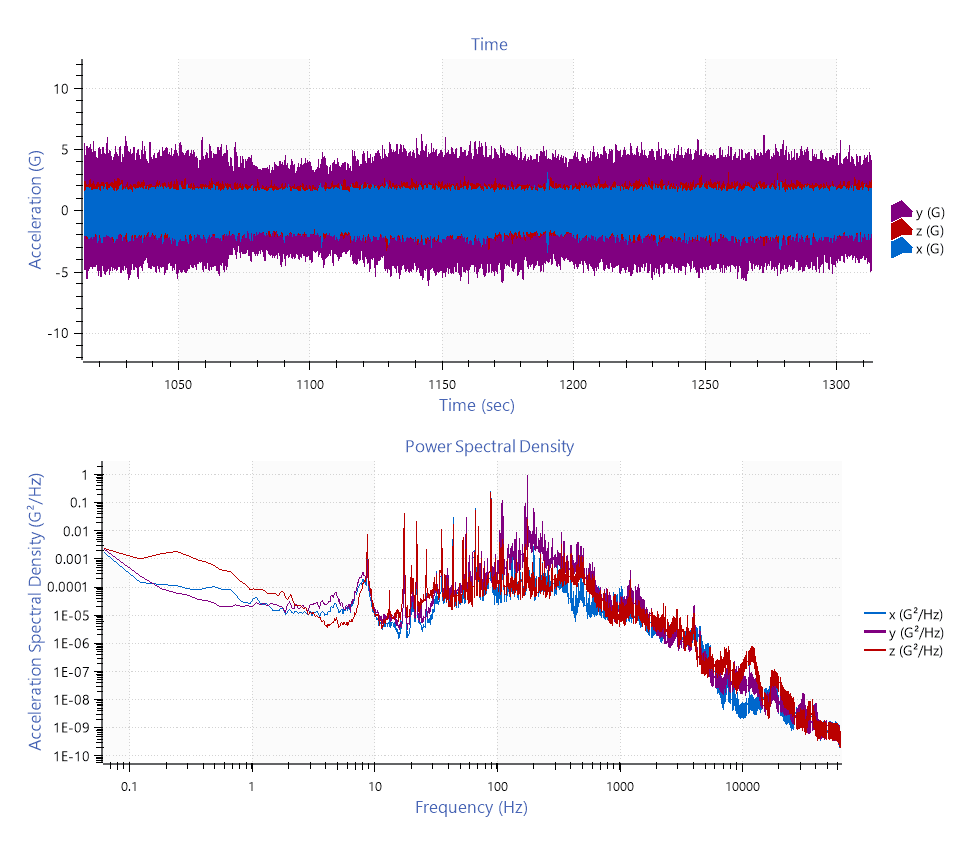
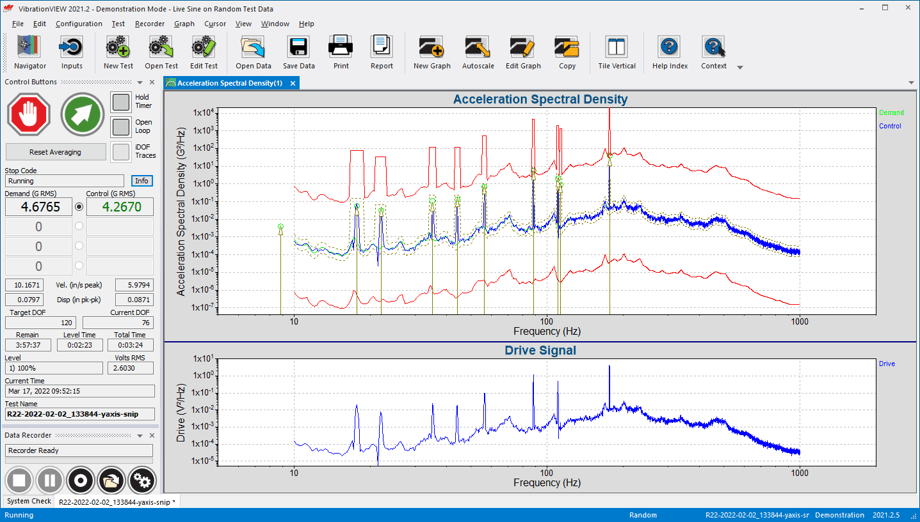
Time and frequency response of the R22.
The time-domain data of R44 was more balanced between the three axes. However, there was also a spike in the y-axis around 200Hz in the frequency domain.
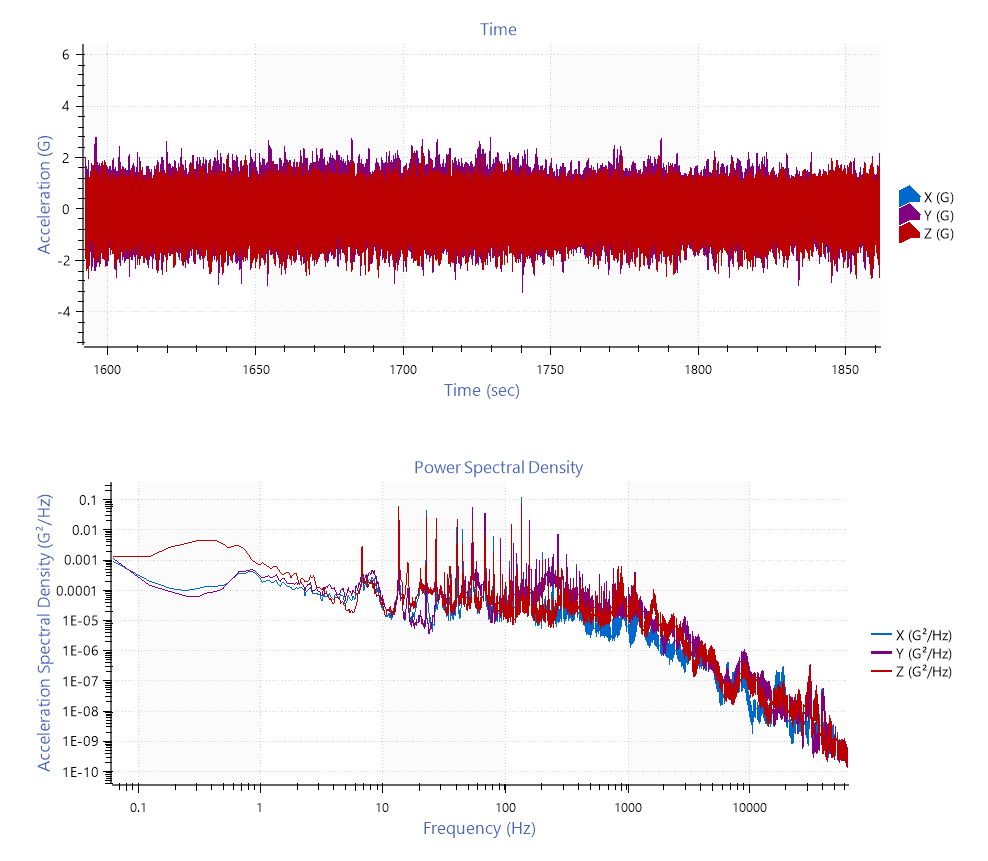
Time and frequency response of the R44.
The group compared the helicopters’ lateral accelerations, as the y-axis was the most severe for both. The R22 energy was greater than the R44 because the spikes in the data drove the energy levels up.
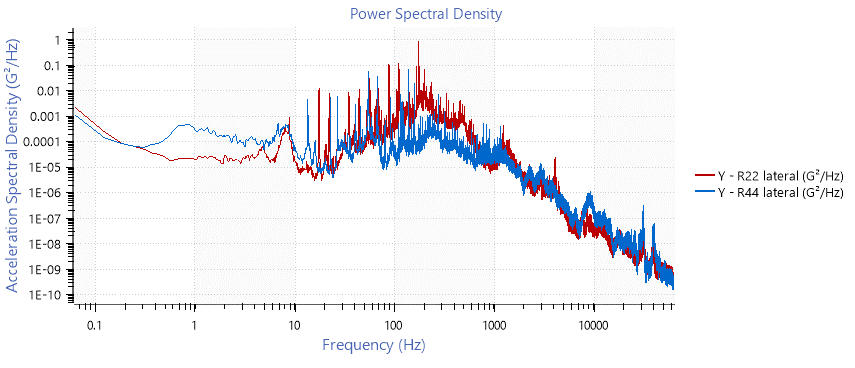
Comparison of y-axis responses.
Additionally, the R22’s RMS values were higher in all axes, specifically in the lateral direction.
| R22 | R44 | |
| X (Forward) | 0.508 GRMS | 0.298 GRMS |
| Y (Lateral) | 1.457 GRMS | 0.405 GRMS |
| Z (Up) | 0.625 GRMS | 0.333 GRMS |
Group 2 did not anticipate higher energy levels in the lateral direction. They suspect that the opposed-piston engine—which runs in the lateral direction—accounted for the energy levels in the y-axis.
Comparison to MIL-STD
The group then posed a question: what purpose would the collected data serve?
As an example, imagine a component like an airspeed indicator is no longer available to the manufacturer due to supply chain issues. The manufacturer would need a specification to determine if the new component will function with the helicopter over the aircraft’s lifetime.
The manufacturer could use a test standard, such as the helicopter vibration specification from MIL-STD-810H. However, they can generate a more individualized test profile with recorded data from the helicopter.
MIL-STD-810H states:
“Whenever possible, vehicle specific flight data should be acquired and employed in the development of an aircraft specific vibration criterion.”
As the group had recorded data, they could use it to generate a test profile and compare it to the standard.
Generating a Test Profile
The military standard also includes several notes on how they generated their helicopter standard. It is a worst-case environment, and they compressed a 2,500-hour test to 4 hours with a material value of 6. Group 2 used this information to create an equivalent profile.
The recorded helicopter data shows broadband random data and narrowband spikes due to the rotational vibration. Often, engineers use the fatigue damage spectrum (FDS) to accelerate a test profile. However, the FDS was not appropriate in this case because the recording also included sine data. Instead, the group selected the STAG test generation tool.
STAG Software
STAG is a feature of the ObserVIEW software that generates accelerated sine tone profiles from a recording and employs FDS to analyze the remaining random content.
The STAG software requires a tach channel, which the team did not have. However, they came up with a method to account for the missing information. After supplying the required data, the STAG tool extracted the top orders from the recording and generated accelerated sine tone profiles using the defined parameters.
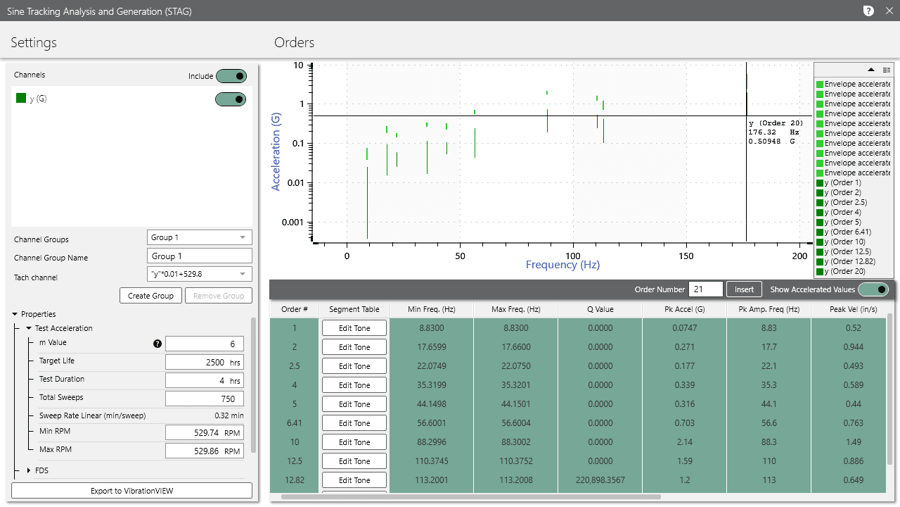
STAG dialog in ObserVIEW.
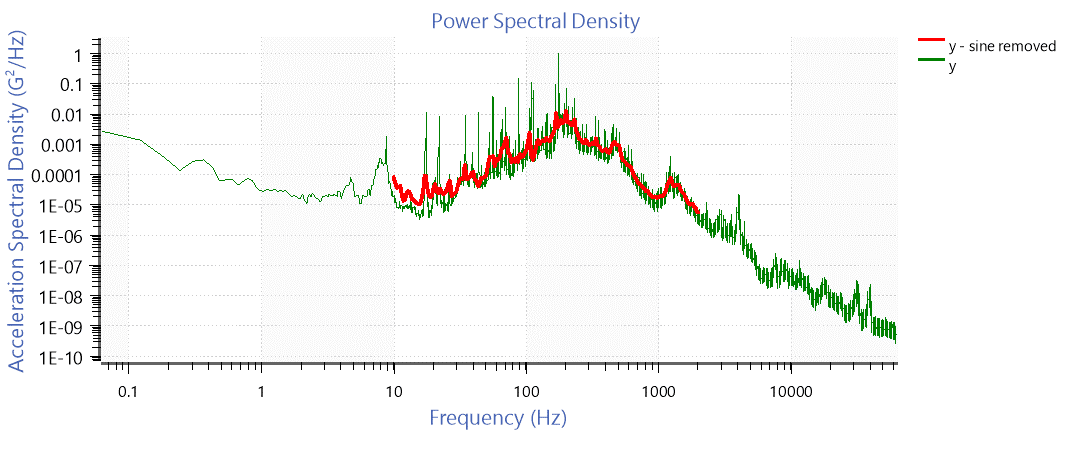
Then, the tool exported the remaining random data to the FDS software in VibrationVIEW. The following is the random data with the order content removed.
The software’s final step was to combine the accelerated sine and random data. The following is the resulting accelerated SoR test profile.
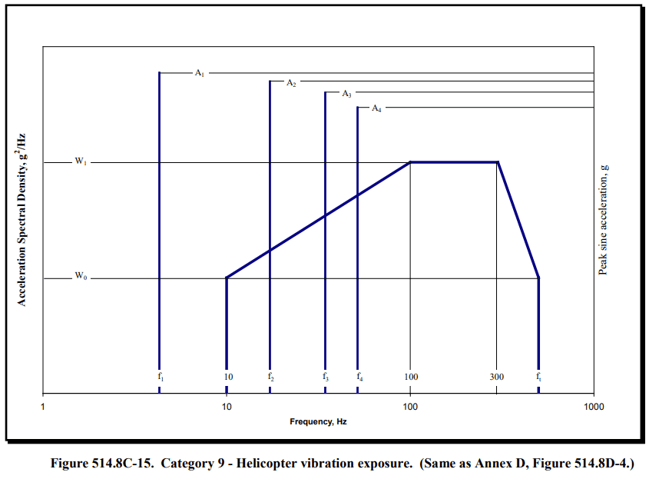
The group compared the test profile from the recordings to that of the MIL-STD, and the test profile they generated was much more severe. The standard test profile could cause product under-testing, leading to failure in the field.
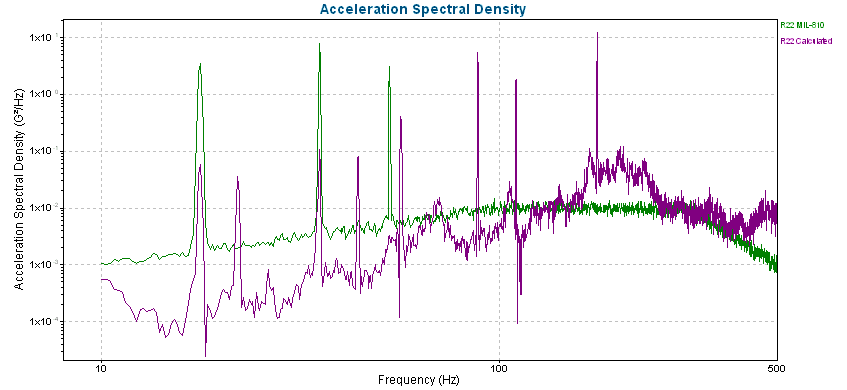
Test profile from the recordings compared to the MIL-STD specification.
Watch: Group 2 Presentation
Measurement of Fatigue with FDS
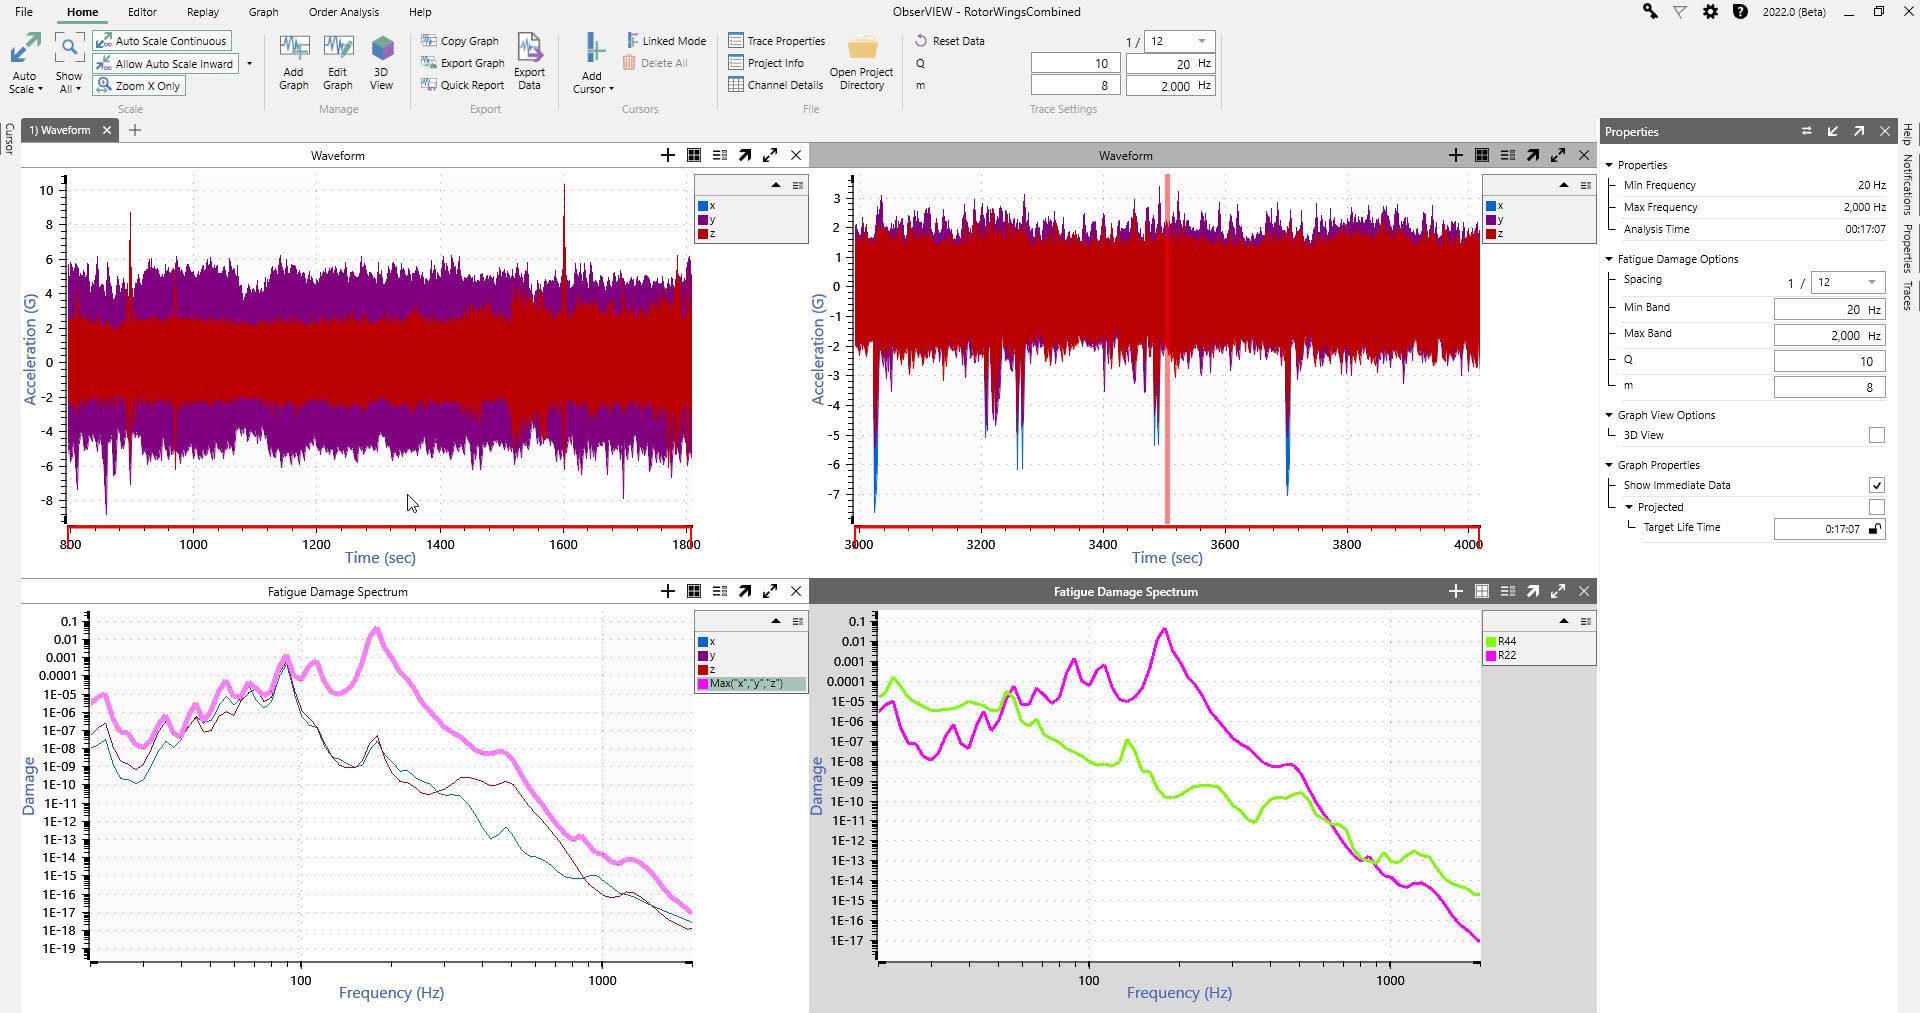
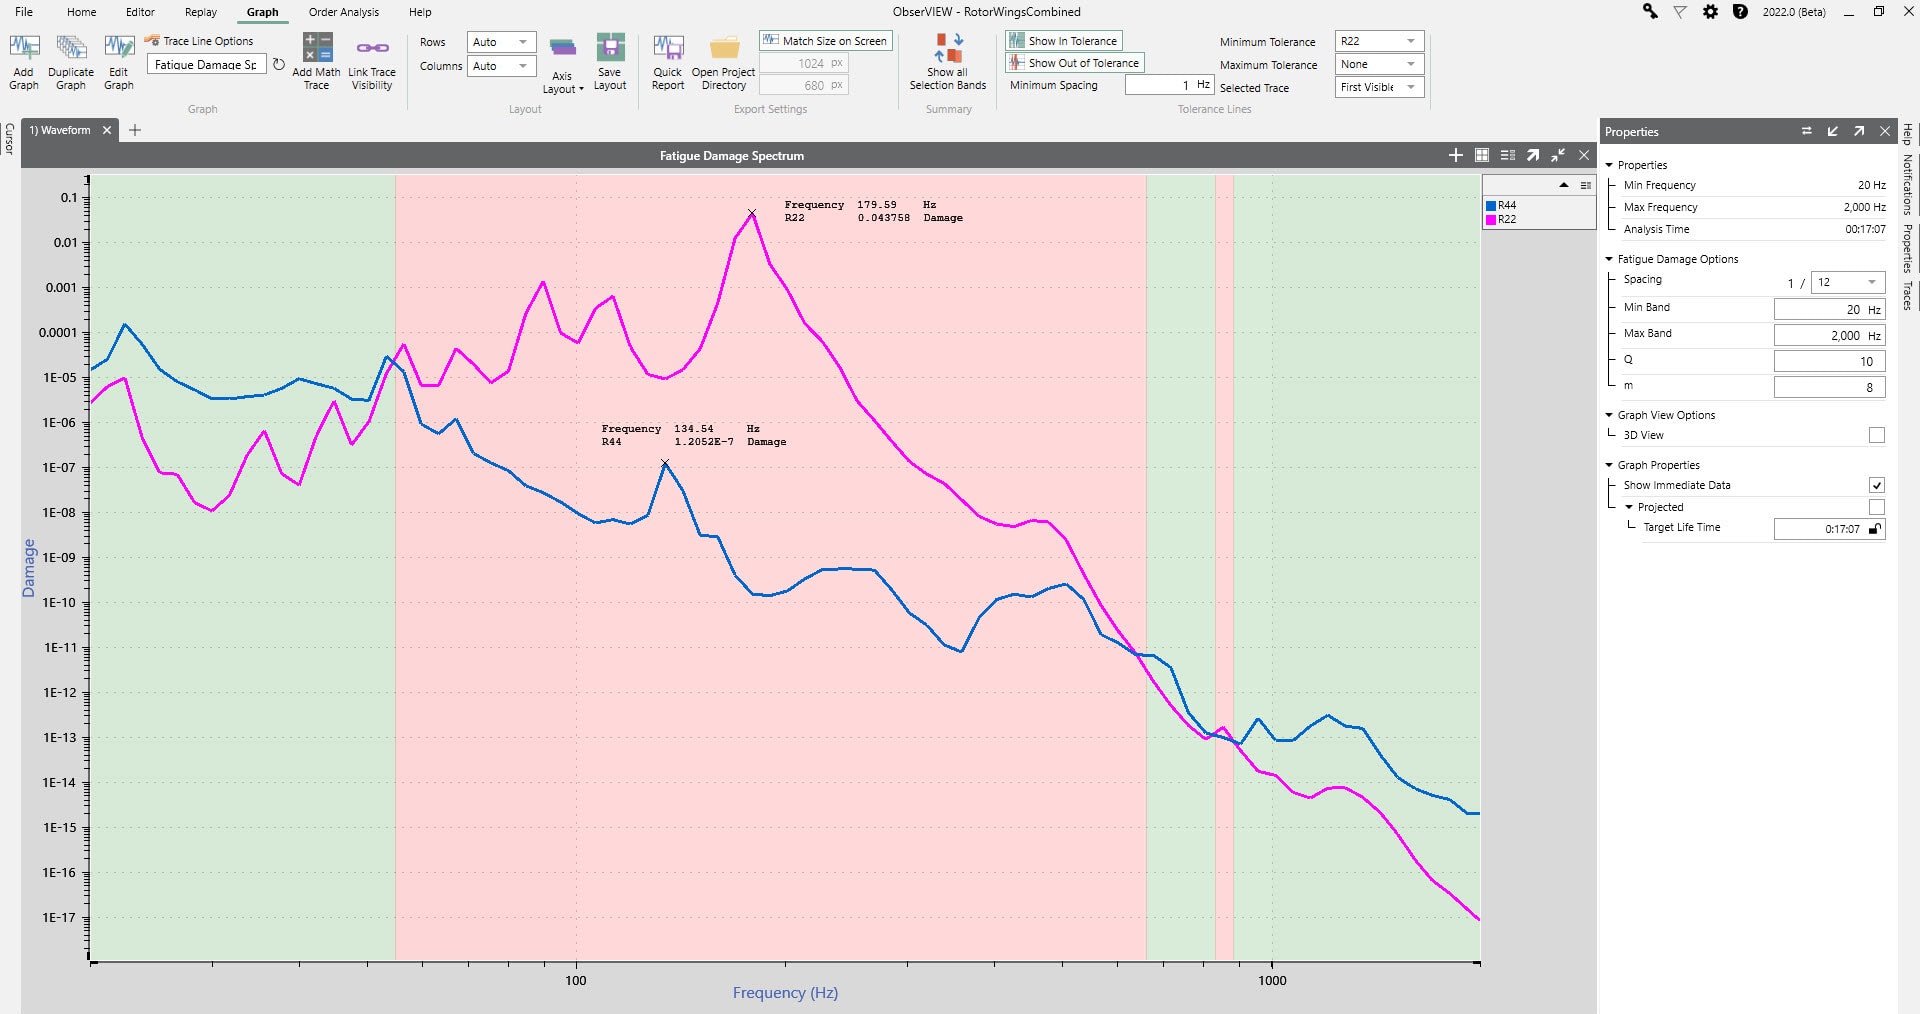
Although the FDS cannot accelerate sine tones, it is still a valid indicator of fatigue damage. In ObserVIEW, the group appended the R44 data to the R22 data and added a fatigue damage graph. Then, they generated a math trace for the maximum fatigue of the three directions and compared the max traces for each aircraft. The helicopter with the most severe fatigue damage depended on the frequency range.
The group also applied the graph function to visualize where the R22 is higher (green) and lower (red) than the R44.
Featured Software
Multimedia Sync
STAG

FDS
ObserVR1000 Recording Checklist
There are a few items to keep in mind when setting up the ObserVR1000 for recording. To make it easy, we’ve compiled a checklist to review before you begin.