The VibrationVIEW software includes the updated definitions of Te and TE as defined in version MIL-STD-810H. In VibrationVIEW, users can specify the Te and TE calculation version under the SRS tab in the Shock Response Spectrum Test Settings dialog box.
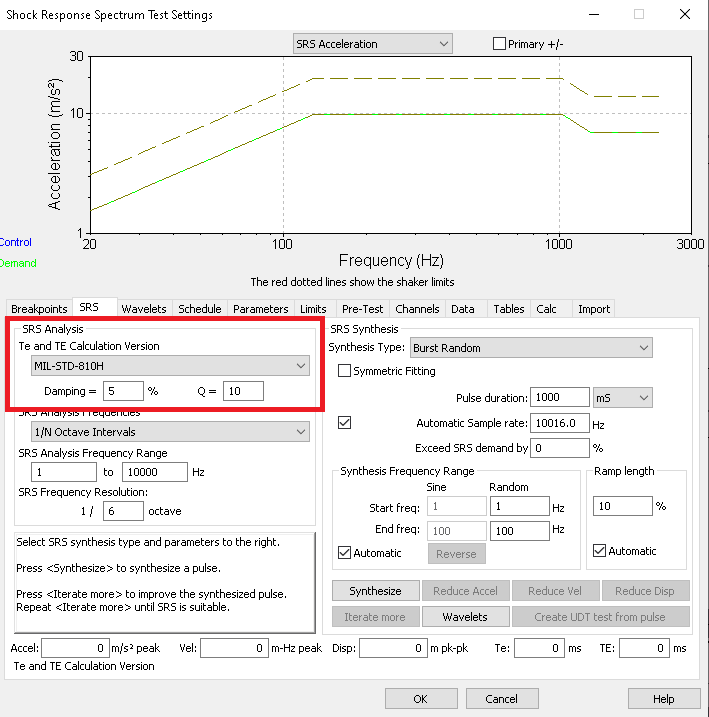
The drop-down box under Te and TE Calculation Version includes four options: MIL-STD-810F, MIL-STD-810G, MIL-STD-810G-CHG1 (MIL-STD-810G with change 1), and MIL-STD-810H. MIL-STD-810F and MIL-STD-810G define Te and TE differently than MIL-STD-810G-CHG1 and MIL-STD-810H. More than provide the standard definitions of Te and TE, we will also describe the application of the parameters for ease of selection.
What are Te and TE?
Te and TE are limits developed by the United States Department of Defense and are relevant when defining complex transient pulses. Compared to classical pulses, complex shock pulses represent real-world conditions more accurately. These complex pulses can be re-created from the original environment using the shock response spectrum (SRS).
If the test definition of the complex shock is specified as a maximax SRS, then a time-domain pulse must be synthesized to generate a response that will meet the specified SRS. Test standards typically define the SRS response tolerance requirements, but the requirements for the time domain pulse are often overlooked. Te and TE are two requirements for the time domain pulse that limits the duration of the time waveform.
Many different synthetic waveforms can be used to build the same SRS. Te and TE limit the type of waveforms that can be used and help to determine how the waveforms are constructed.
Current Definitions of Te and TE
Te
Te is the effective duration of a shock pulse.
In MIL-STD-810F, Te is defined as the minimum length of continuous time that contains the root-mean-square (RMS) time history amplitudes exceeding ten percent of the peak RMS amplitude associated with the shock event.
In MIL-STD-810H, Te is defined from the zero crossing for the first measurement acceleration “above the instrumentation noise floor” until the perceived end of the shock. See page 516.8A-6 of the MIL-STD-810H document for more information on the difference between these calculations.
TE
TE is the concentration of energy duration of the shock pulse.
In MIL-STD-810F, TE is defined as “the minimum length of time that contains all data magnitudes exceeding 1/3 of the peak magnitude associated with the shock event.”
In MIL-STD-810H, the calculation of TE uses the Crest Factor. The Crest Factor is the peak magnitude of an interval over the root-mean-square (RMS) time history amplitudes of the interval. The crest factor is computed in small intervals over the duration Te—e.g. Te/10—and the “maximum crest factor” is computed on the individual intervals is defined as CF. The calculation yields a revised definition of TE based on the minimum length of time that contains any time history magnitudes exceeding in absolute value of the peak value over CF.
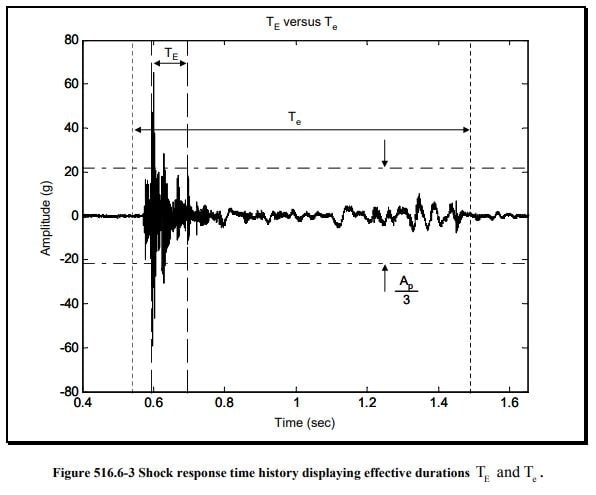
Te and TE identification in MIL-STD-810G (source: U.S. Department of Defense).
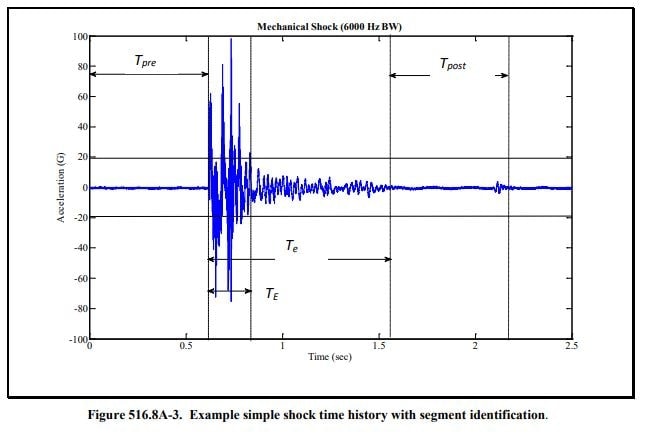
Te and TE identification in MIL-STD-810H (source: U.S. Department of Defense).
Which MIL-STD Version Should I Select?
Many test standards use the U.S. Department of Defense test method standards to define test parameters, so test engineers may encounter Te and TE values when developing an SRS test. In some cases, the test standard may provide which MIL-STD-810 calculation version to use.
Otherwise, it is advised to use the guidelines provided in the test method standards to determine which calculation version meets the MIL-STD specifications.
Using Recorded Time Waveforms
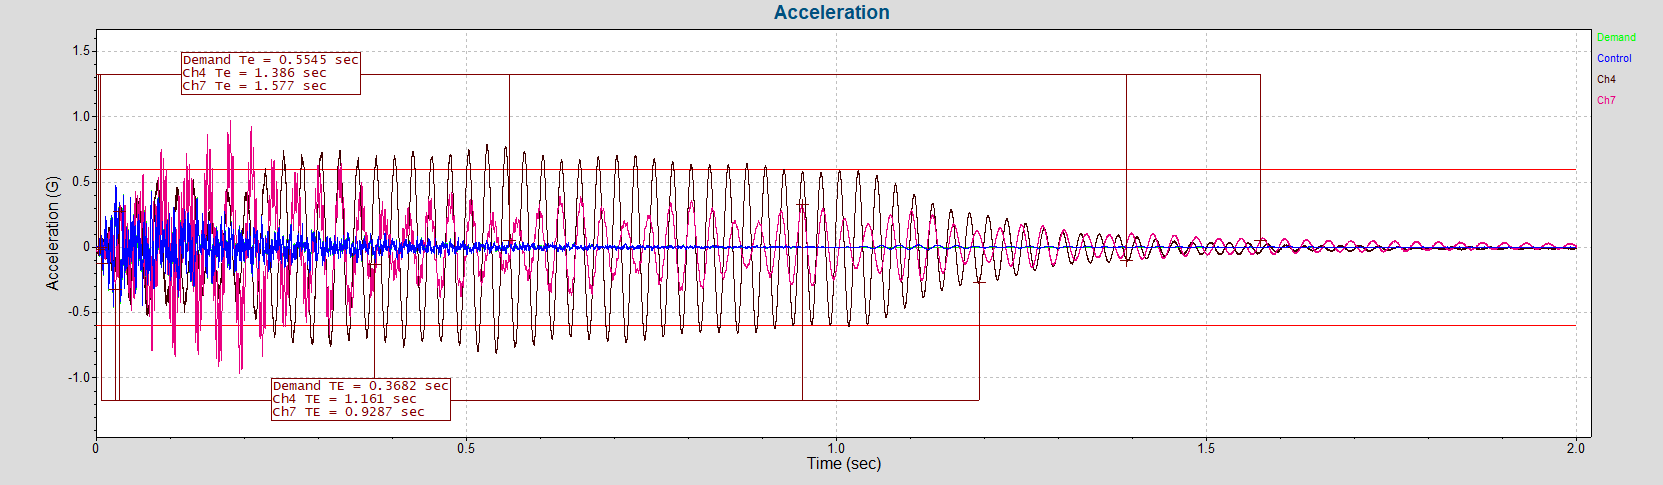
The annotate Te/TE command in VibrationVIEW adds the start and end range of the Te/TE calculation for all input channels (and the Demand) to the selected graph.
When recorded time waveforms are available, the shock durations (Te and TE) for the test pulse should be consistent with the measured data. Similarly, the synthesized waveform should reflect the measured data in terms of amplitude and zero crossings. When using measured data, Te and TE will be calculated from the time waveform measurements of the original environment (see Annex A, Paragraph 1.3).
When using multiple measurements to specify a shock environment, the handbook also provides the following guidelines:
- Tolerances must be specified on the maximax acceleration SRS
- Each test must fit within the tolerance bands to be satisfactory
- If the device under test (DUT) does not have a significant low-frequency modal response, the low-frequency portion of the SRS can “fall out” of tolerance to satisfy the high-frequency portion, as long as the high-frequency portion begins at least one octave below the first natural mode frequency of the DUT
- If the DUT has a significant low-frequency modal response, the duration of the complex transient pulse can fall outside of the TE range to “satisfy” the low-frequency portion of the SRS
If the number of measured time histories is not sufficient, it is recommended to use “an increase over the maximum of the available SRS spectra to establish the required test spectrum.” The resulting spectra should account for random distribution and uncertainty in any predictive methods. According to the handbook, the durations of Te and TE should be taken as “the respective maximums as computed from each of the measured time histories.”
When Measured Data is Not Available
If measured time history waveforms are not available, the SRS and the corresponding Te and TE values may be derived from:
- A scaled measurement of a “dynamically similar” environment
- Structural analysis or other prediction methods
- A combination of sources
For more information, please see METHOD 516.8, 2.3.2.2, “SRS in the Absence of Measured Data.”
When Tolerances Cannot Be Met
The following guidelines are provided when the tolerances cannot be met:
“In cases in which such tolerances cannot be met, establish achievable tolerances that are agreed to by the cognizant engineering authority and the customer prior to initiation of the test. In cases, in which tolerances are established independently of the guidance provided below, establish these tolerances within the limitations of the specified measurement calibration, instrumentation, signal conditioning, and data analysis procedures” (METHOD 516.8, 4.2.2.).
Symmetric Fitting Checkbox
The new Symmetric Fitting checkbox can also be found under the SRS tab.
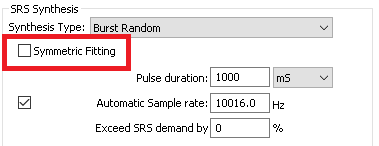
The Symmetric Fitting checkbox offers a new fitting option when synthesizing or iterating pulses to match SRS values. It can be used for all synthesis types.
Symmetric Fitting Unchecked
When Symmetric Fitting is not checked, a software algorithm determines the best-fit line when the pulses are synthesized. The line is determined by the arithmetic mean of the minimum and maximum of the responses for each frequency (maximax). VibrationVIEW used this arithmetic mean before the release of the Symmetric Fitting option.
If the primary +/- pulses do not fit within the tolerance band after iteration, the user can run the test twice. (The lower responses are more likely to be outside tolerance because the lower tolerance is often narrower than the higher tolerance.) First, the test can be run to capture higher responses. Then, the waveform can be inverted so the lower responses fit within the higher tolerance, and the test can be run again.
Symmetric Fitting Checked
When Symmetric Fitting is checked, the best-fit line is determined using the geometric mean. When synthesizing a pulse, the user wants both positive and negative components within tolerance and velocity and displacement equal in both positive and negative directions. We found that using the geometric mean required fewer iterations to generate pulses that match the desired SRS.
The correct fitting option depends on the goals of the test. If the test can tolerate a more general best-fit line, then the Symmetrical Fitting option may be an efficient choice. Below, the iteration of the same waveform is displayed with the Symmetric Fitting option unchecked and checked.
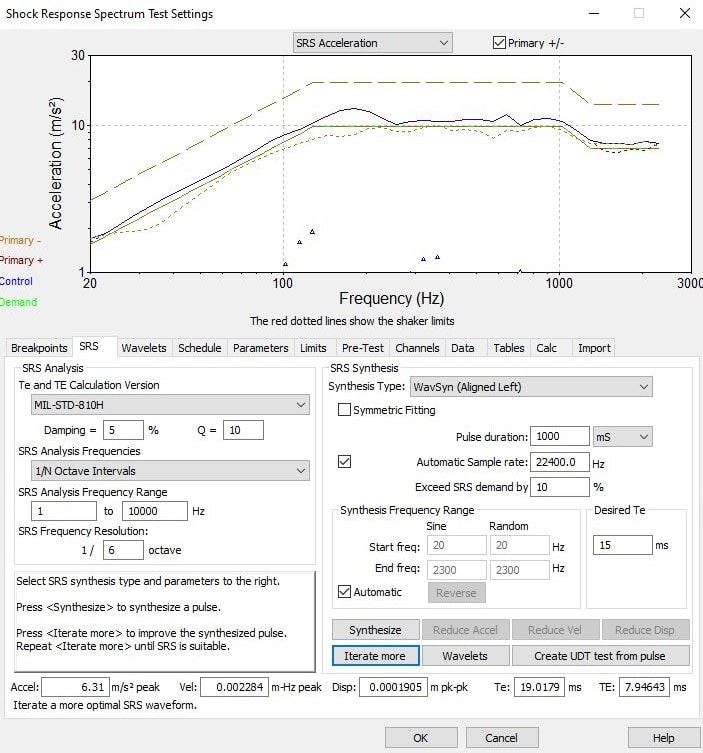
WavSyn (Aligned Left) with Symmetric Fitting option unchecked.
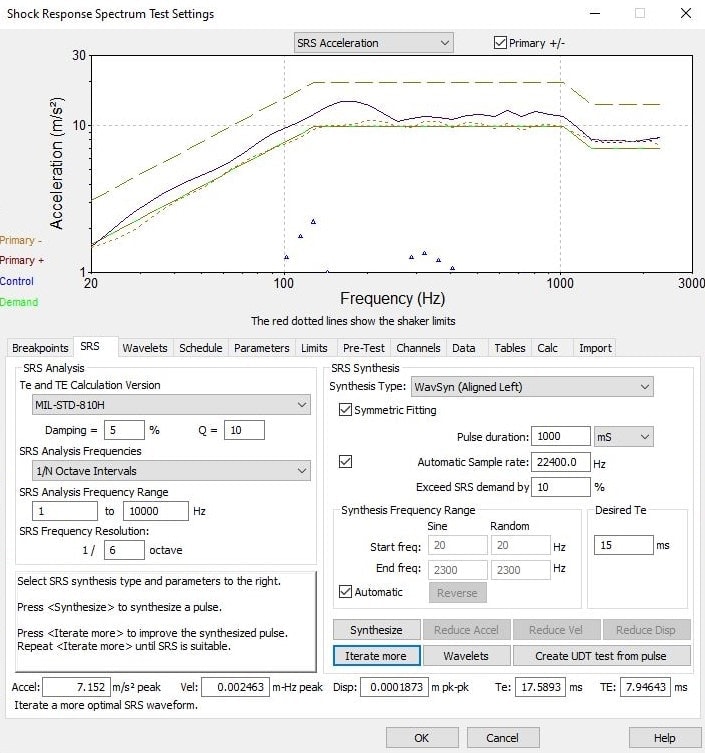
WavSyn (Aligned Left) with Symmetric Fitting option checked.
Defining SRS Test Specifications
The following video discusses the process of developing SRS test specifications such as Te/TE, including common problems and suggested practices. It also presents an approach to SRS test profile development using field data.
Download VibrationVIEW software
VR controller users with a valid Upgrades and Support Agreement can upgrade to the latest version of VibrationVIEW for free. The demo version is available to any user for free.