At the start of 2022, the Vibration Research team set off in nine small groups to test the ObserVR1000 dynamic signal analyzer in real-world applications. The goal was to understand our product better in an operational setting and note any potential improvements. The groups presented their findings to the rest of the VR team. This series relays pertinent (or simply fun) information we found.
Monster Truck Meets Pontoon Boat
ObserVIEW Software: FDS, Advanced Analysis
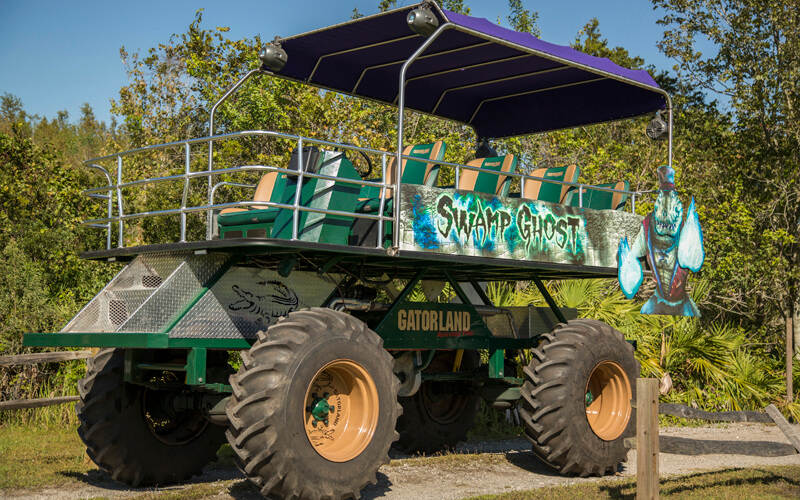
Off-road vehicle at Gatorland.
Group 7 trekked to Gatorland to collect data and (perhaps most importantly) catch a glimpse at some gators. The 100-acre theme park and wildlife preserve offers rides through an adventure trail on a monster truck-looking off-road vehicle. The Gatorland team was more than happy to accommodate the VR team as they rigged up several sensors to the vehicle.
Recording Setup
First, Group 7 cleaned the areas where they wanted to mount the sensors. They selected the engine mount, the vehicle frames, and the front seat. The engine generated quite a bit of heat, but the sensor and adhesive were unaffected by the temperature.
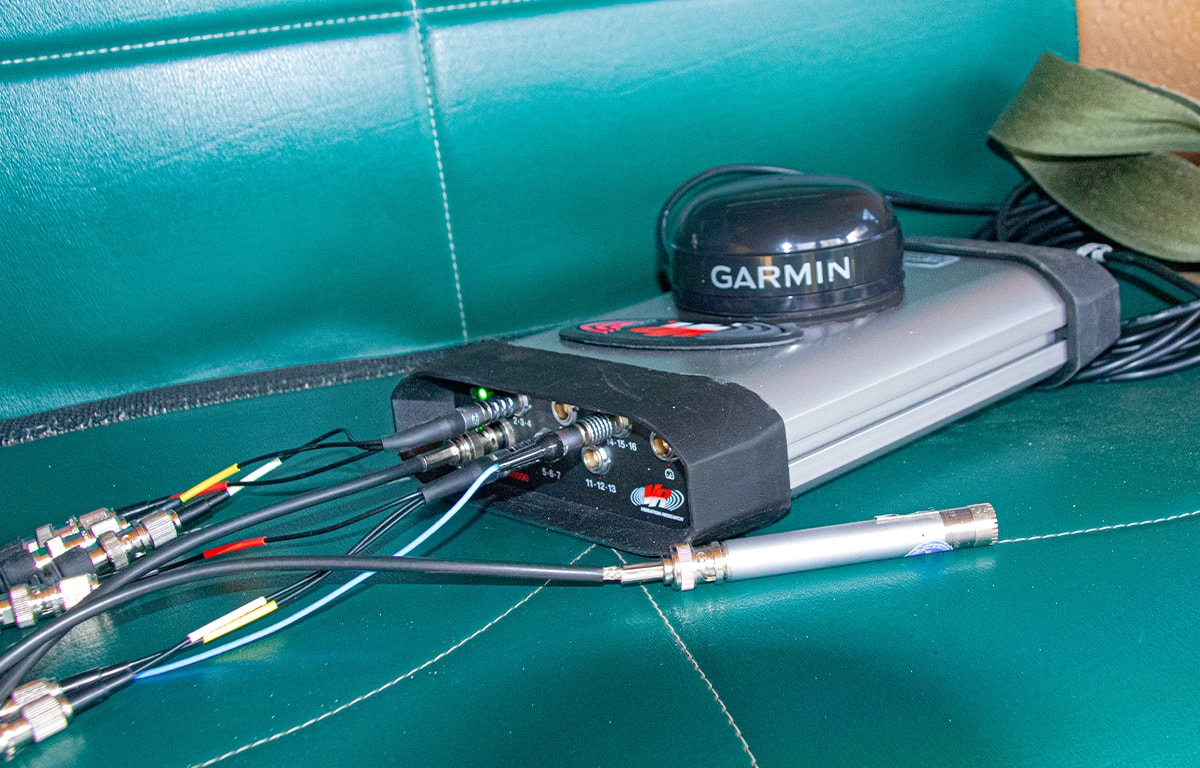
ObserVR1000 with connected sensors on the off-road vehicle.
The driver told the group ahead of time that they could not get out of the vehicle during the trail ride because of lurking alligators and a narrow path. As such, the team was diligent in securing the sensors with extra electrical tape and super glue. They would not be able to reattach a sensor if it fell off during the ride.
Data Collection
The adventure trail was a one-way two-track in the trees. There were hills, puddles, and many curves. The driver would step on the gas around the curves and hit the throttle in anticipation of the bumps but decelerated just before the hills to roll over them slowly. The team collected about 15 minutes of data.
Data Analysis
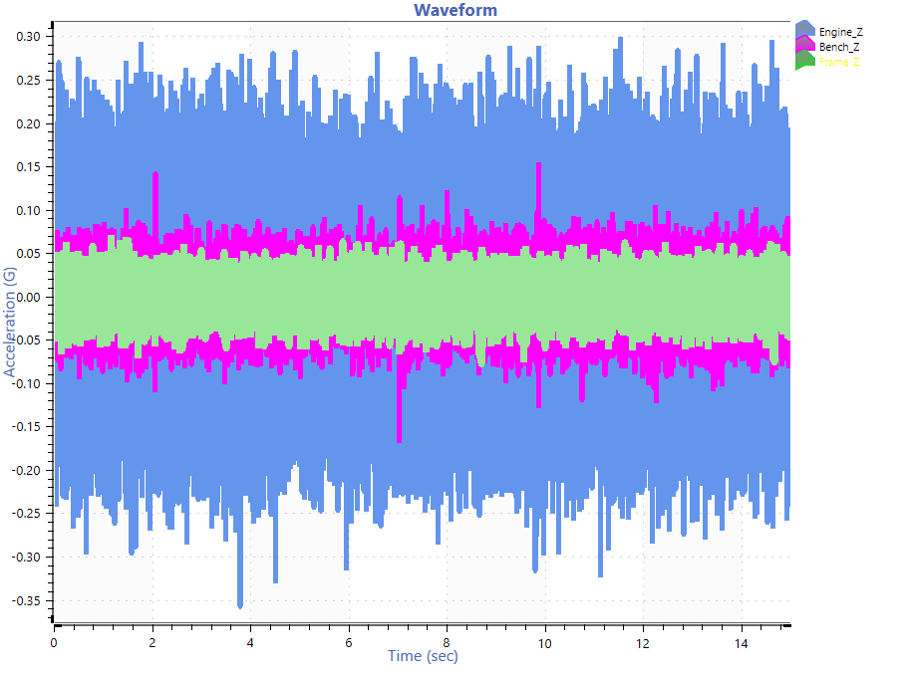
Group 7 decided to compare two contrasting events during the ride, which occurred when the vehicle was idle and when it rode over a series of bumps. The group identified two 15-second sections of data that best represented these events of interest and exported them into separate projects. They only considered waveforms on the z-axis for analysis because they wanted to compare data from all three locations, and some of the sensors were single axis.
FDS Comparison
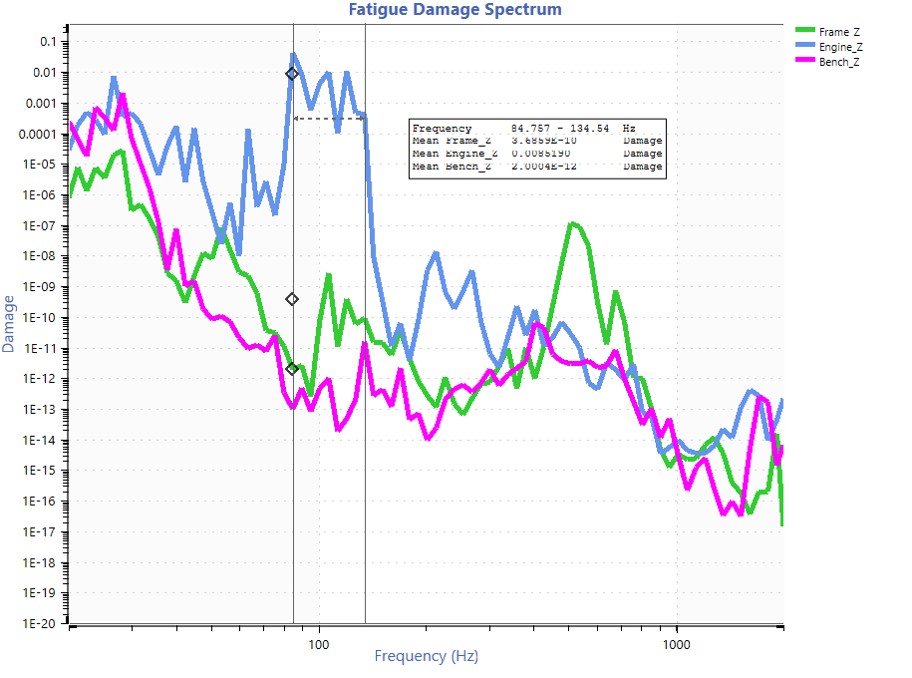
First, the group generated a fatigue damage spectrum (FDS) to compare the damage potential of each data section. The engine had the most damage across the frequency spectrum, followed by the bench and the frame.
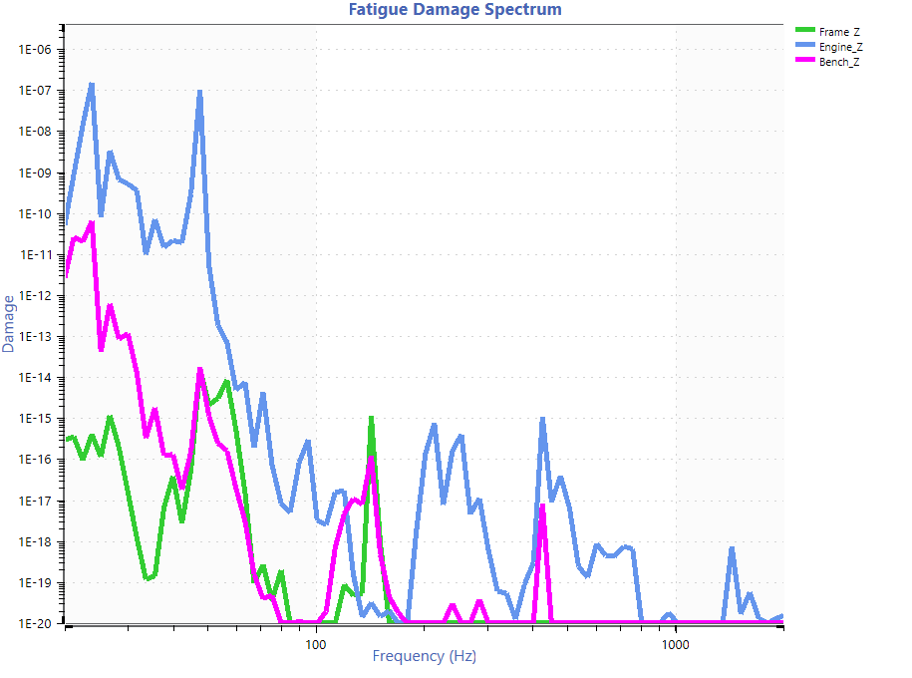
FDS comparison of z-axis data.
However, the frame data had the highest acceleration levels in the time waveform, which was odd to the team. Considering the time data, they would have expected the frame to have the most damage, not the least.
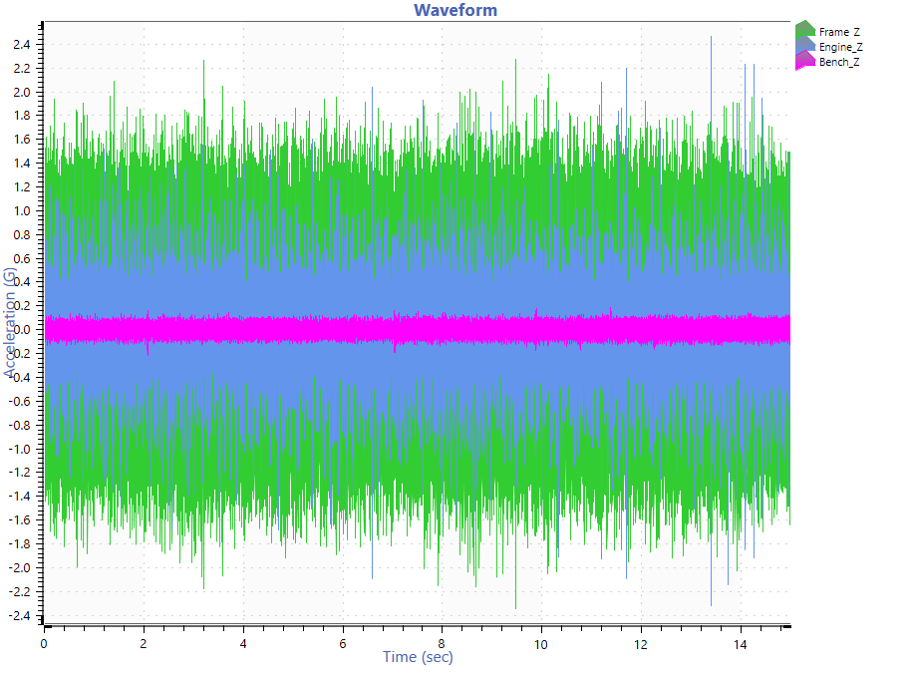
Time-waveform data.
When they zoomed in on the data, they realized that the frame acceleration occurred at a very high frequency.
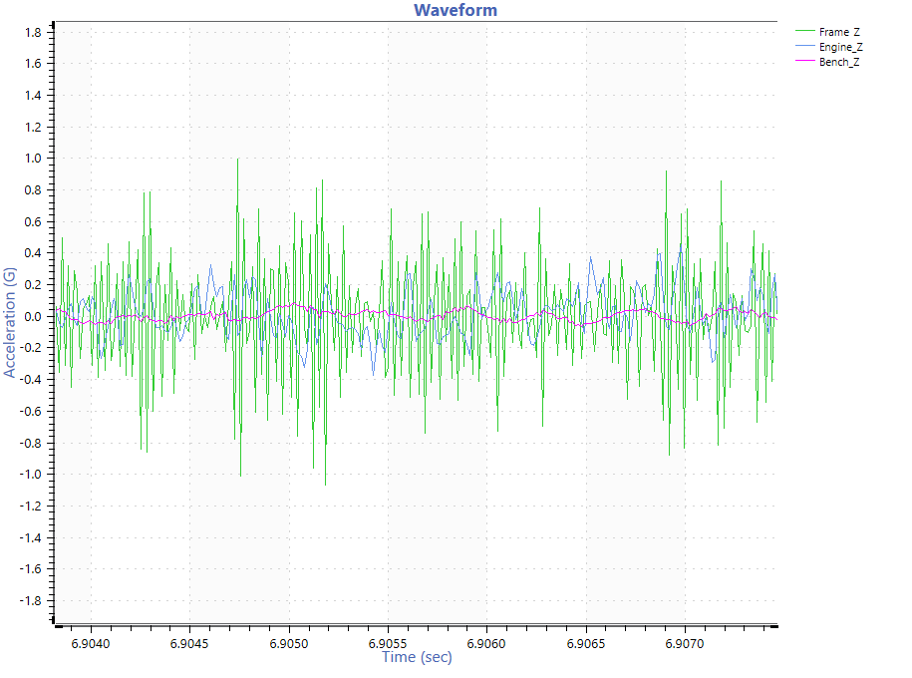
Adjusted graph of time-waveform data.
A PSD of the data was consistent with this finding. Most of the frame data power was above the 10,000-hertz range, and the team’s frequency of interest was between 20 and 2,000Hz. Therefore, the analysis did not include the damage from the high-frequency data.
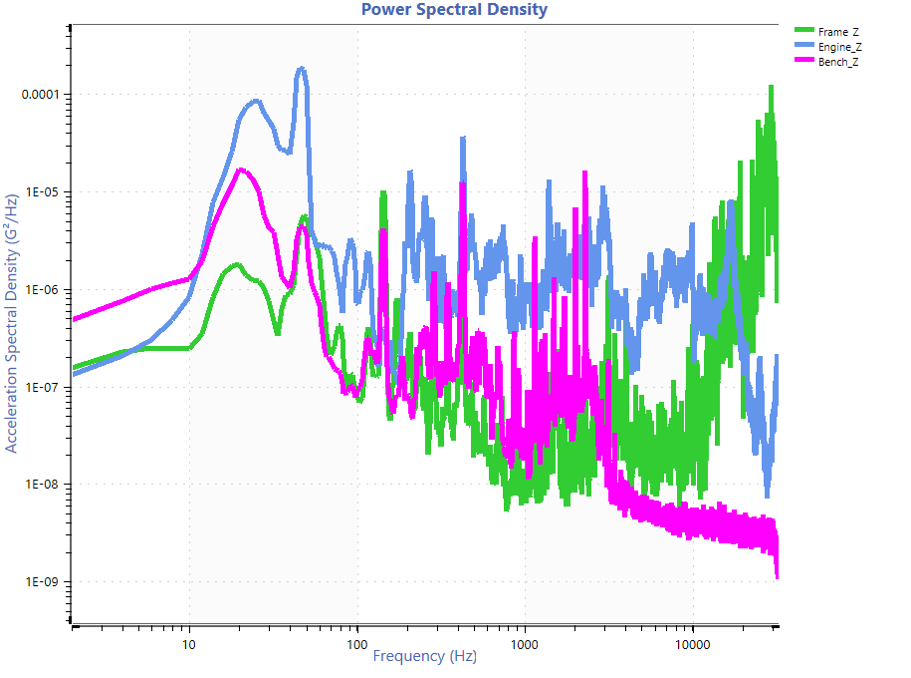
PSD comparison of data.
Using the live filtering feature in ObserVIEW, the team added a band pass filter to the waveform to view the data in the 20-2,000Hz range. For the most part, the frame data was out of the frequency range of interest, and a filter brought the data closer to what they would use to generate the FDS.
Time waveform with band pass filter applied.
Peaks in the FDS
Group 7 also noted peaks on the FDS that appeared to be similar distances apart. Using a harmonic cursor, they determined that the vehicle was excited at harmonic intervals.
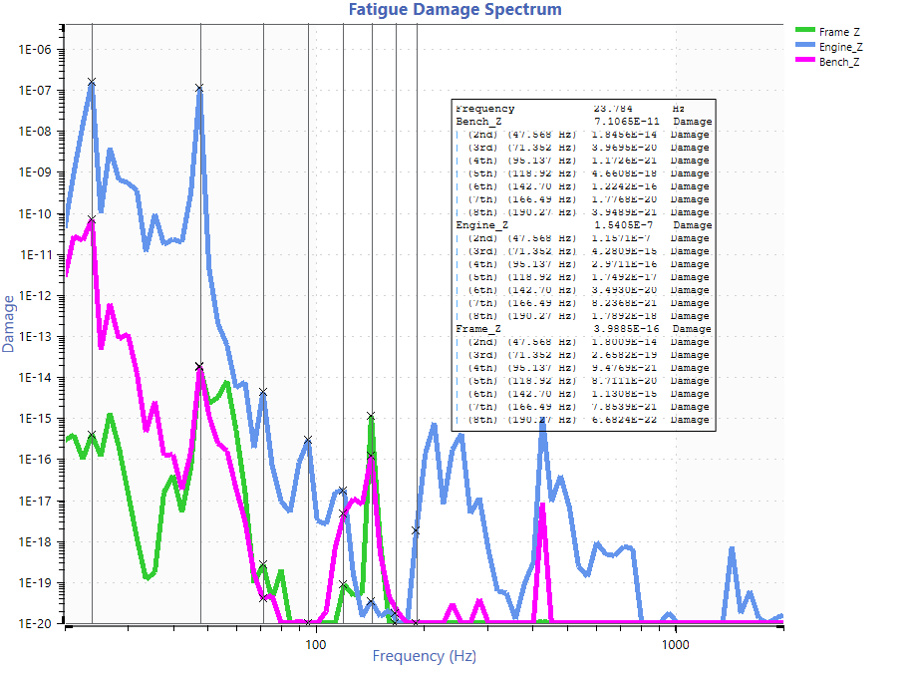
FDS with harmonic cursors.
The increase in frequency power (and therefore damage) was likely related to the engine’s RPM. At most frequencies, the engine mount experienced the most damage. However, at around 142Hz, the bench and frame had more damage. The frame or something close to it may have had a resonance near that frequency.
Shock Damage
Group 7 anticipated seeing more shock events in the FDS of the bumpier data. Shock would cause more uniform damage because of the broad-spectrum energy imparted by the shock waveforms. The data was consistent with the group’s prediction.
However, the team wondered why the FDS showed high damage levels for the engine across about a half-octave of frequencies. They played back the PSD and FDS at a slower time frame to find out.
High damage levels across a half-octave of frequencies.
In the PSD, a peak moved back and forth in the frequency range of interest, which was likely due to the engine’s change in RPM. A change in RPM changes the frequencies that an engine excites. When the engine vibration excites a frequency in a particular frequency bin, it increases that bin’s amplitude in the FDS. Changing engine speeds during the recording accounted for the damage at the various frequency bins.
Conclusion
The team was surprised that the engine vibration accounted for more damage than other sources, such as shock to the frame. They saw significant damping between the components they measured, and, as expected, they found that the engine at idle did not produce as much damage as the engine at high throttle. These findings could apply to the testing of off-road vehicles such as ATVs and UTVs, as well as tractors and trucks.
Featured Software

FDS
Advanced Analyzer
ObserVR1000 Recording Checklist
There are a few items to keep in mind when setting up the ObserVR1000 for recording. To make it easy, we’ve compiled a checklist to review before you begin.