Vibration displays unique patterns when analyzed in different domains, such as the time or frequency domain. For rotational machinery, the angular domain highlights vibrational patterns related to the rotating component’s sinusoidal output. Engineers can analyze rotational vibration—meaning separate it into parts—with order analysis.
Article Overview
- What order analysis is and how it separates rotational or reciprocating vibration
- How orders correspond to RPM and its harmonics
- Methods for recording order data during machine run-ups or coast-downs
- Visualization via tachometer-based spectrograms and time-history plots with RPM traces
- How ObserVIEW software extracts selected orders
- Application of the STAG tool to isolate and extract dominant orders for building accelerated SoR vibration tests
What is Order Analysis of Vibration?
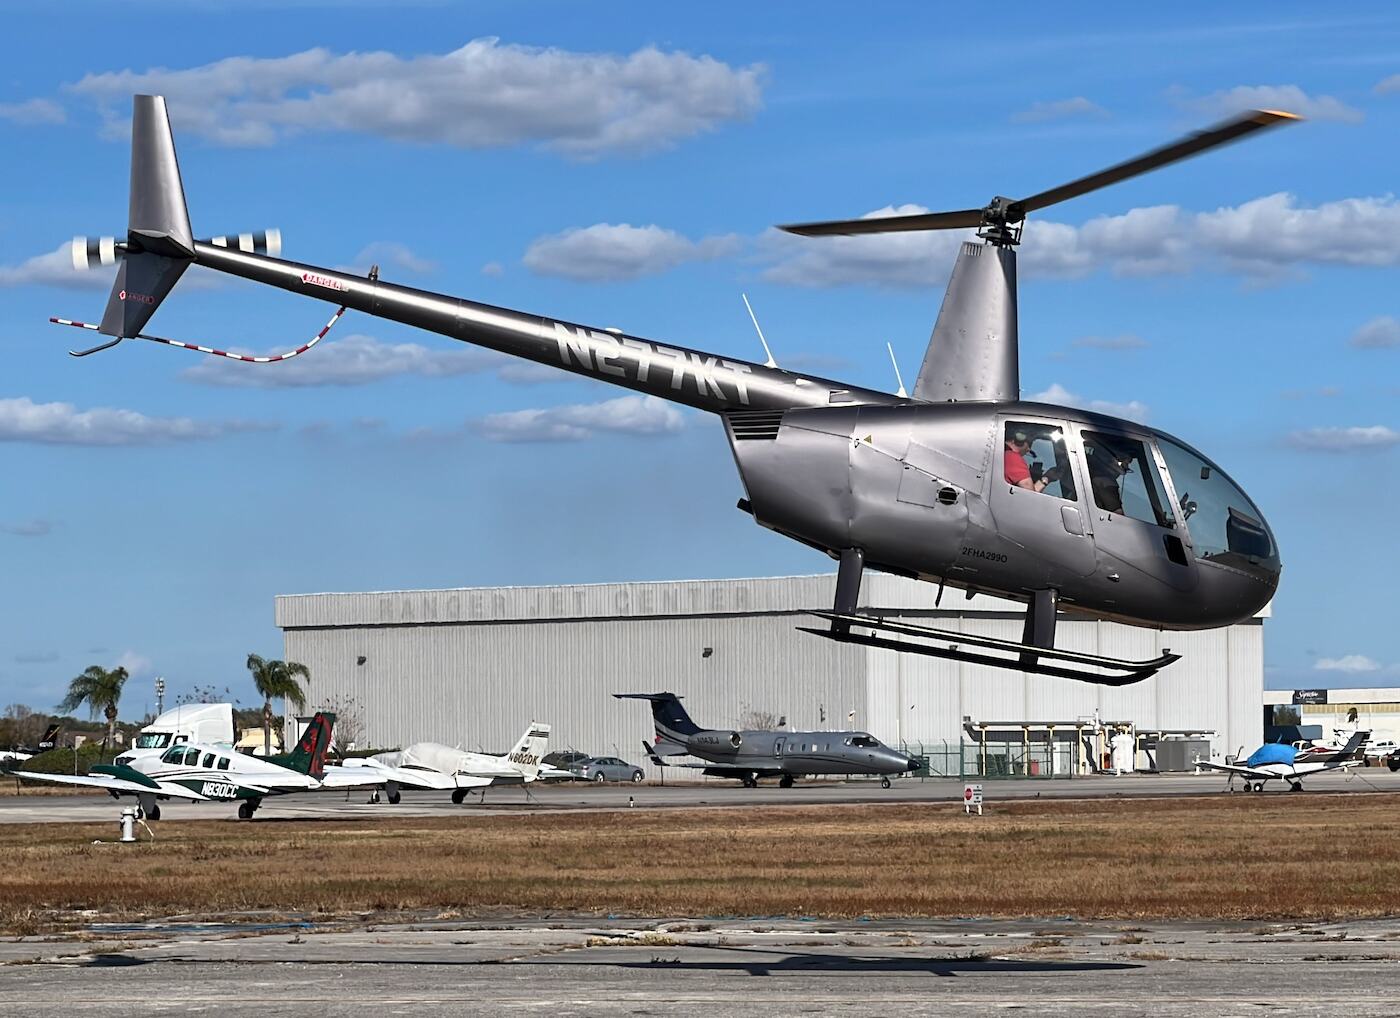
Order analysis can help differentiate a rotational source of vibration from random vibration, such as the rotational vibration from a rotor blade on a helicopter.
Order analysis is a method of analyzing the noise and vibration of machines with rotational or reciprocating components. Machinery is composed of different parts that can have distinct vibrational patterns. Order analysis helps differentiate the rotational vibration from the random or non-synchronous vibrations in the machine’s overall output.
Why Order Analysis?
Engineers perform order analysis to identify how the vibration of an individual rotating component contributes to the overall vibration. Machine fatigue and damage are often related to the rotational speed (RPM) or its harmonics, and analysis of order content helps diagnose faults. For example, vibration irregularities at frequencies related to the rotation can indicate problems like gear damage or tooth breakage. Analyzing order content is critical for a complete evaluation of rotating machinery.
Rotating components do not always run at a steady state. Often, their RPM shifts and the vibration pattern is inconsistent. Additionally, a rotating component’s vibration will change as the component fatigues, potentially shifting its frequency and harmonics. Order analysis is a specialized form of spectral analysis that is more suitable than other methods for tracking patterns over time and across various speeds.
Orders of Rotational Vibration
Order analysis separates rotational or reciprocating vibration into “orders”: individual frequency components relating to the RPM and its harmonics. In this case, the harmonics are multiples of the reference RPM. When the reference RPM changes, so do the order values.
The first order corresponds to the machine’s rotational speed (RPM). In other words, the first order and the frequency of the rotation are the same value. The subsequent orders (2, 3, 4, etc.) are multiples of the reference RPM.
Frequency = RPM / 60
For example, if an engine rotates at 900RPM (15Hz), then order 2 equals 30Hz, order 3 equals 45Hz, and so on. If the RPM increases to 1,200 (20Hz), the corresponding order values would be 40Hz, 60Hz, 80Hz, etc.
| 900 RPM | 1200 RPM | |
| 1st Order | 15Hz | 20Hz |
| 2nd Order | 30Hz | 40Hz |
| 3rd Order | 45Hz | 60Hz |
| 4th Order | 60Hz | 80Hz |
The number of harmonics depends on the number of events per revolution. For example, many four-cylinder, four-stroke automotive engines have a second-order vibration; for every engine revolution, half—or two—of the cylinders fire.
Watch: How a car engine works by Autotechlabs (via YouTube).
Recording Order Data
As rotational machinery often varies in speed, engineers must record data over time to understand the potential vibrations of the rotating component. This process helps improve the safety and longevity of rotational equipment by analyzing its response to the range of RPMs that may occur in use. One method is to perform a run-up or coast-down that steadily increases the RPM as a sweep and record with a tachometer.
Order Tracking
Engineers can also employ order tracking, a more advanced analysis in the angular domain. Order tracking uses resampling to correspond the response to the angular position of the rotating component. The signal is sampled at steady angular increments and is unrelated to speed. Order tracking collects samples per revolution, and the signal’s amplitude and phase are a function of orders.
Viewing the Recorded Data
A spectrogram is a helpful tool for identifying order lines. It displays the strength of a signal over time at various frequencies. Below is a time-history waveform with an RPM trace and a tachometer-based spectrogram; the dashed red lines indicate the top orders with the highest amplitudes.
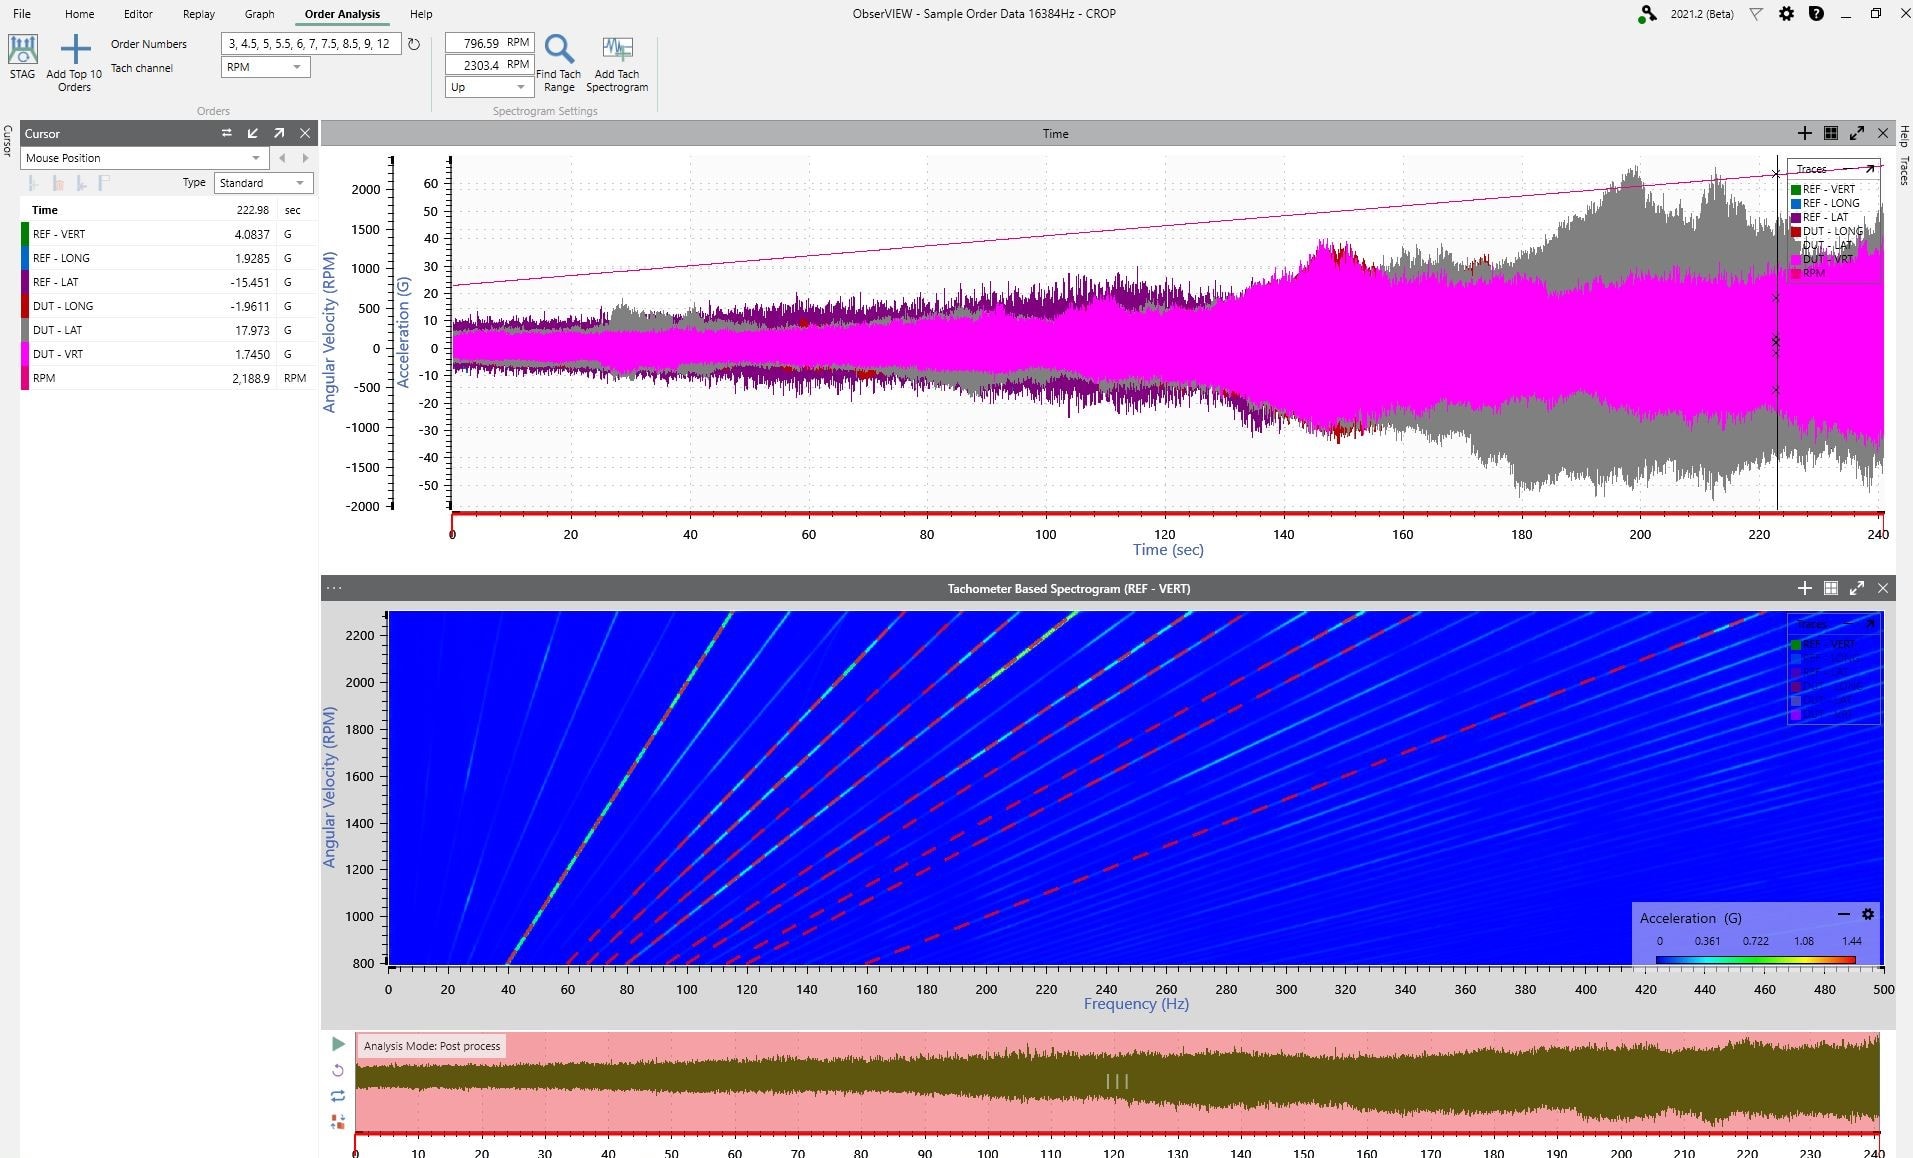
Time-history file with RPM trace (above) and tachometer-based spectrogram (below).
Test Generation in ObserVIEW
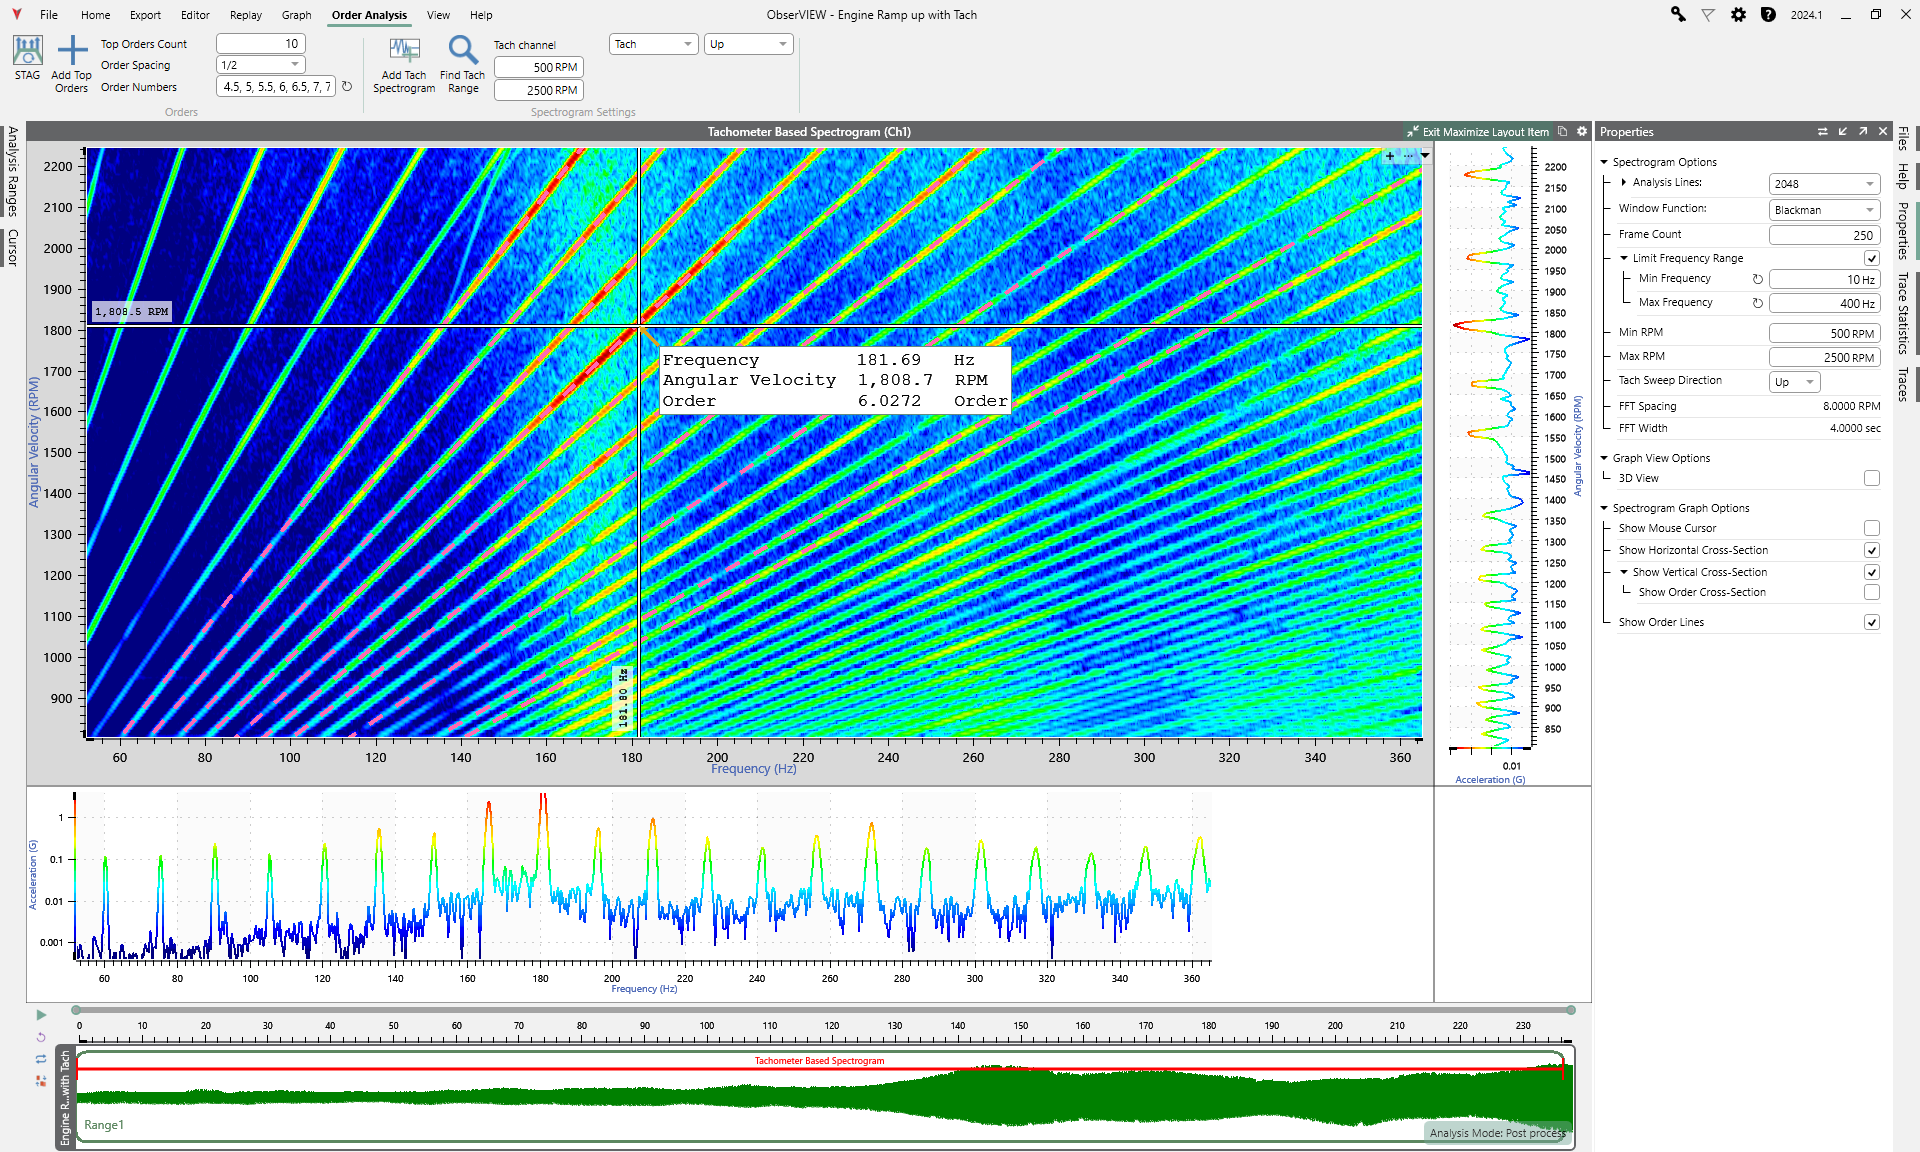
The ObserVIEW software extracts orders of interest from recordings with a defined tachometer (angular velocity) channel. A tracking filter that closely follows the RPM of the tachometer trace extracts vibration data for the selected order number while rejecting out-of-band data.
The user can manually choose orders or automatically generate the top orders. Using the spectrogram data, the software selects the orders based on the highest peak acceleration levels within the analysis range. With time- and order-based spectrograms, the user can then analyze/manipulate the data and compare amplitudes.
Next, they can employ the Sine Tracking, Analysis and Generation (STAG) software. STAG identifies dominant orders and extracts them from the original recording to generate an accelerated sine-on-random test. It uses a combination of order analysis, order extraction, sine tone profile creation, and sine tone profile acceleration to isolate, extract, and create an accelerated sine profile or series of sine profiles from a recording.
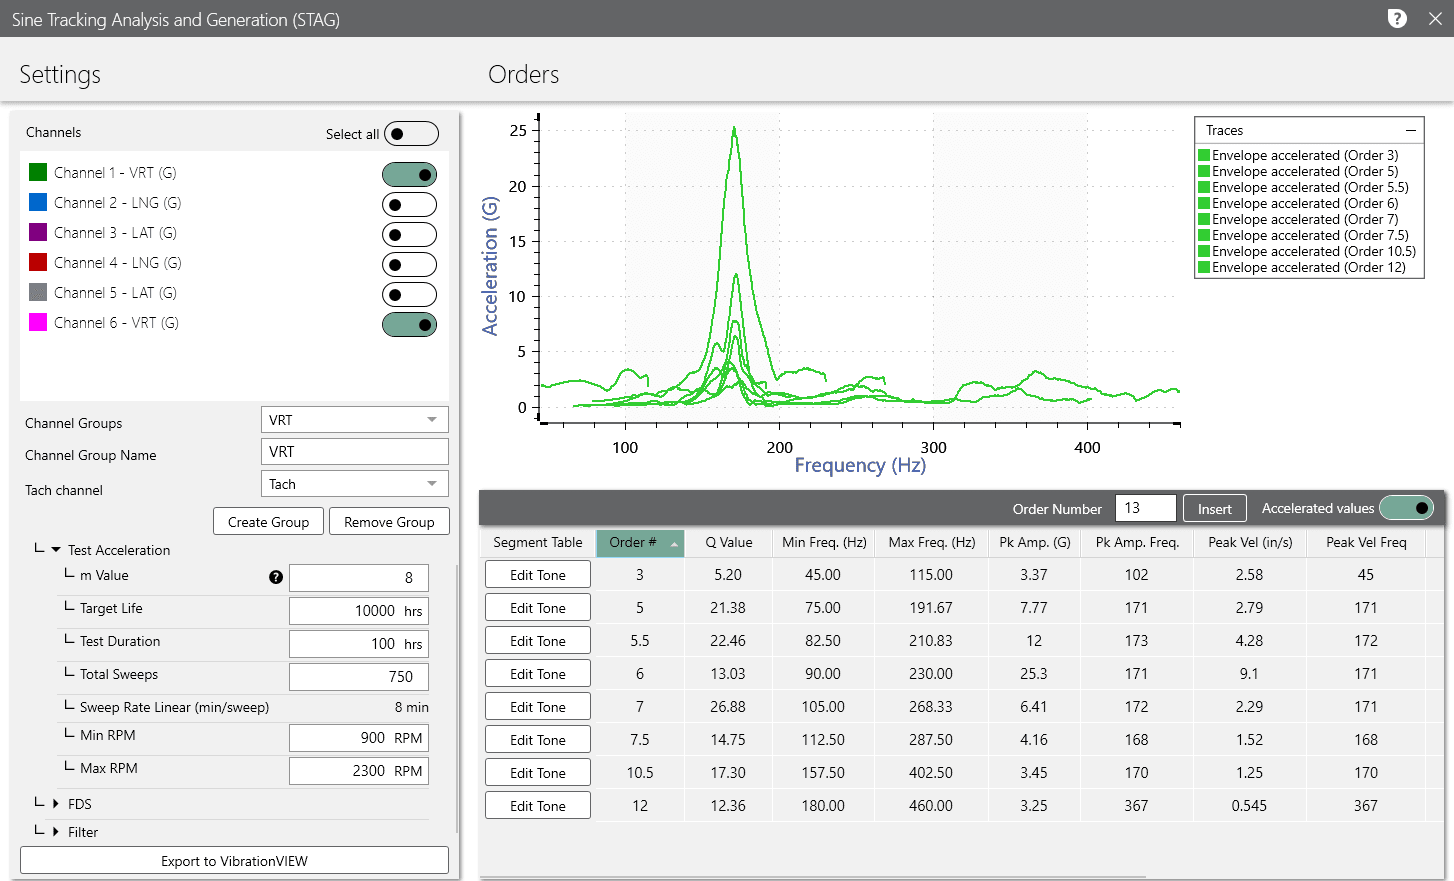
STAG dialog in the ObserVIEW software.
From there, ObserVIEW analyzes the remaining random content with the fatigue damage spectrum and combines it with the sine test profile. STAG allows for the analysis, acceleration, and generation of a test representative of real-world environments with dominant sinusoidal components.
Order Analysis
Order analysis enables engineers to evaluate rotational and reciprocating vibration by aligning vibration data with rotational speed and its harmonics. By capturing run-ups or coast-downs and using tachometer-based spectrograms, they can distinguish rotational content from random noise.
In ObserVIEW, users can isolate specific orders and, with STAG, synthesize accelerated sine-on-random test profiles that replicate real-world rotational scenarios while accounting for background randomness. This approach provides RPM-correlated spectral data crucial for diagnosing dynamic behavior and fatigue-related issues.