Identify a structure’s response to excitation with modal analysis. The Modal Testing software collects responses, calculates averages, and generates transfer functions. From there, export the data to a modal analysis software.
The ObserVIEW Modal Testing software is compatible with modal impact hammer excitation. The ObserVR1000 records the impulse via the hammer’s force sensor and the structure’s output via the response accelerometers. ObserVIEW systems also support a basic shaker-driven modal analysis.
Modal Test Setup
Modal analysis can be experimental or operational. Engineers most often use experimental analysis, where a mechanical device excites the structure, and the response is recorded.
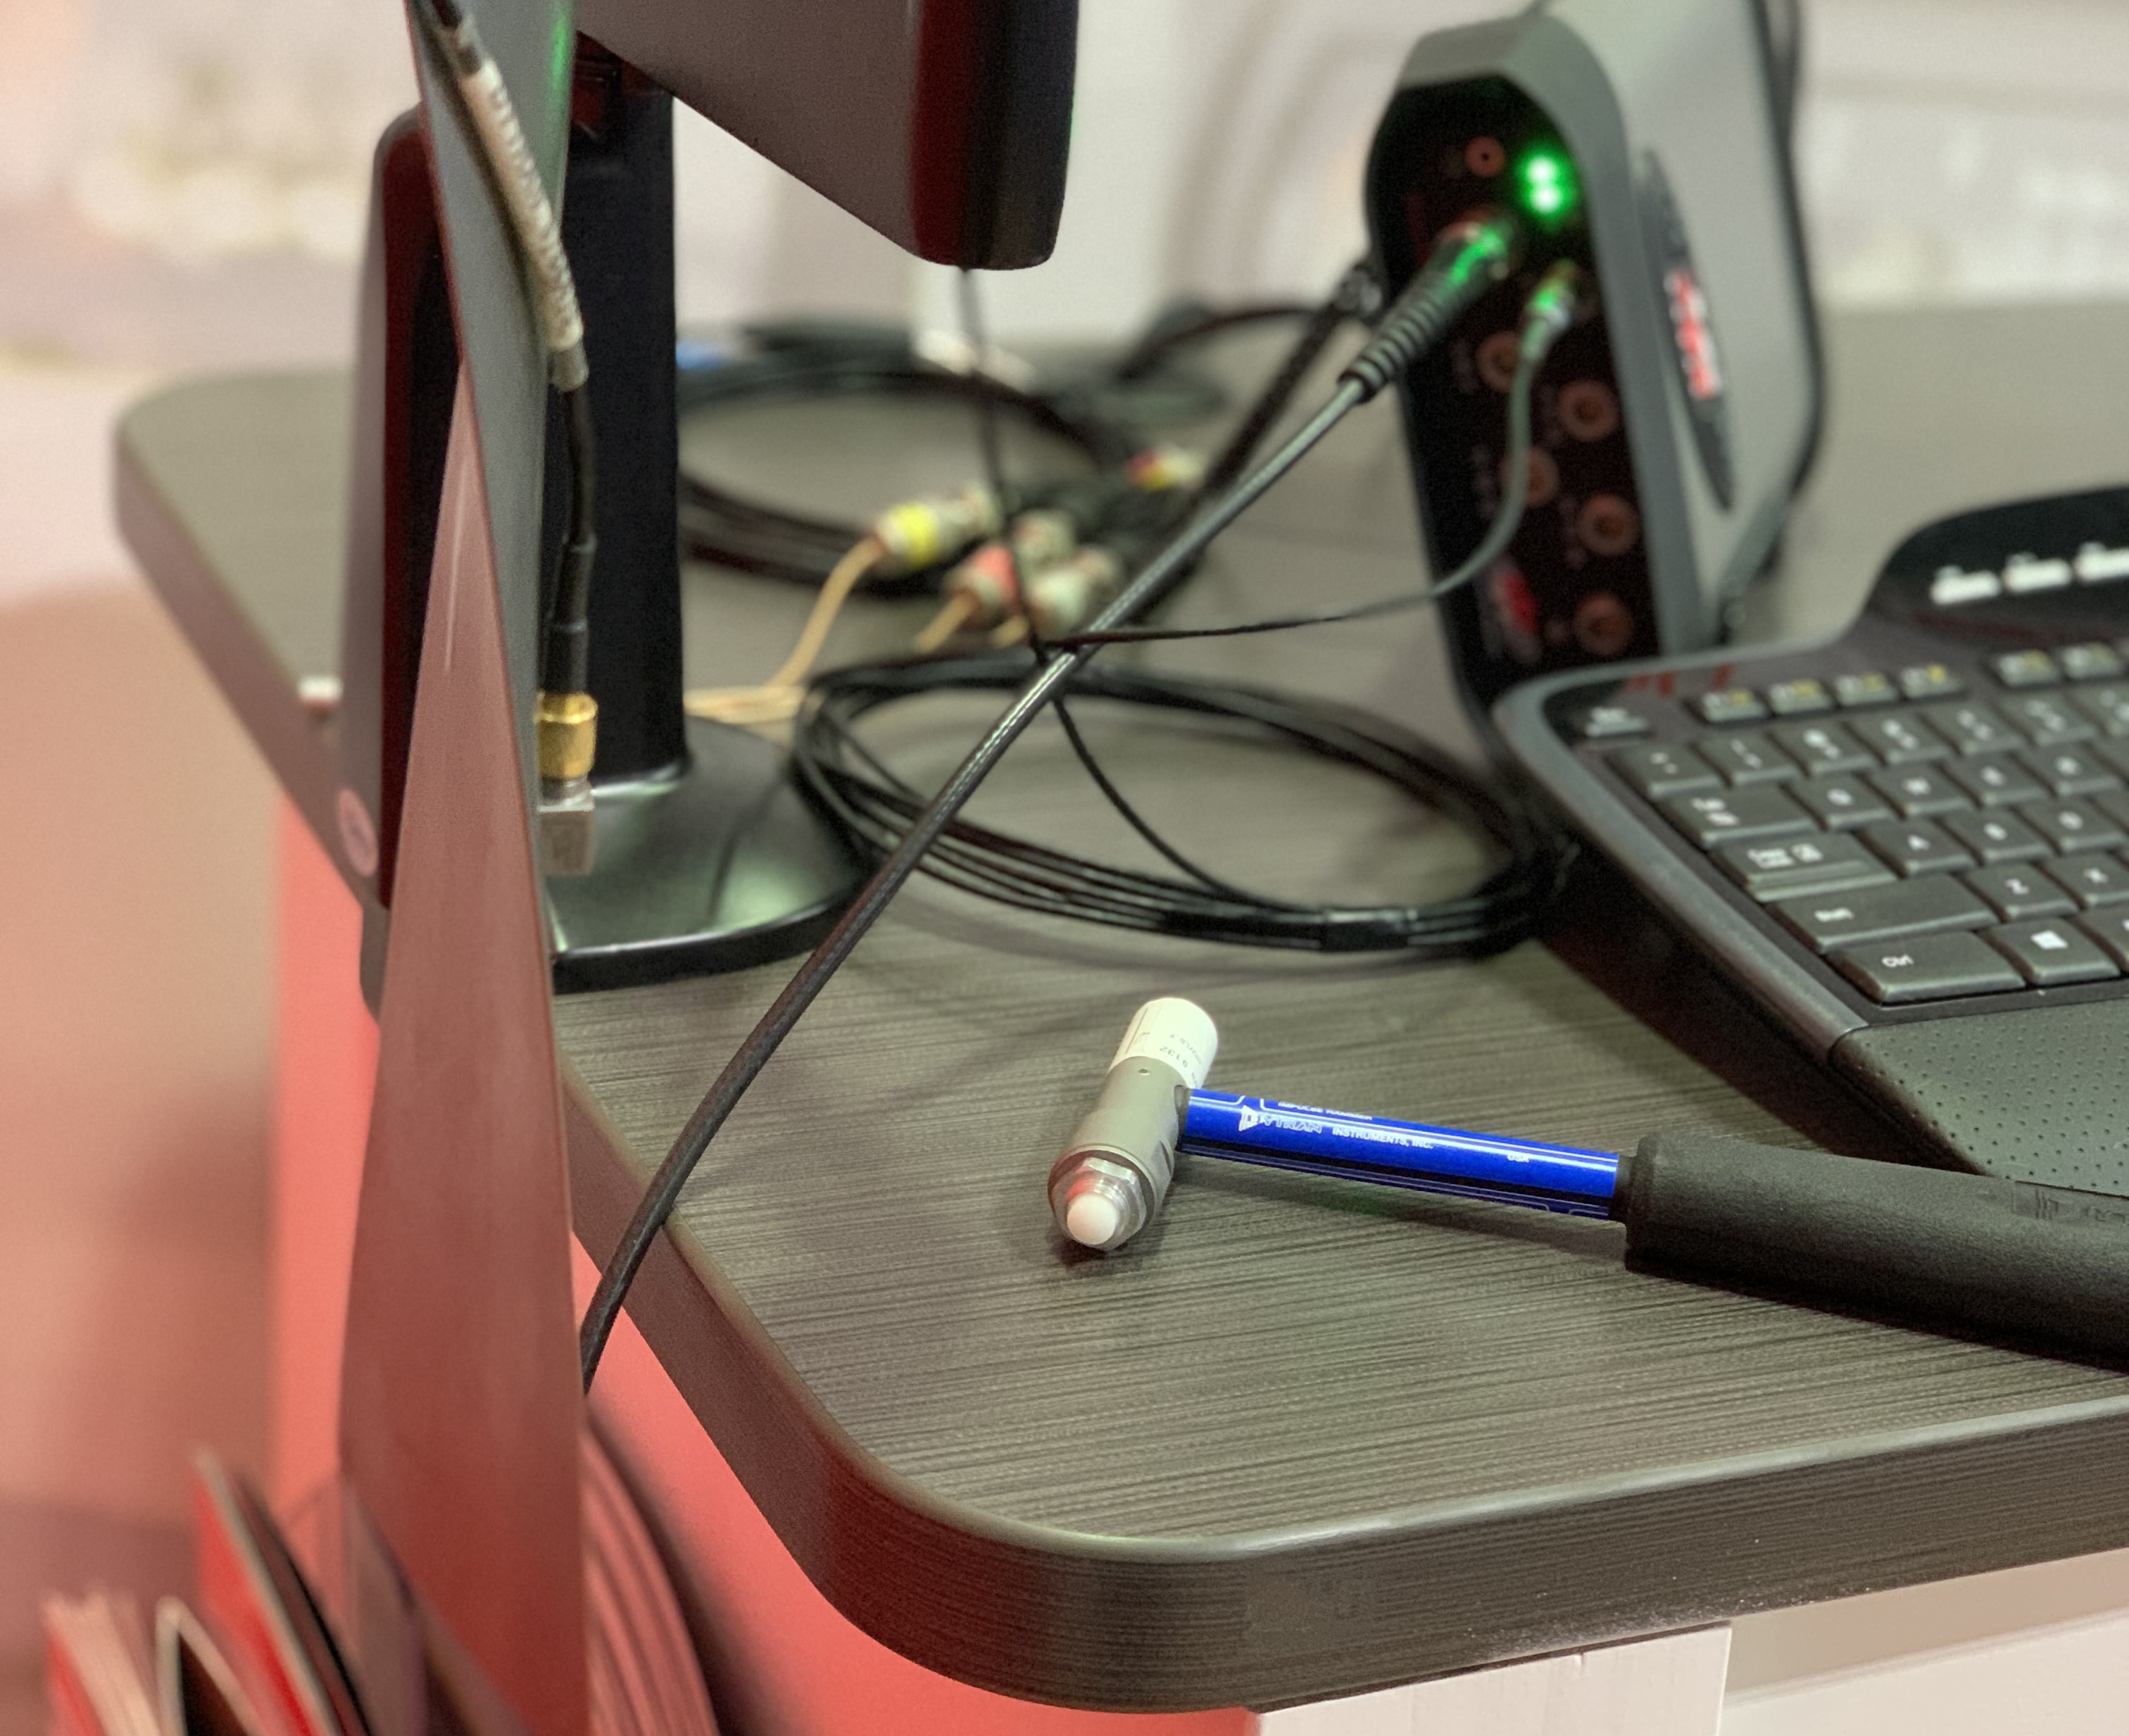
A modal test setup includes a device to generate the excitation, transducer(s), and a data acquisition system. The structure is subject to an impact, the transducers attached to the structure record the response, and the output signal is sent to a dynamic signal analyzer such as the ObserVR1000.
Double-hit Detection
ObserVIEW employs automatic double-hit detection. If there is a second peak in the input that is a certain percentage of the main peak value, it is considered a double hit and rejected automatically. The user defines the percentage value per their own requirements.
Advanced Project Types
The Modal Testing software includes an advanced project type that allows the user to define the number of response and reference locations and select different response locations/directions for each reference. The user can collect fewer responses and generate mode shapes quicker with the ease of roving the hammer.
Shaker-driven Modal Analysis
Engineers can generate modal excitation with a shaker rather than an impact hammer. There are two methods of doing so with an ObserVIEW system:
Create an open-loop output from the ObserVR1000 to the amplifier
Use a separate controller with sensors connected to Live Analyzer inputs
After generating a transfer function with phase and coherence graph, the traces can be exported as a UFF. The export will include the transfer function data, sensor locations, and axis descriptions for use with modal simulation software.
For more information about a shaker modal setup, please contact support or your VR sales representative.
Record Responses & More
Capture transient events with an ObserVIEW system, and access a comprehensive suite of features for additional data recording, editing, and analysis.
ObserVR1000
Modal Testing in ObserVIEW
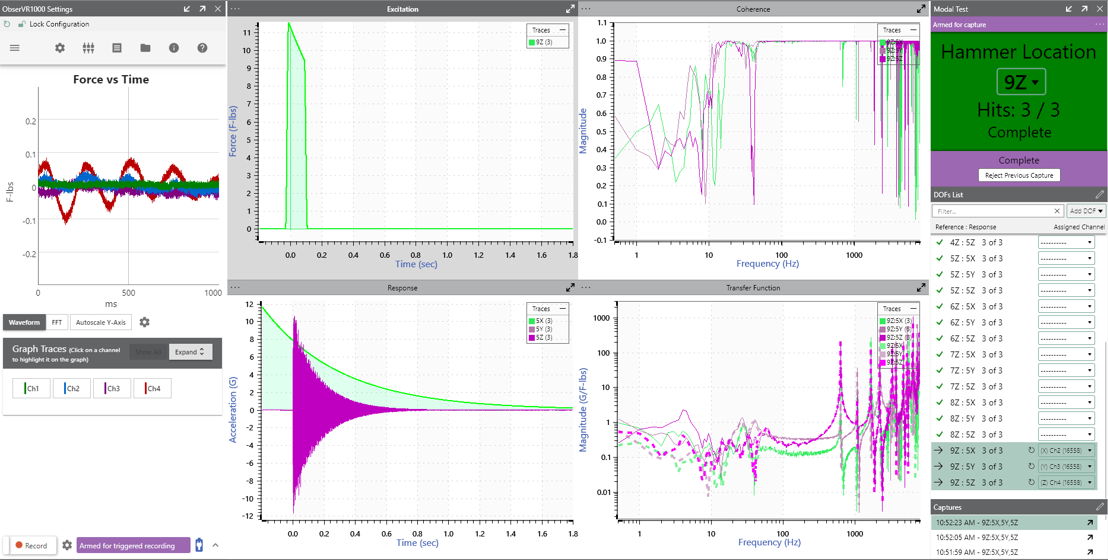
In ObserVIEW, the Modal Testing software collects responses to excitation with an impact hammer. The program calculates an average response for each hit location and generates a smooth transfer function (FRF). From there, the data can be exported to a modal software such as MEscope for further analysis. ObserVIEW can also collect modal responses from shaker excitation.
ObserVIEW reads RPC® and RSP time waveform files and supports pasted traces. Organized transfer function data are exported to a UFF or another modal data format.
With Modal Testing in ObserVIEW
Manage table of hits per location and review hits
Average multiple data acquisitions
Calculate decay rate from transient ring-down events
Manage the acquisition channel using a large, interactive display
And more
Identify Resonant Frequencies
Engineers seek to understand a structure’s natural vibration frequencies and its response to excitation. If an external vibration aligns with the structure’s natural vibration, resonance will occur. If unaccounted for, the natural vibration will be amplified and result in structural fatigue or damage.
When a structure is excited at its natural frequency, the resulting vibration creates different mode shapes that help describe the vibration.
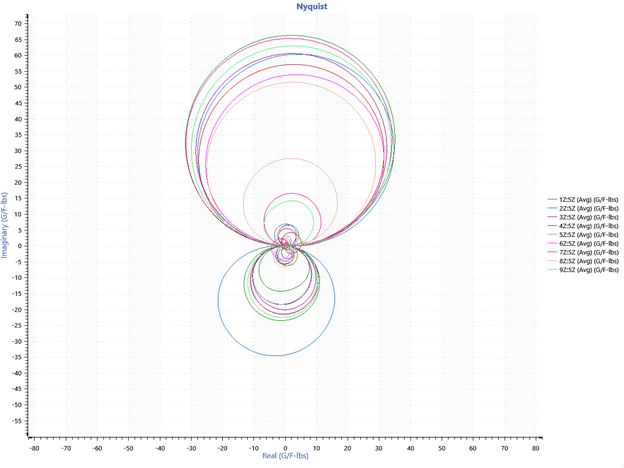
Assess the Stability of a System
Add a Nyquist plot to view transfer function data as a scatter plot.
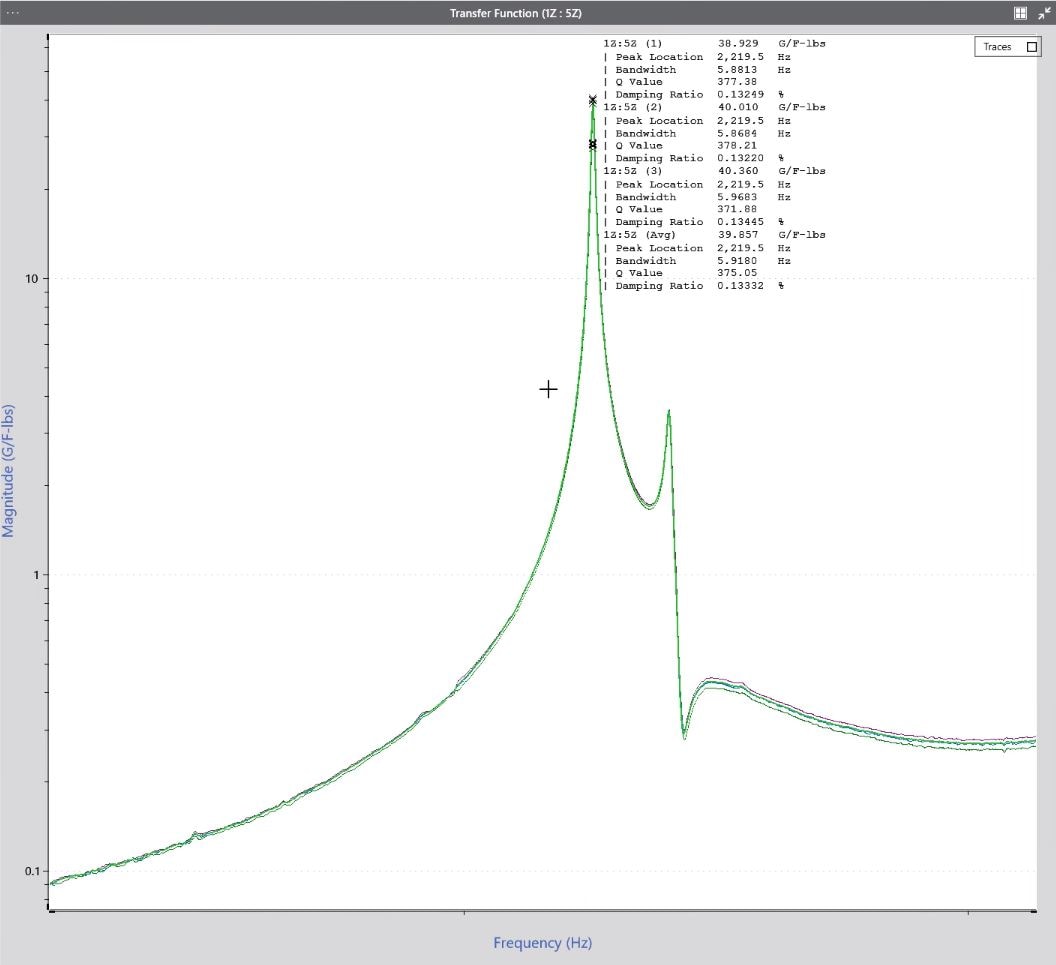
Generate an FRF
For a linear and time-invariant system, a transfer function defines some ratio of the input force and output response over a set frequency range. Frequency response functions are complex transfer functions with real and imaginary parts, which can be represented by the structure’s magnitude and phase response.
Engineers use the FRF to identify the frequencies most sensitive to excitation. These dominant frequencies are the basis of the structure’s individual modes.
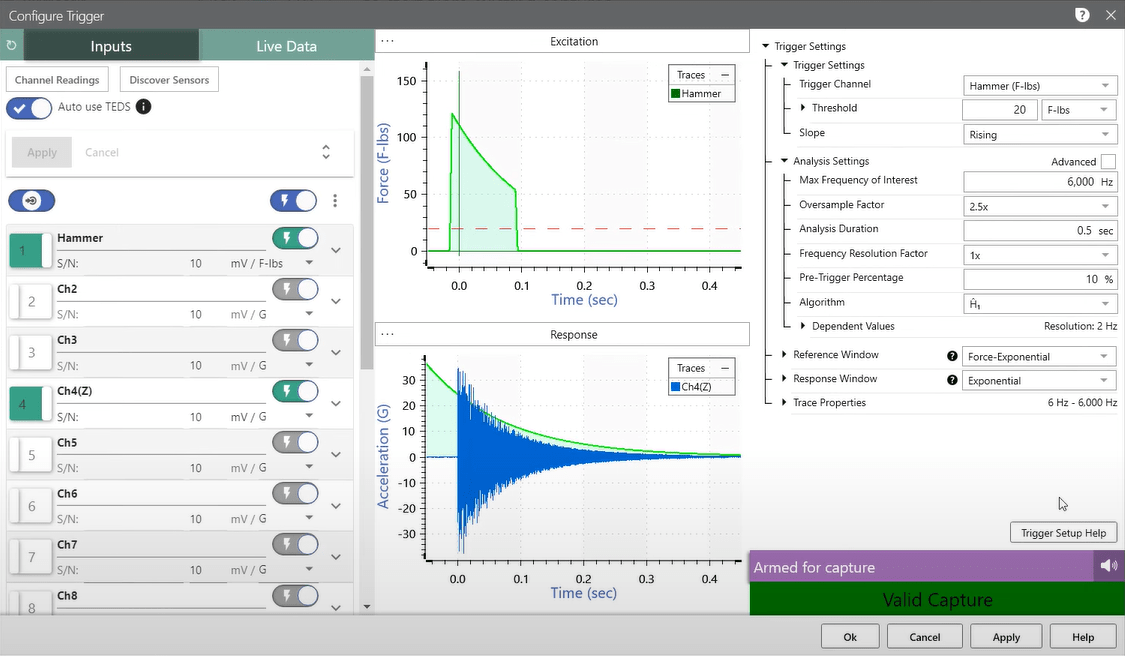
Defining Modal Parameters
An experimental modal project calls for several parameters that the engineer can configure ahead of time or modify after they have created the project.
Vibration Research found that the standard approach to defining modal parameters was time-consuming, particularly for those running basic modal tests. Rather than manually fine-tuning the parameters, the engineer can define those that represent the test’s purpose, such as maximum frequency of interest, oversample factor, and analysis duration. Learn more.