Vibration in the field is not always solely random or sinusoidal but a combination of vibration types. Mixed-mode vibration tests, such as sine-on-random, replicate these types of complex vibrational environments in the lab. When should an engineer use sine-on-random testing in place of, or in addition to, a sine or random vibration test?
Article Overview
- Definition of Sine-on-Random (SoR) testing
- Comparison to standard PSD random testing
- How advanced controllers process SoR tests
- Typical applications of SoR in aerospace and other industries
- Guidance on field data identification
- Overview of test profile creation tools
Sine-on-random software in VibrationVIEW.
What is Sine-on-Random Testing?
Sine-on-random (SoR) is a mixed-mode vibration test that runs both sine and random vibration. One or multiple sinusoids are superimposed on a random test profile, and the control system outputs the signals to the shaker table at the same time.
Watch: Sine-on-Random Test Startup
Why Sine-on-Random?
In the real world, sinusoidal and random vibrations often coincide. However, the testing industry considers random vibration tests more realistic because most vibration is not predictable like an oscillating sine wave. Therefore, random vibration tests are the go-to for product testing, while sine testing typically has pre-test applications like preventative maintenance and resonance search.
So, why introduce a third option?
A vibration test should always reflect the field environment as closely as possible. There are environments that include significant sine and random vibration. If a product primarily experiences random vibration but has sinusoids with considerable acceleration (g) levels, then the engineer should also include the sine tones.
Sine waves oscillate with a consistent frequency and amplitude and typically derive from components with repetitive or rotational motion, such as a pump or rotor. In some circumstances, the sinusoidal vibration is minimal and therefore less critical to the overall test. In other cases, the sinusoidal vibration impacts the random background vibration and should be recognized as a necessary part of the test profile.
Why use SoR Rather than Importing a PSD Profile?
The power spectral density (PSD) assumes that input data are stationary and random.
If data are stationary, the frequency content must be unchanging over time. In other words, the engineer can compute an FFT at any point in the waveform and get the same FFT spectrum (ignoring variance due to randomness).
If data are random, the amplitude at each frequency must randomly vary with time. Again, if the engineer computes an FFT at any point in the waveform, they should get approximately the same amplitude at each frequency (again, ignoring variance from randomness).
The PSD takes these assumptions and creates a clean vibration spectrum by averaging away the random variance. The same assumptions are applied when a system plays back a PSD on a vibration shaker. The input is stationary and random, so the drive signal to the shaker must also have these characteristics.
Data with sine tones that change in frequency over time are not stationary. The PSD will pull down the sine tone amplitude when the algorithm averages it with the random waveform. The energy of the PSD preserves the energy of this sweeping sine tone but not its damaging peak amplitude.
When a random test runs this averaged spectrum, it averages down the damaging peak amplitudes of the sine tones. Additionally, these amplitudes are randomly varied over time, which prevents the sine tone from causing high-amplitude damage to a DUT.
Therefore, a PSD cannot properly analyze a sine tone, and a random test cannot properly recreate the damaging concentrated high amplitude of a sine tone.
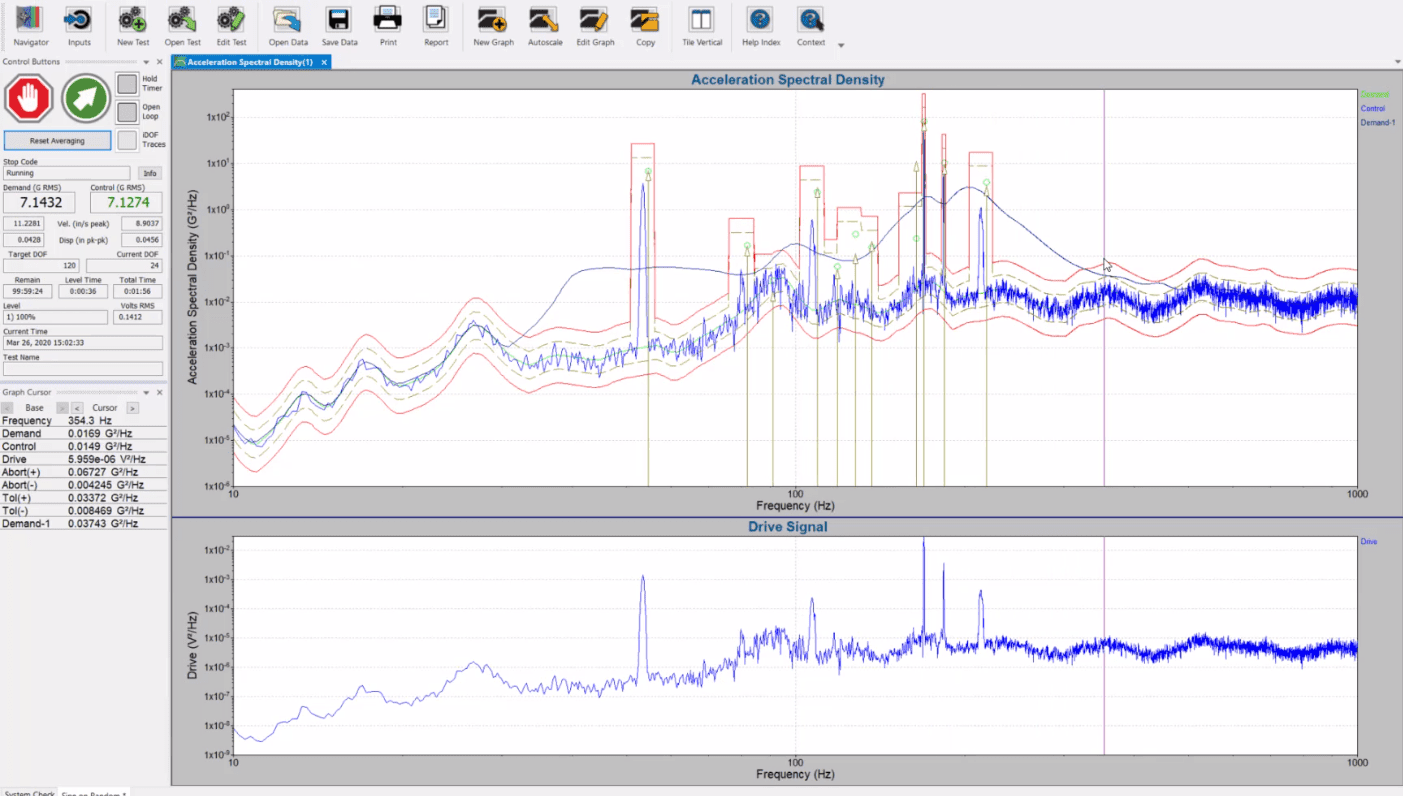
How Does VibrationVIEW Display an SoR Test as a PSD?
Modern controllers can make accurate PSD calculations during SoR tests because they output the sine and random signals and can identify the frequency of the sine tones. As an SoR test’s sine tones occur at defined frequencies, the controller can include them in the PSD plot, not the PSD average.
Some controller manufacturers modify the drive signal to notch out the frequencies where the sine tone has swept through. This approach provides a smooth PSD plot in a short time but removes random background vibration. It under tests the SoR frequency range because it removes the random background on each pass behind the sine tone.
The VibrationVIEW control system forestalls while the controller runs through the sine sweep and then picks up with some of the averaging before the sine tone (for example, 50 frames before). The averaging needs to collect enough data to present a smooth trace. Still, the system accurately removes the sine tone energy from the frequencies it passes through without modifying the defined random background vibration.
Sine-on-Random Example Application

All in-service aircraft, including fixed-wing, rotor, or rocket-propelled, have an inherent base random energy. A sinusoidal vibration is also present at various frequencies, typically from the turbine engine or rotor blade.
The quality and longevity of most aircraft components will benefit from mixed-mode testing. Instruments, connectors, batteries, and other conventional components are subject to sinusoidal and random vibrations simultaneously, and these vibrations can result in fatigue and, eventually, failure. As such, SoR is an ideal test method for many aerospace applications.
A helicopter gunfire test is a typical and, perhaps, extreme application of SoR testing. The helicopter is subject to random vibration throughout its flight, and the gunfire introduces a very noticeable high g sinusoidal vibration. Components that have only gone through one test method may, at first, appear to be able to withstand this new environment created by gunfire. However, the mixed vibration environment will fatigue the component faster than the lab test. As the SoR testing method better represents real-world conditions, it is the preferred test procedure.
How to Identify Sine Tones in Field Data
To determine if field-recorded data has significant sine tones:
- Use a harmonic cursor on an FFT to find peaks that are harmonically spaced. This spacing is an indication of sinusoidal content.
- Use a spectrogram to identify strong sine tone peaks that vary over time. These tones are easy to identify because they have a consistent amplitude relative to the surrounding frequencies.
- Use a tachometer to record the RPM of a motor versus time. This RPM trace is typically the first-order harmonic of sine tones in field data.
Engineers should always test sine tones using a sine test mode because the test should match the type of time waveform data occurring on the DUT. Sine tones focus energy into a sharp point at a single frequency, whereas random data spreads energy across a frequency spectrum. Both have equivalent energy in this case, but the sharp single-frequency energy of a sine tone is more damaging and realistic than random.
Shaker Profiles
There are two approaches to consider when creating an SoR test profile. First, you can run the test according to the MIL-STD-810H specifications. This military standard is applicable and easy to use whether the device under test is for a military or civilian application, as many of the test articles are the same or similar.
The second approach is to record field data and then use analysis tools to build a realistic test profile. Modern vibration data recorders have simplified the process of collecting data from the field. However, the subsequent process of data analysis can be complex and time-consuming. To address customers’ difficulties with the analysis of rotational components to create an SoR test, Vibration Research developed the Sine Tracking, Analysis and Generation (STAG) software.
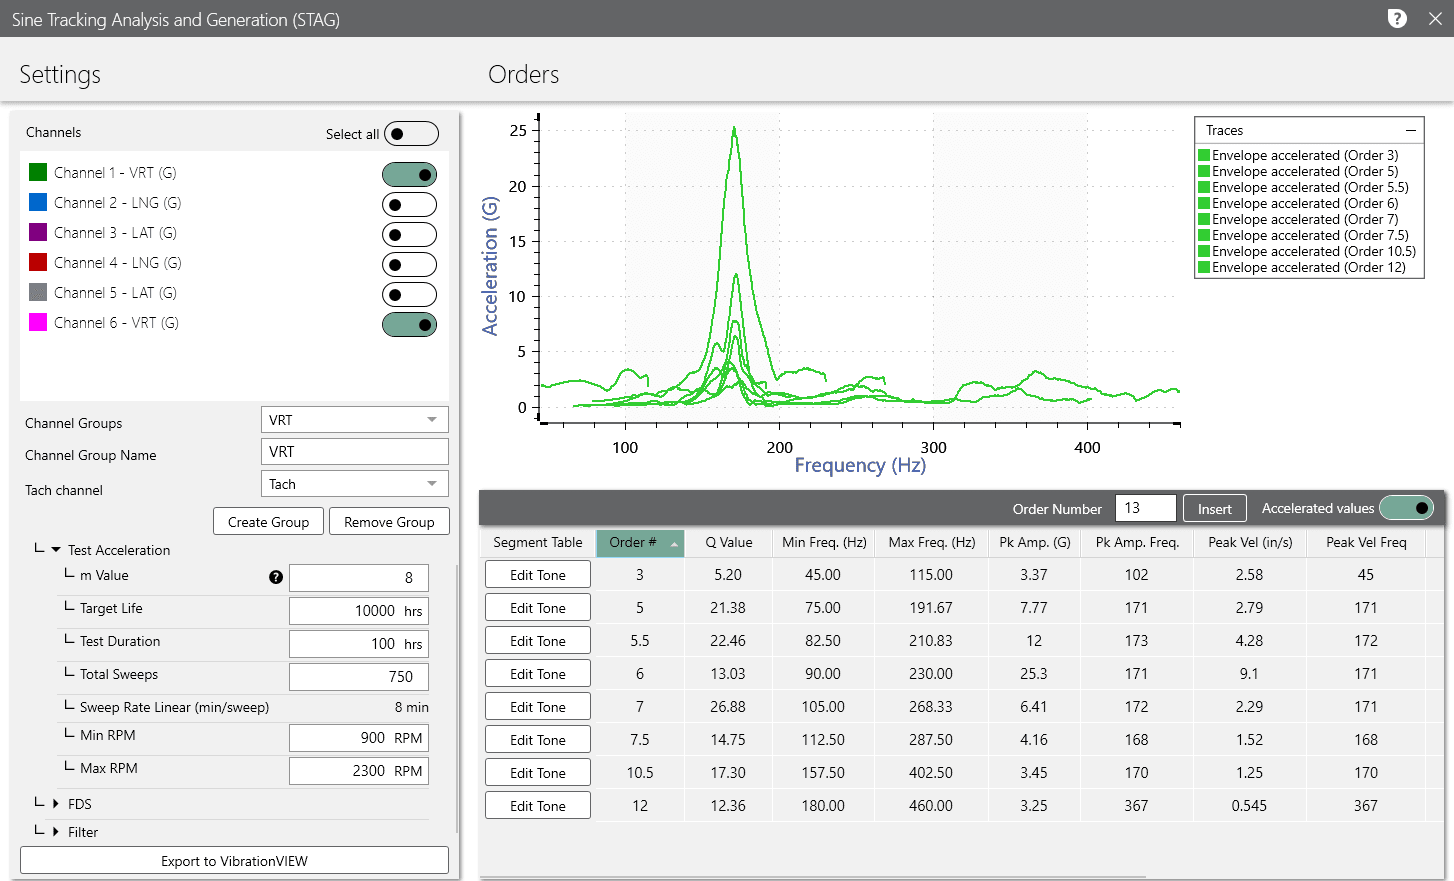
STAG Software
STAG uses order analysis and extraction and sine tone profile creation and acceleration to isolate, extract, and create an accelerated sine profile or series of sine profiles from a recording. It uses the Fatigue damage spectrum (FDS) to analyze the remaining random vibration. In combination with the FDS, STAG allows for the analysis, generation, and acceleration of a realistic SoR vibration test.
Sine-on-Random in VibrationVIEW
Sine-on-Random testing bridges the gap between standard random vibration tests and complex, mixed-mode environments that many systems encounter in the field. By superimposing sine tones onto random vibration, SoR maintains the potential damage of narrowband excitation while preserving the realistic background random energy.
Using the Sine-on-Random software, engineers can generate sine and random vibrations to simulate the field environment of a device under test where both modes are present. One to 32 floating-point precision sine tones can be superimposed on the random background spectrum and swept back and forth between frequencies at a user-programmable rate. Sine-on-Random is one of the three mixed-mode testing modules in VibrationVIEW.