In VibrationVIEW 2023.1 and newer, access an analyzer program that creates a 3D waterfall plot from random vibration data files or live data.
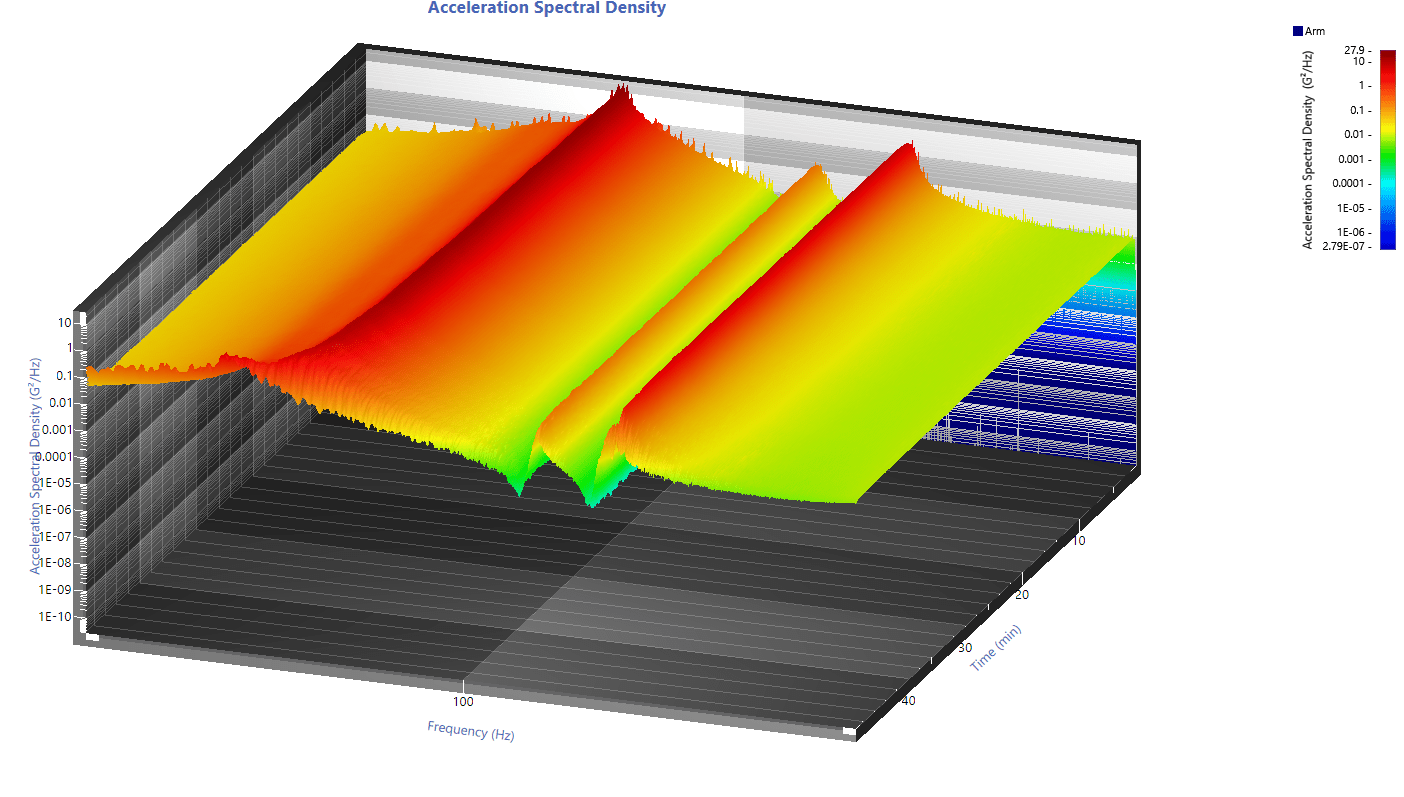
3D view of an acceleration spectral density.
The graph runs alongside the current VibrationVIEW test in a separate window. It can display a 2D color map of a power spectral density (PSD) waveform or a 3D waterfall graph/color map spectrogram of a PSD waveform. Currently, this graph option is only available in the Random test mode.
The 3D program takes “screenshots” of PSD data at a set interval throughout the test. The software saves data every x seconds or minutes to create these PSD slices. The 3D graph will begin with no saved data until the test runs. The technician can monitor the data files and update the analysis as the test runs/saves new files.
To plot data as a waterfall, right-click the trace and select the Make Waterfall Graph option.
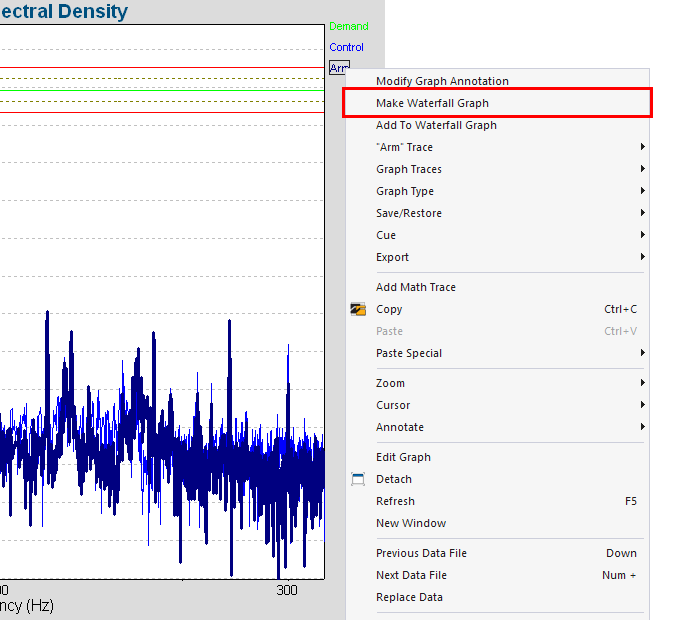
Make Waterfall Graph menu option.
Although the 3D program only runs in version 2023.1, the user can upload Random test data files from previous versions to create a 3D graph from stored data.
Why 3D?
Technicians can use a time spectrogram graph to more easily visualize critical frequencies, particularly when the environment is changing. As a waterfall shows the change in frequency over time, the waterfall plot usually provides more information about the overall test than an individual trace.
A time-frequency waterfall graph may be beneficial when:
- Measuring the changes in vibration as a machine load changes
- Identifying resonant behavior over time or a fundamental bending mode frequency
- Seeking to maintain constant conditions
- Monitoring shifts in resonant frequency
Example
The following acceleration spectral density displays an aluminum beam’s output after the technician ran a random test until the beam broke.
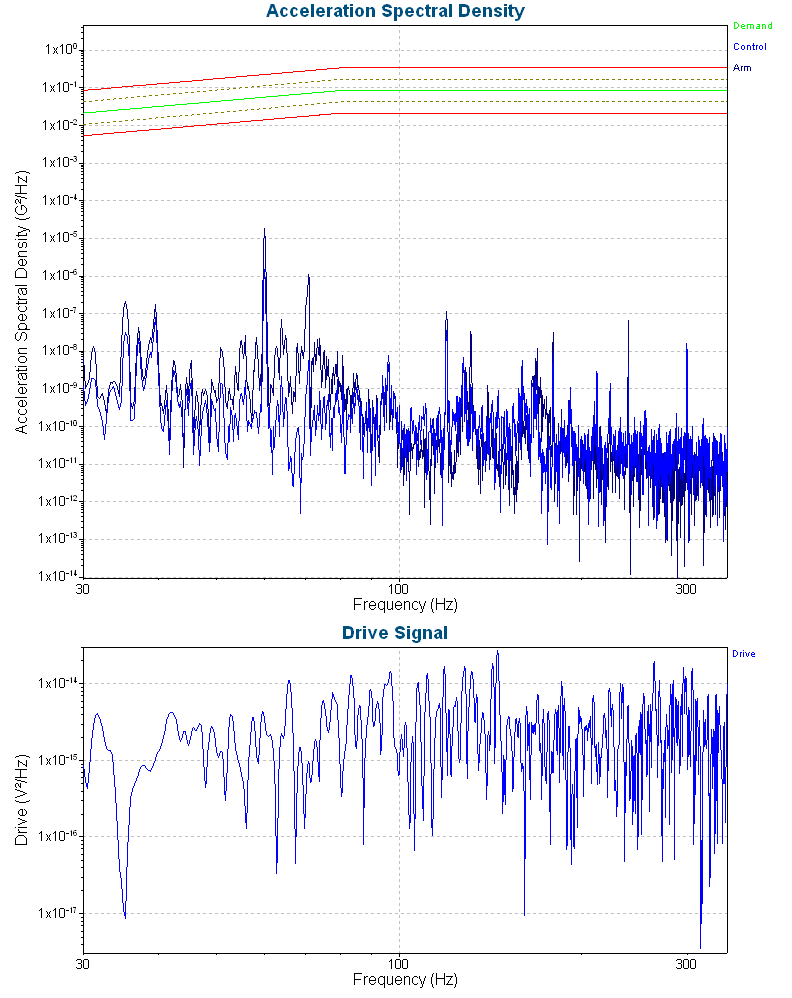
ASD of aluminum beam failure during a random vibration test.
It is difficult to identify a shift in resonance over the duration of the test. However, we can easily visualize the resonance shift if we take a horizontal cross-section of the spectrogram.
Functionality
This analyzer program uses the ObserVIEW software to generate graphs; however, it runs independently from the software and does not require ObserVIEW licensing or activation. The graph will reflect the trace colors and style, graph units, and trace labels set in VibrationVIEW. If a change is made to one of these settings in VibrationVIEW, it is pushed to the graph without data loss.
Features
- Supports logarithmic, linear, and dB spacing for the X and Y-axis
- Can display four spectrograms in the same window
- All existing VibrationVIEW .net calls work in the program, including email notifications and navigator
- Supports multiple channels
- Standard cursor displays frequency, time, and amplitude at any point on the graph
- Add additional cursors such as harmonic, resonance, min, max, and RMS
- Multiple options for viewing data
What is a Spectrogram?
A spectrogram displays the strength of a signal over time at defined spectrums of frequency.
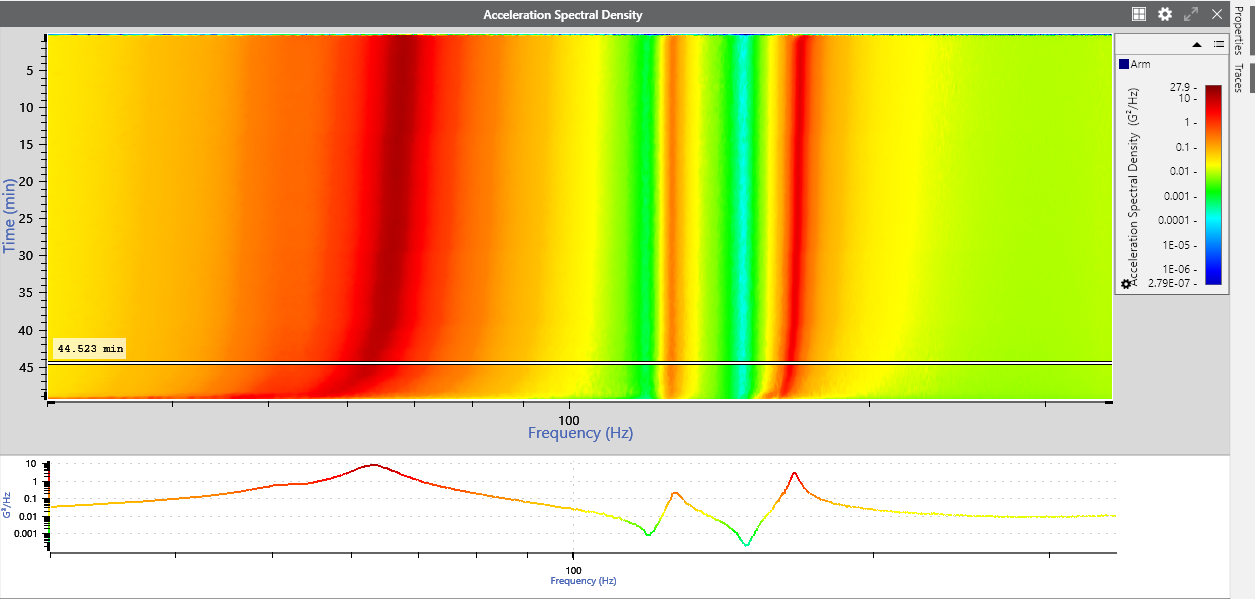
A spectrogram in the VibrationVIEW analyzer program.
A time-domain signal is divided into shorter segments of equal length, and the fast Fourier transform (FFT) is applied to each. The FFT is an efficient algorithm that projects continuous time-domain data in the frequency domain, and the spectrogram is a plot of all the segments’ frequency spectrums. The time domain represents time, and the frequency domain represents the Fourier analysis of the time-domain response.
Then, the software can calculate the PSD from the FFT for each frequency spectrum. The PSD is a common random vibration analysis tool that reveals resonances and harmonics hidden in a time-history graph.
Spectrograms can be two-dimensional graphs with a third variable represented by colors or three-dimensional graphs with a fourth color variable. In 3D, the spectrogram graph may be referred to as a waterfall plot. The scale of change in acceleration is often more evident in a waterfall plot than in a 2D spectrogram.
The spectrogram in this analyzer program includes horizontal and vertical cross-sections to examine a slice of all data at a specific time or frequency. It also supports the available cursors in ObserVIEW.
Reporting
VibrationVIEW has default templates for quick reporting but also supports comprehensive and user-friendly custom reporting. Technicians can add a 3D graph to a custom report template. Additionally, they have the option to export all raw data to a CSV.