It can be troublesome to gather insight into a product’s response to a vibration test, especially if its design is complex. Frequency-dependent interactions can occur between the vibrations of multiple components, and the interactions can move across the three linear axes. Basic vibration graphs such as an FFT or PSD may hint at these interactions, but the details remain elusive.
Test engineers need a reliable way to compare vibration signals and understand their complex relationships. Ideally, they should be able to select multiple waveforms of interest and compare them using a simple, intuitive user interface.
The Analyzer software package is a tool designed to provide a better understanding of complex vibration relationships. The software enhances the Sine, Random, and Shock test functions by comparing the characteristics of two or more signals in a series of graphs. The graphical comparison makes significant relationships between waveforms readily apparent.
Advanced Graphing Functions
Transfer Function
The transfer function estimate defines the output that the system should produce from a given input. A graph of the transfer function displays the ratio of cross-spectra values for two signals in a defined frequency range. It also shows the phase relationship between the signals.
The transfer function graph helps test engineers determine if two signals are behaving similarly.
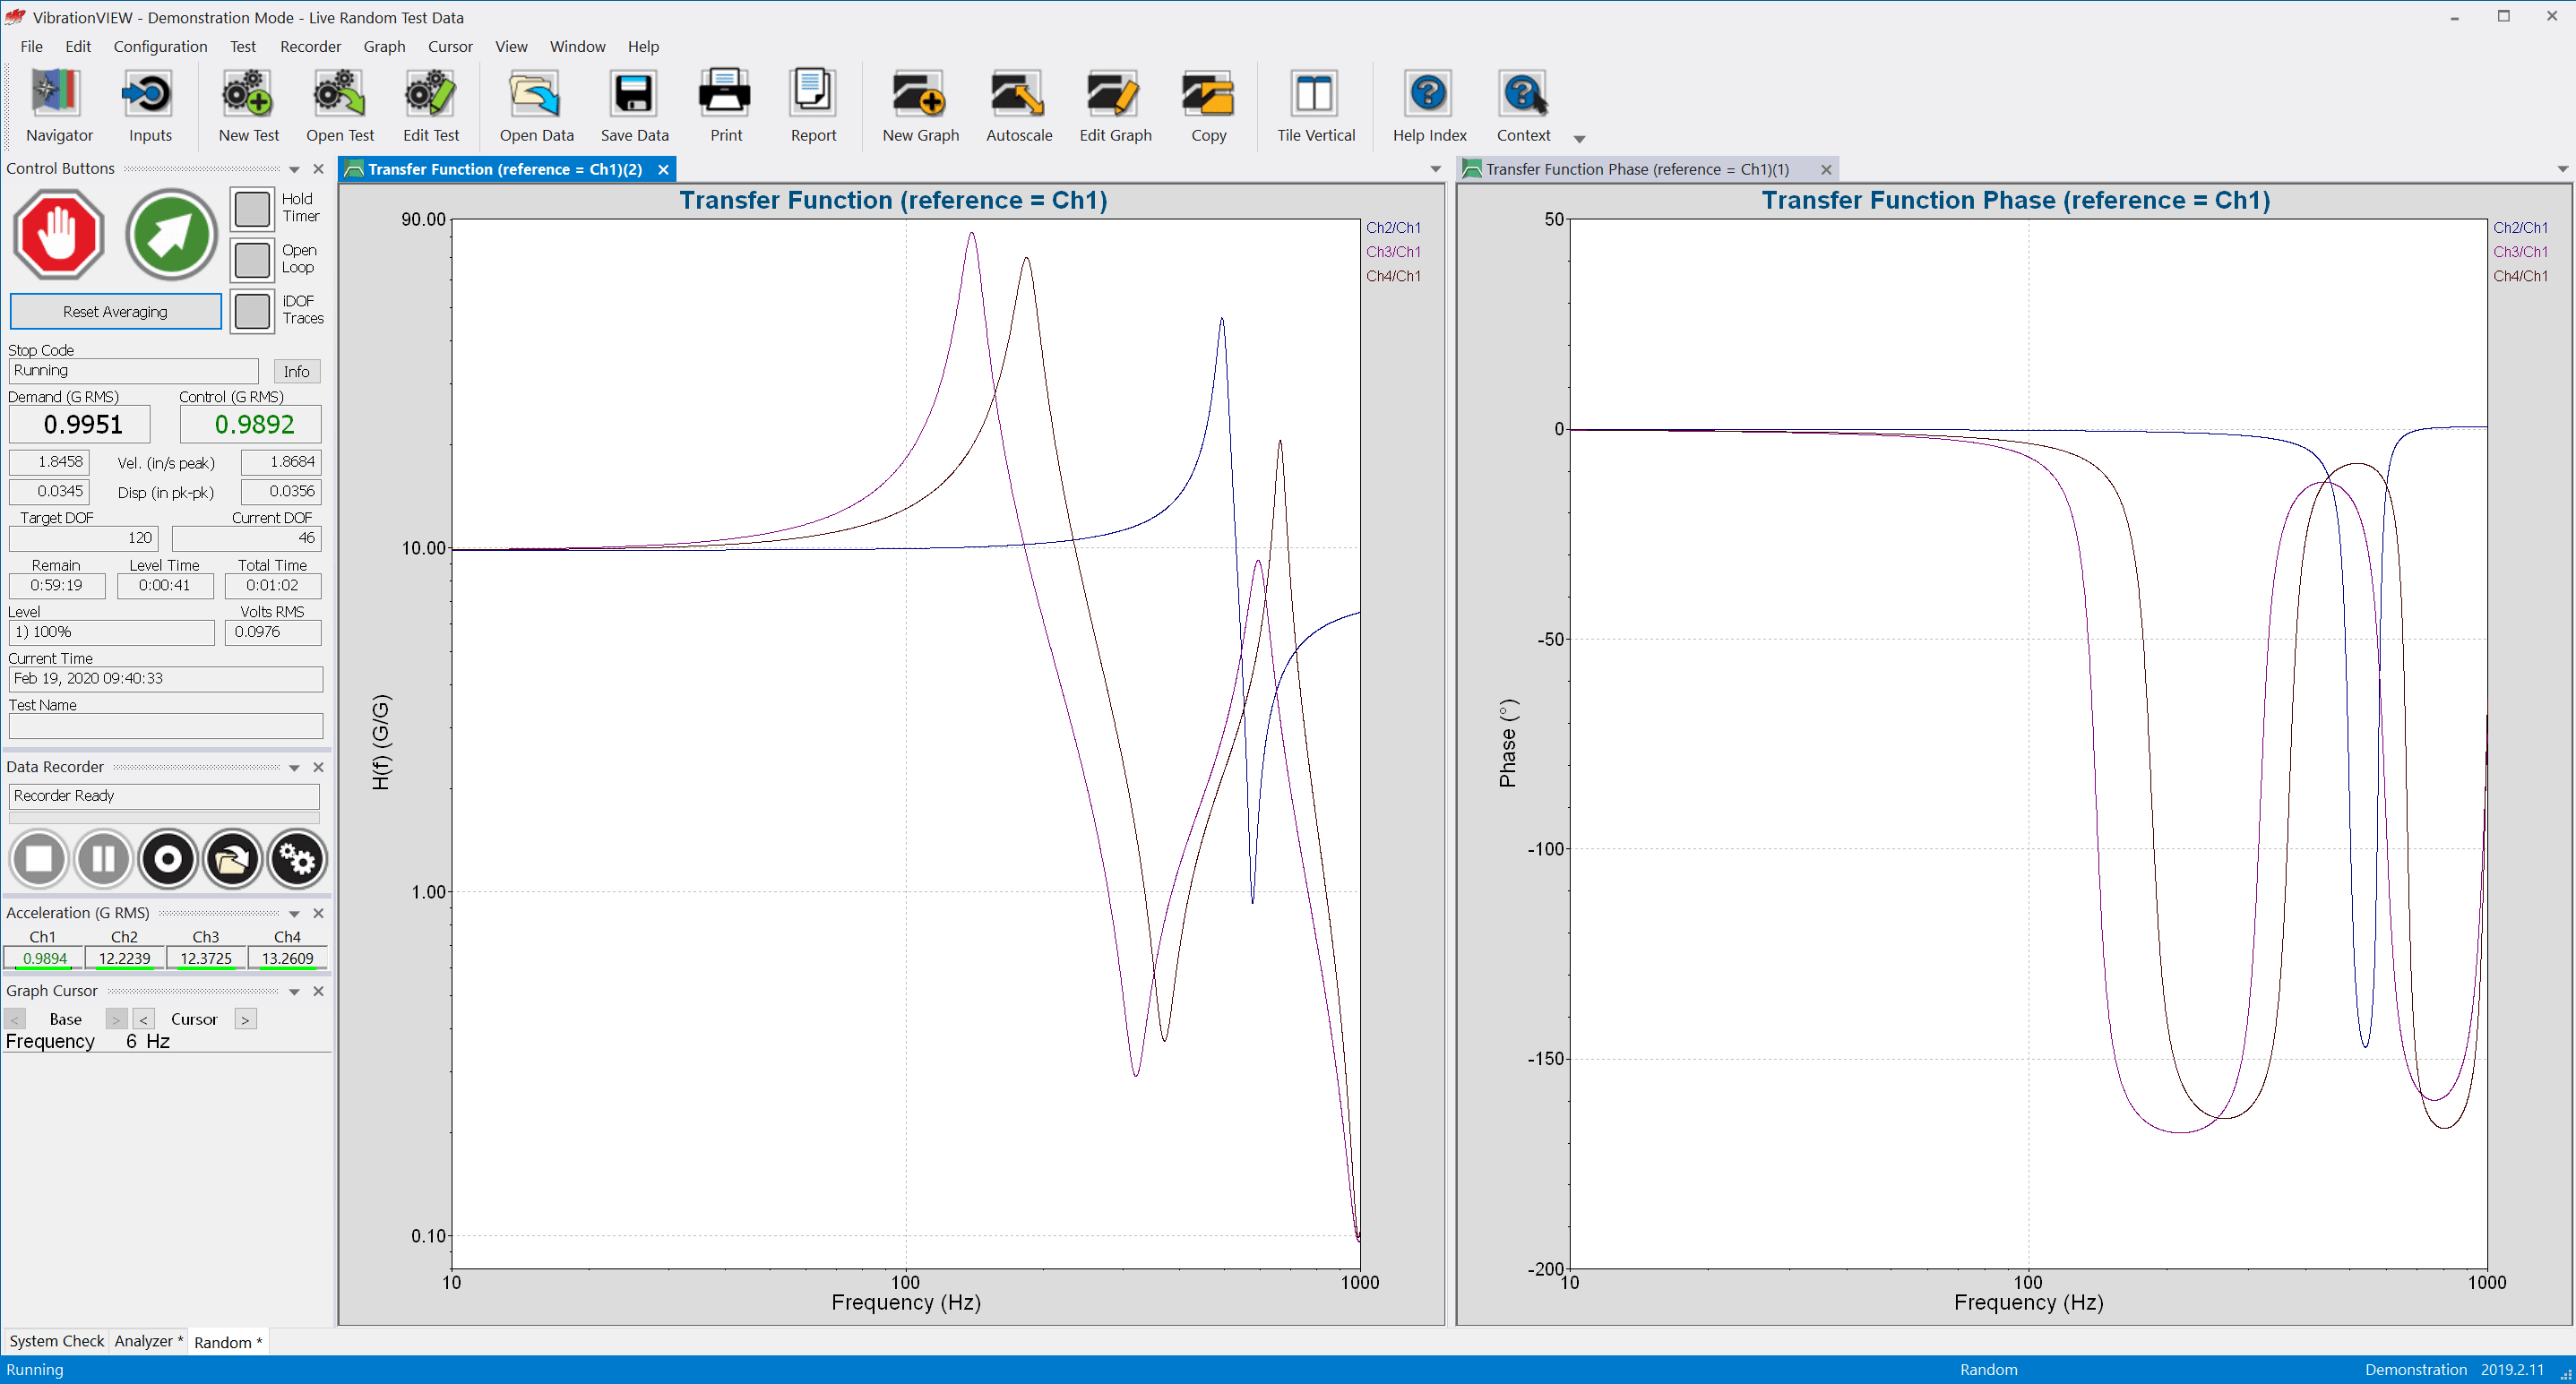
The transmissibility graph, available as a standard VibrationVIEW feature, also shows the PSD relationships between signals. The phase relationship graph is unique to the transfer function option.
Coherence
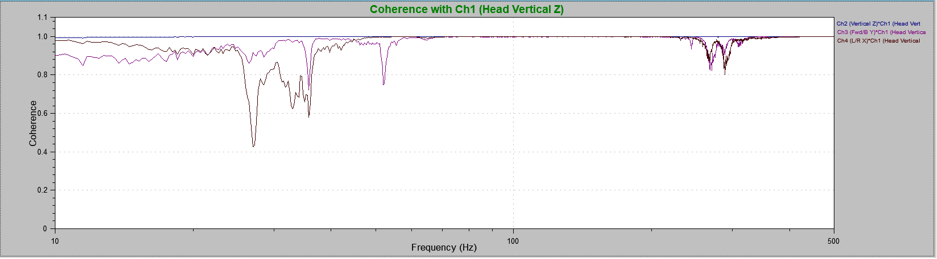
The coherence graph displays a statistical relationship between two signals at the same frequency. A coherence value of 1 indicates that the waveforms’ phase difference is consistent for one or multiple samples, and a value of 0 means the difference in their phase changes.
Coherence indicates if the phase difference changes for the defined frequency. This information allows the engineer to evaluate the relative motion between signals.
Cross-spectrum
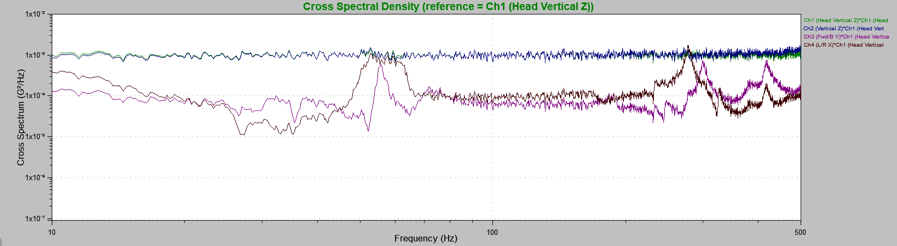
The cross-spectrum graph displays the cross-spectral density (CSD) for a signal pair. The value of the CSD indicates the influence of signal x in relation to signal y. The cross-spectrum graph is beneficial when looking for a relationship between two waveforms in a particular frequency band.
Total Harmonic Distortion (THD)
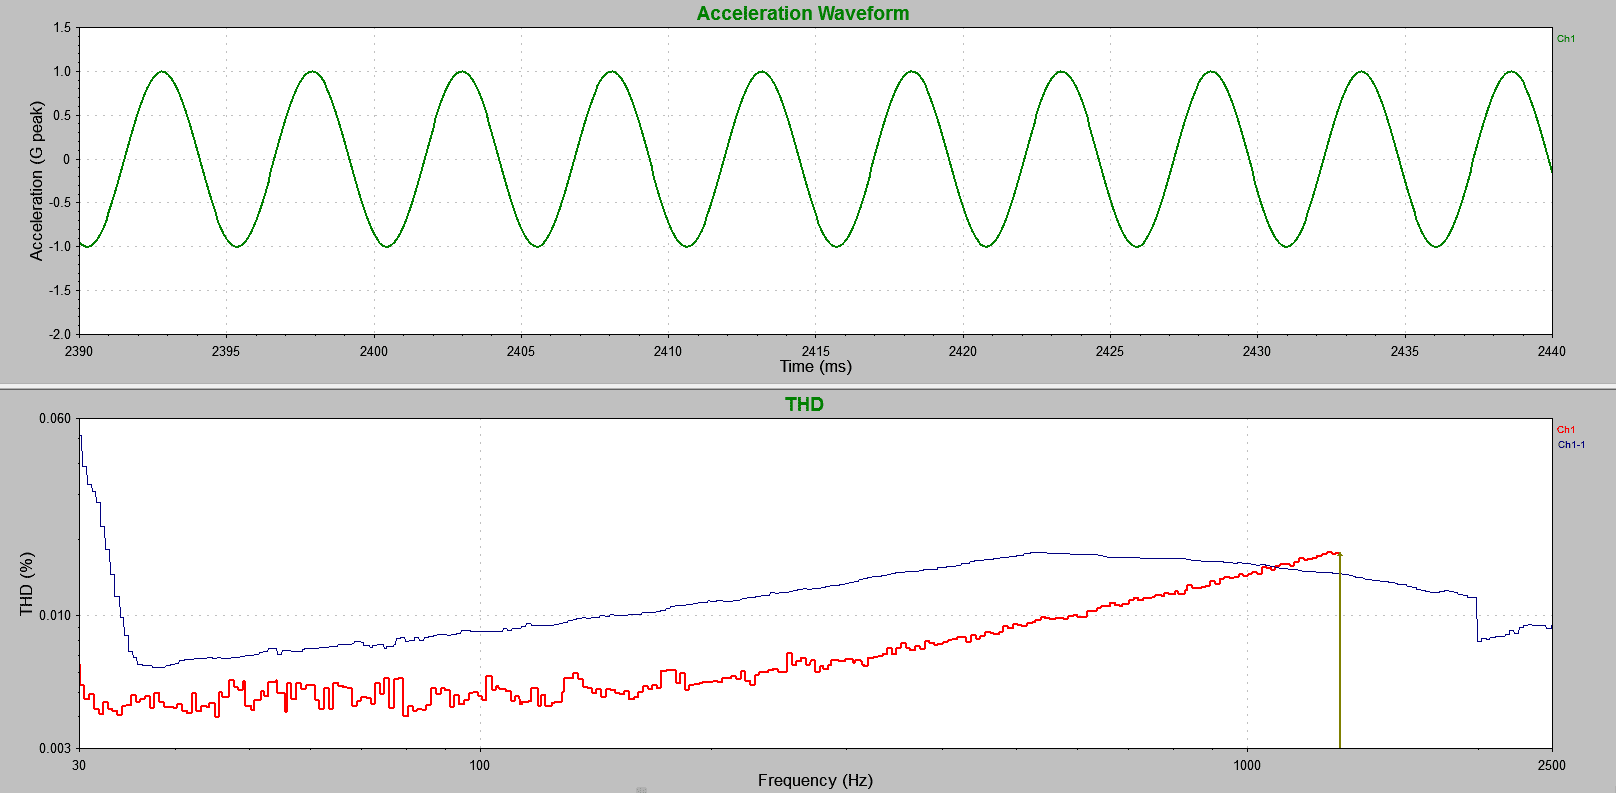
Total harmonic distortion (THD) measures the total harmonic content in a sine wave. When a signal passes through a non-linear device, additional frequency content is added to the harmonics of the original frequencies. THD measures the extent of that distortion.
Learn More
For an in-depth review of the Analyzer package functionality, enroll in our free VRU course on the software. To learn more about the software package, visit the software page.