At the start of 2022, the Vibration Research team set off in nine small groups to test the ObserVR1000 dynamic signal analyzer in real-world applications. The goal was to understand our product better in an operational setting and note any potential improvements. The groups presented their findings to the rest of the VR team. This series relays pertinent (or simply fun) information we found.
Comparing Damage of Different Calibers
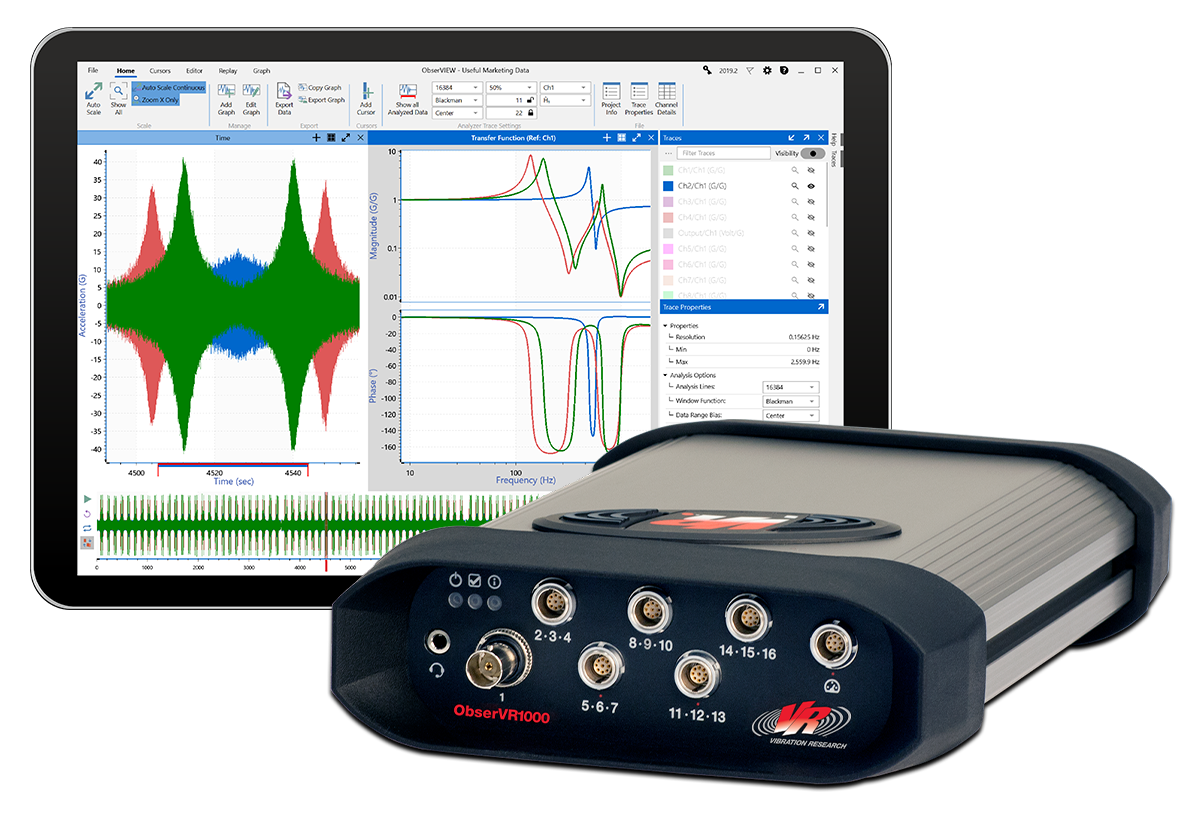
ObserVIEW Software: Multimedia Sync, SRS, FDS
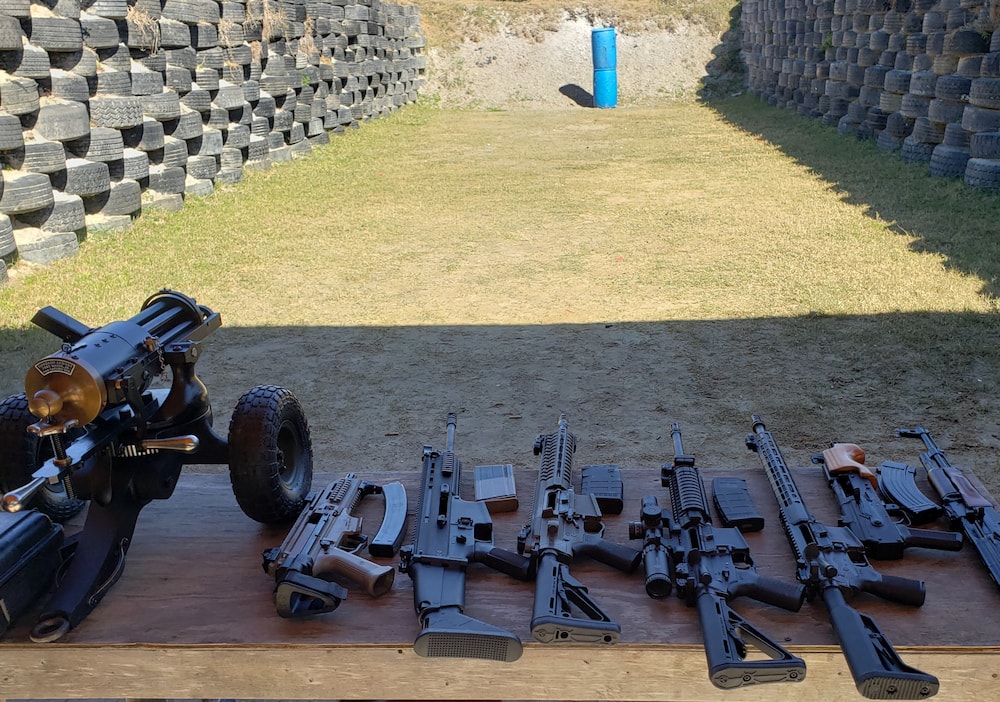
Group 6 selected nine firearms of varying types to test at a gun range: AR-15, AK-47, AR-10, M-16, MP5K, SCAR Heavy 308, Mini Draco AK-47 7.62, Gatling gun, 50-caliber rifle. Their goal was to compare data between automatic and semi-automatic guns in a range of calibers. The ones they selected reflected their need for variety. For example, the AR-15 and SCAR heavy are semi-automatic, and the MP5K, M-16, and Gatling gun are automatic.
Project Setup
The team made use of two ObserVR1000 data acquisition devices. The first was at the table where they shot the guns, and the second was down range near the target. It was beneficial to use two devices, as they were recording data in both locations. A long cable from the table to the target would have opened several opportunities for error.
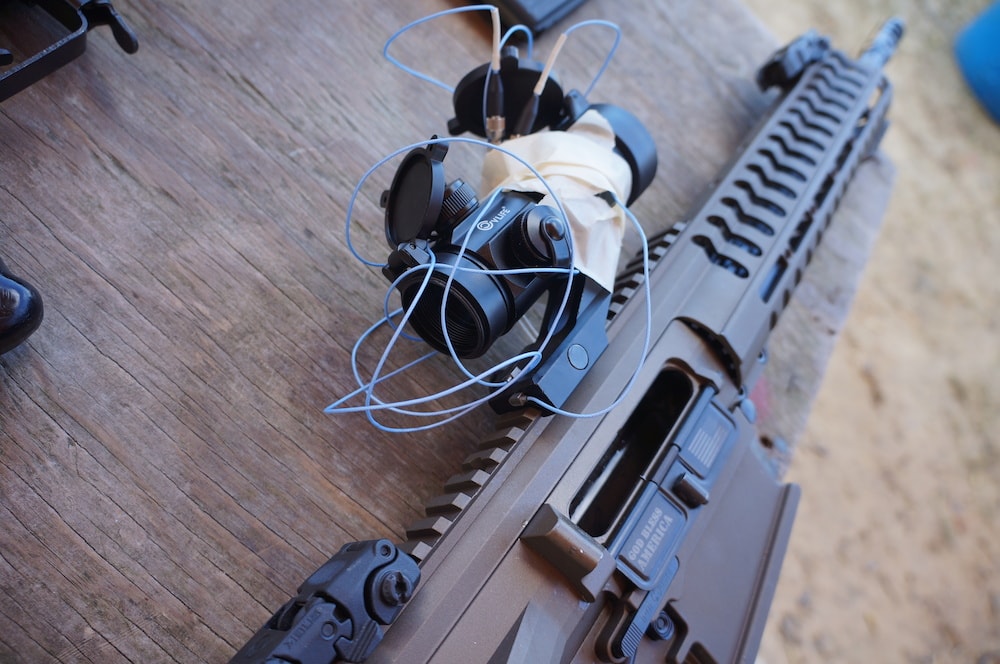
Single-axis accelerometers attached to the sight of a firearm.
Two single-axis accelerometers measured the shock response on the gunsight, which is an aiming device. The team used the same sensors for every gun, so they had to re-mount them each time they switched types. One triaxial accelerometer was attached to the target post.
Additionally, group 6 connected a GPS device to both units to synchronize the recordings (more on that later). A microphone and two Go Pros—including one on a drone—were recording as well.
Shock Response
In the ObserVIEW software, the team generated a shock response spectrum (SRS) graph with a trace for each gun. They were able to view all the recordings in one graph using the software’s overlay feature.
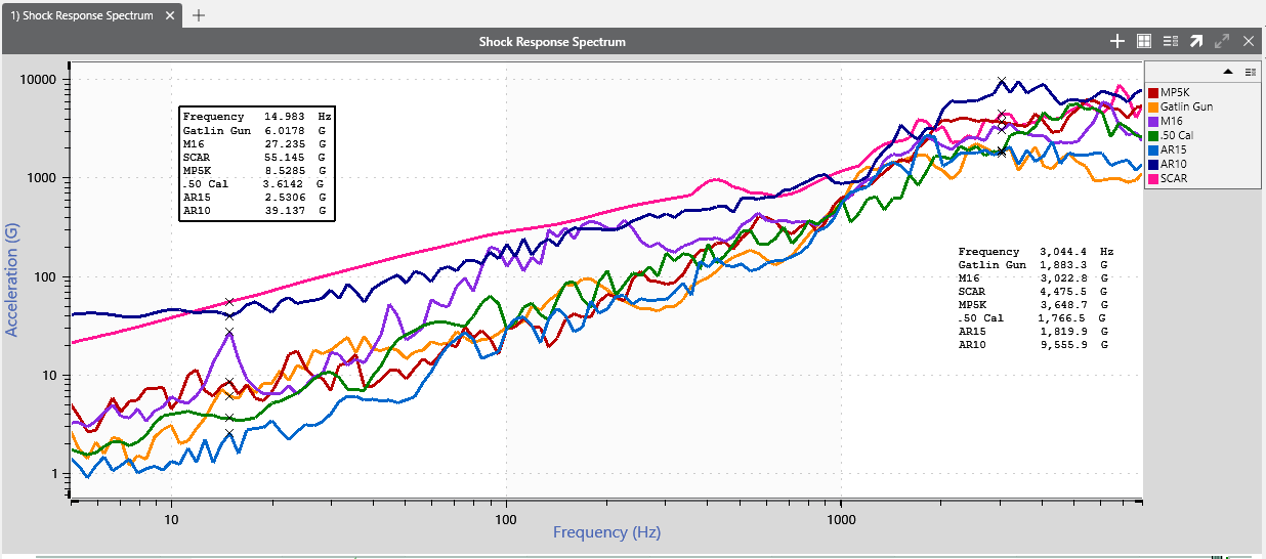
Comparison of SRS traces for all firearms.
The SRS helps evaluate testing environments with complex transient shocks. The curve’s initial overall slope represents a constant velocity or displacement. Group 6 selected an SRS rather than a PSD or FFT because they intended to analyze shock pulses. The response to a gunshot is a transient event, not random vibration.
First, they compared the guns’ excitation frequencies. Some displayed multiple spikes, while others were smoother. The guns with higher caliber bullets experienced excitations at greater accelerations. The AR-10, which had more kickback, had a greater displacement value than others.
The group questioned if the lower frequencies were relevant for some gun types because they had more excitations at higher frequencies.
Semi-auto vs Full
Next, group 6 wanted to know how the SRS and fatigue damage spectrum (FDS) values compared between a single shot versus a round. The FDS calculates the relative damage a product experiences in a defined period.
The team procured two waveforms in time from the MP5K recordings, one for a 16-round burst and another for a single shot.
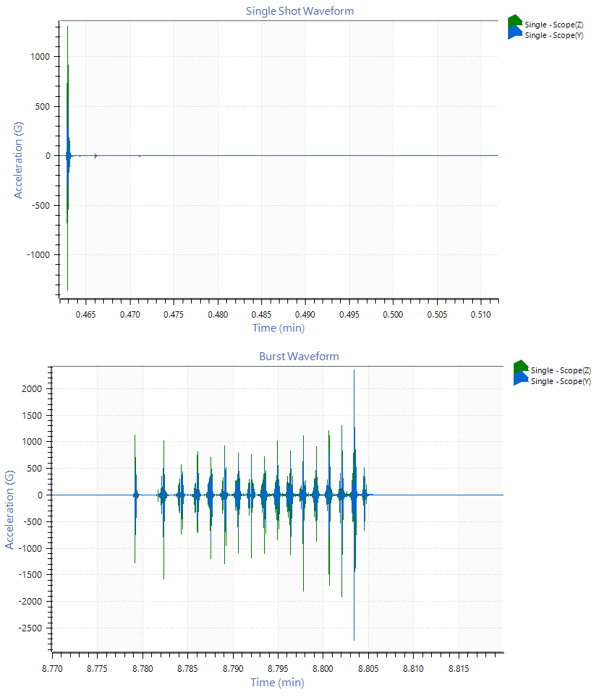
Single burst waveform (top) and 16-shot burst waveform (bottom).
Then, they added an SRS and FDS graph, each with two comparison traces.
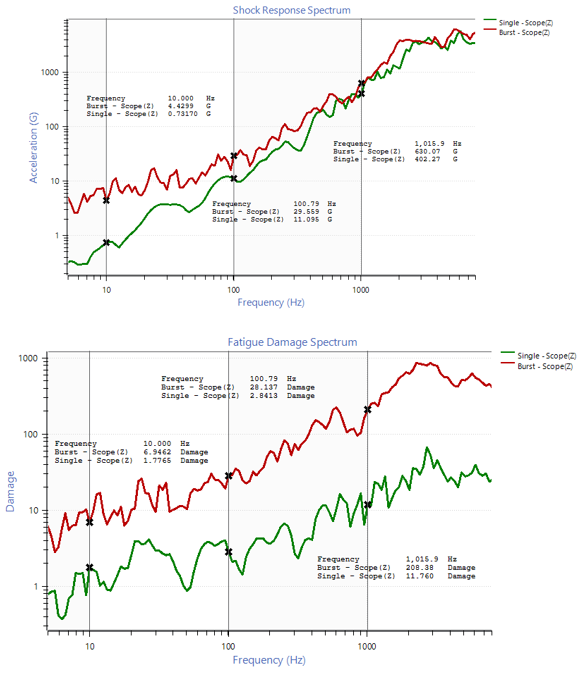
SRS comparison of a single shot to a 16-shot burst (top) and FDS comparison of the same data (bottom).
The SRS for the single shot and 16-round followed a similar pattern, but the FDS for the burst was much higher than the single shot. This difference shows how much more damage a round inflicts compared to a single shot. The group noted that the ratio of the two traces was about 10:20, and the ratio of the shots was 1:16.
GPS Overlay
Using ObserVIEW’s batch file processor, the team overlaid the recordings at the gun sight with the recordings at the target (feature in beta). This action helped achieve several goals:
- Determine the speed of the bullets
- Correlate notable events at the target with the gun and vice versa
If they knew the distance from the gun to the target and measured the time difference, they could figure out the speed of the bullets. They compared the calculated speed of the MP5k and M16 with an online source, and both calculated speeds were seemingly accurate. As the feature is still in beta, they could not be certain that the findings were accurate.
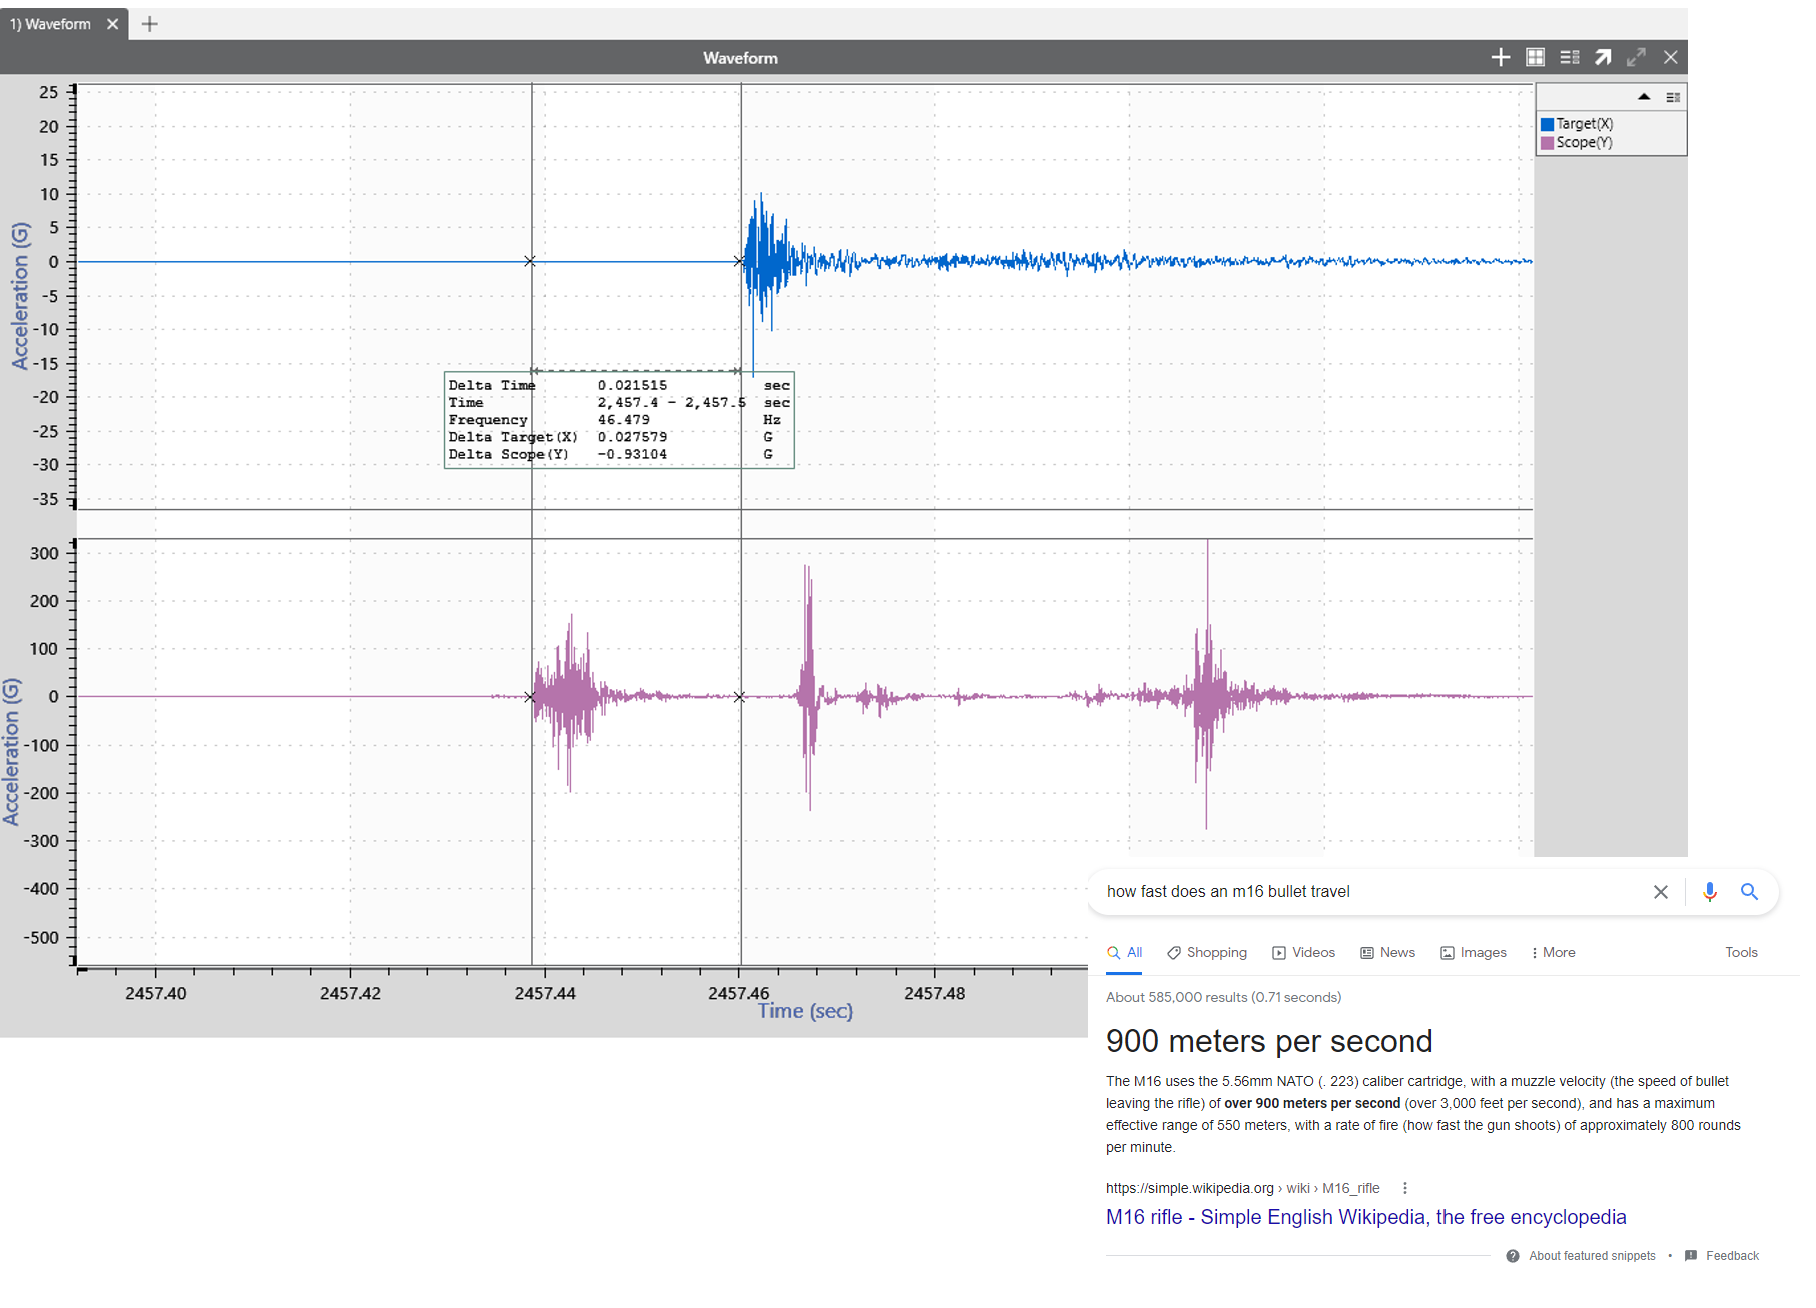
Overlay of M16 recordings to determine bullet speed.
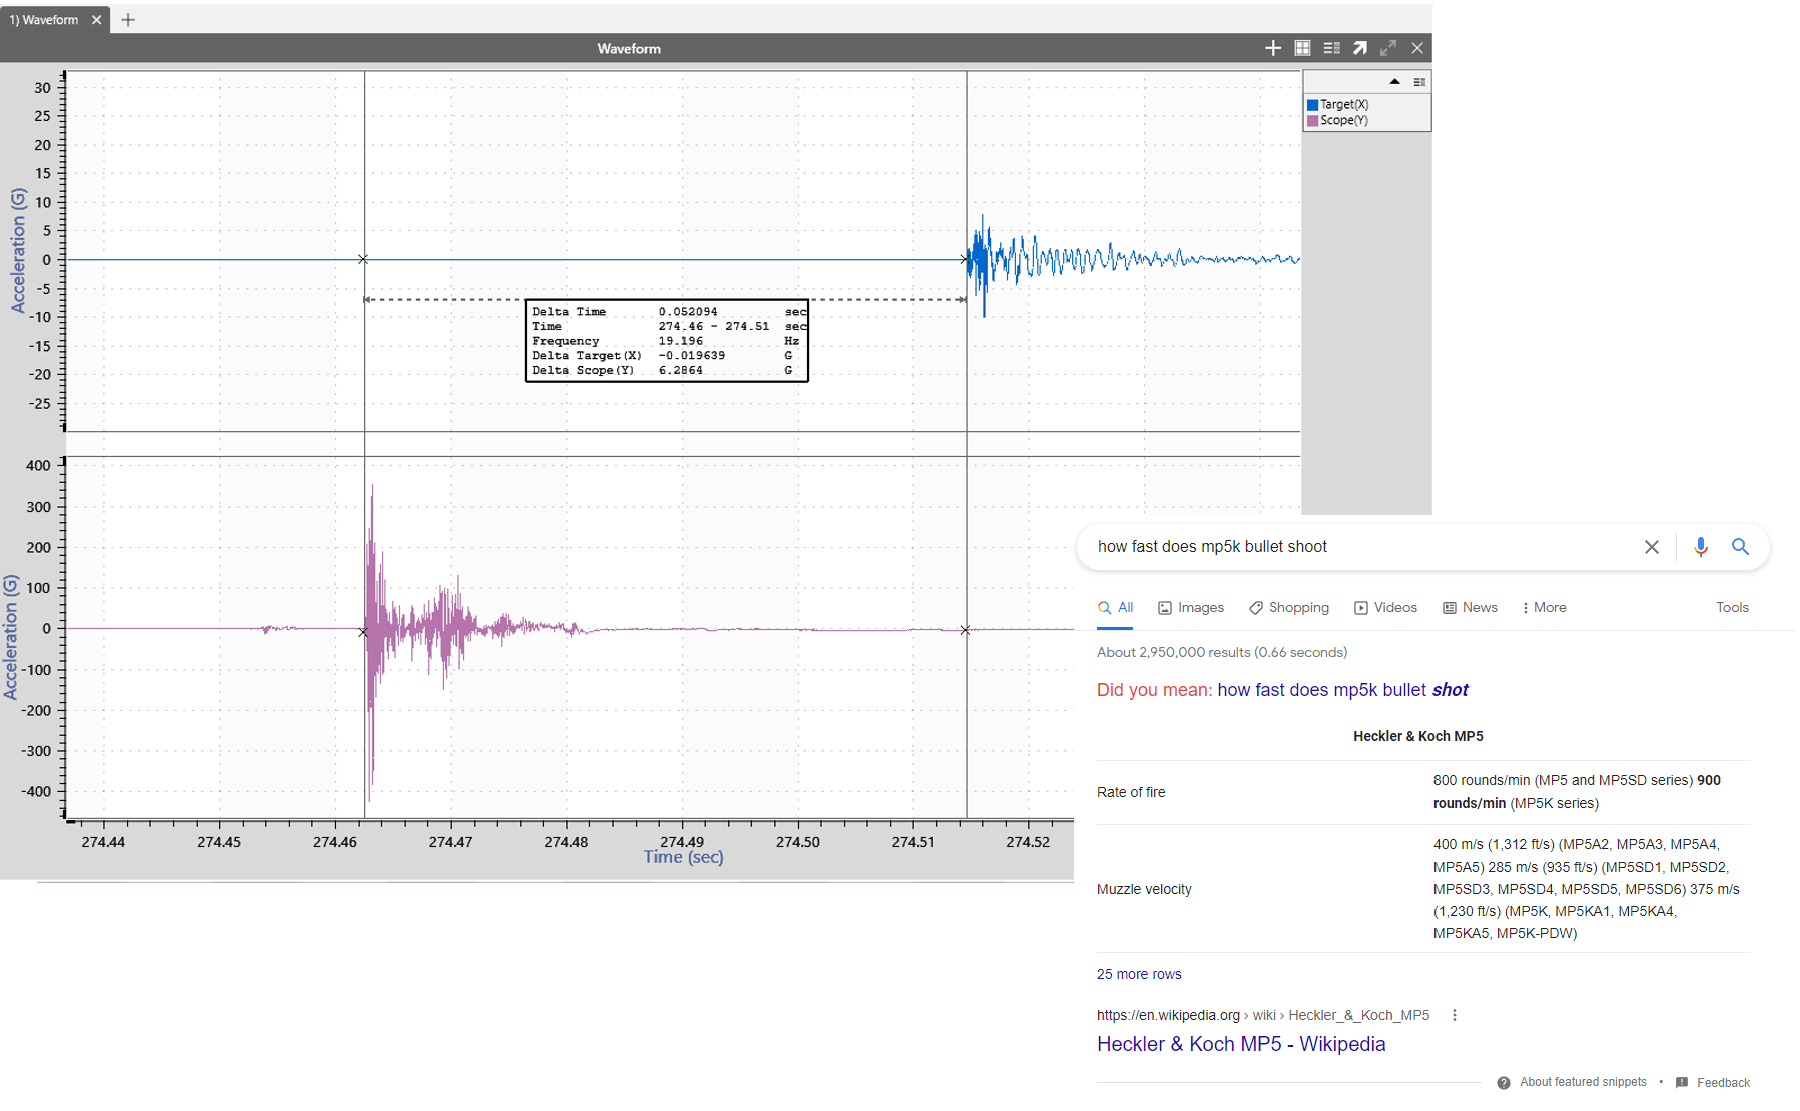
Overlay of MP5K recordings to determine bullet speed.
Multimedia Sync
Group 6 noticed a smaller peak at the end of each burst and set out to determine the source. They had a slow-motion video from a cellphone camera at 960 frames per second and synced it with the corresponding vibration waveform. In playback mode, they could see the slide locking back into place, which explained the lower peak at the end of each round.
A quick tip: The frames/sec of a slow-motion video might not be consistent throughout the video. In the team’s video, the recording had a higher frames/sec value at the start and end of the video. To sync it with ObserVIEW, they had to stretch out the slower segments, so the frames/sec were consistent.
Featured Software
Multimedia Sync

SRS

FDS
ObserVR1000 Recording Checklist
There are a few items to keep in mind when setting up the ObserVR1000 for recording. To make it easy, we’ve compiled a checklist to review before you begin.