The interior noise of a vehicle has a significant impact on the customer experience. Any noise outside the norm can raise concerns and discredit the company’s reputation. Engineers have a solid understanding of the noise requirements for internal combustion engine (ICE) vehicles, but electric vehicles (EV) require new standards. As EVs do not have an engine that makes noise, many normal vehicle disturbances are now audible to the passenger.
What is Octave Analysis?
Octave analysis is a common practice for noise, vibration, and harshness (NVH) testing. Engineers use acoustic measurements to assess the sound related to a device under test. However, these measurements do not contain frequency information and therefore cannot be compared to vibration. Vibration test engineers use octave analysis to group the frequencies of an acoustic signal to reflect how humans perceive the frequency spectrum.
Test engineers record the vehicle’s interior noise in an anechoic chamber or the operational field. A software program filters the acoustic signal and measures the sound pressure levels at the output. The engineer can then apply average and weighting techniques in the frequency domain to correspond to their desired evaluation of sound.
Learn more in the Octave Analysis in ObserVIEW blog post.
Comparison of Octave Analyses: EV and ICE
The process of octave analysis does not differ for an EV and ICE vehicle, but the characteristics of the measurements do. Engineers at Vibration Research sought to compare the noise and vibration of the vehicle types and performed a preliminary study to do so. They test-drove a Tesla Model 3 and a 2016 BMW 340i xDrive and compared the measurements.
Startup
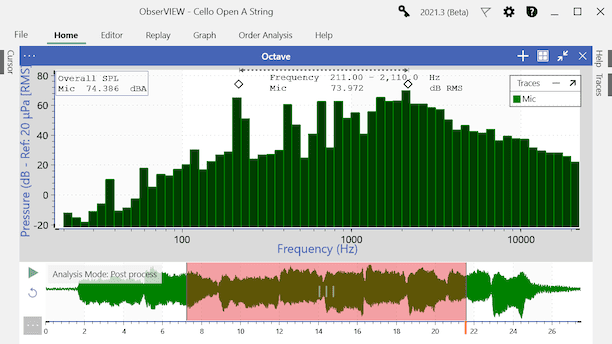
The BMW generated more noise on startup than the Tesla, which the engineers anticipated (Figure 1). The difference in overall sound pressure level (SPL) at startup was about 10% on the left microphone and 35% on the right.
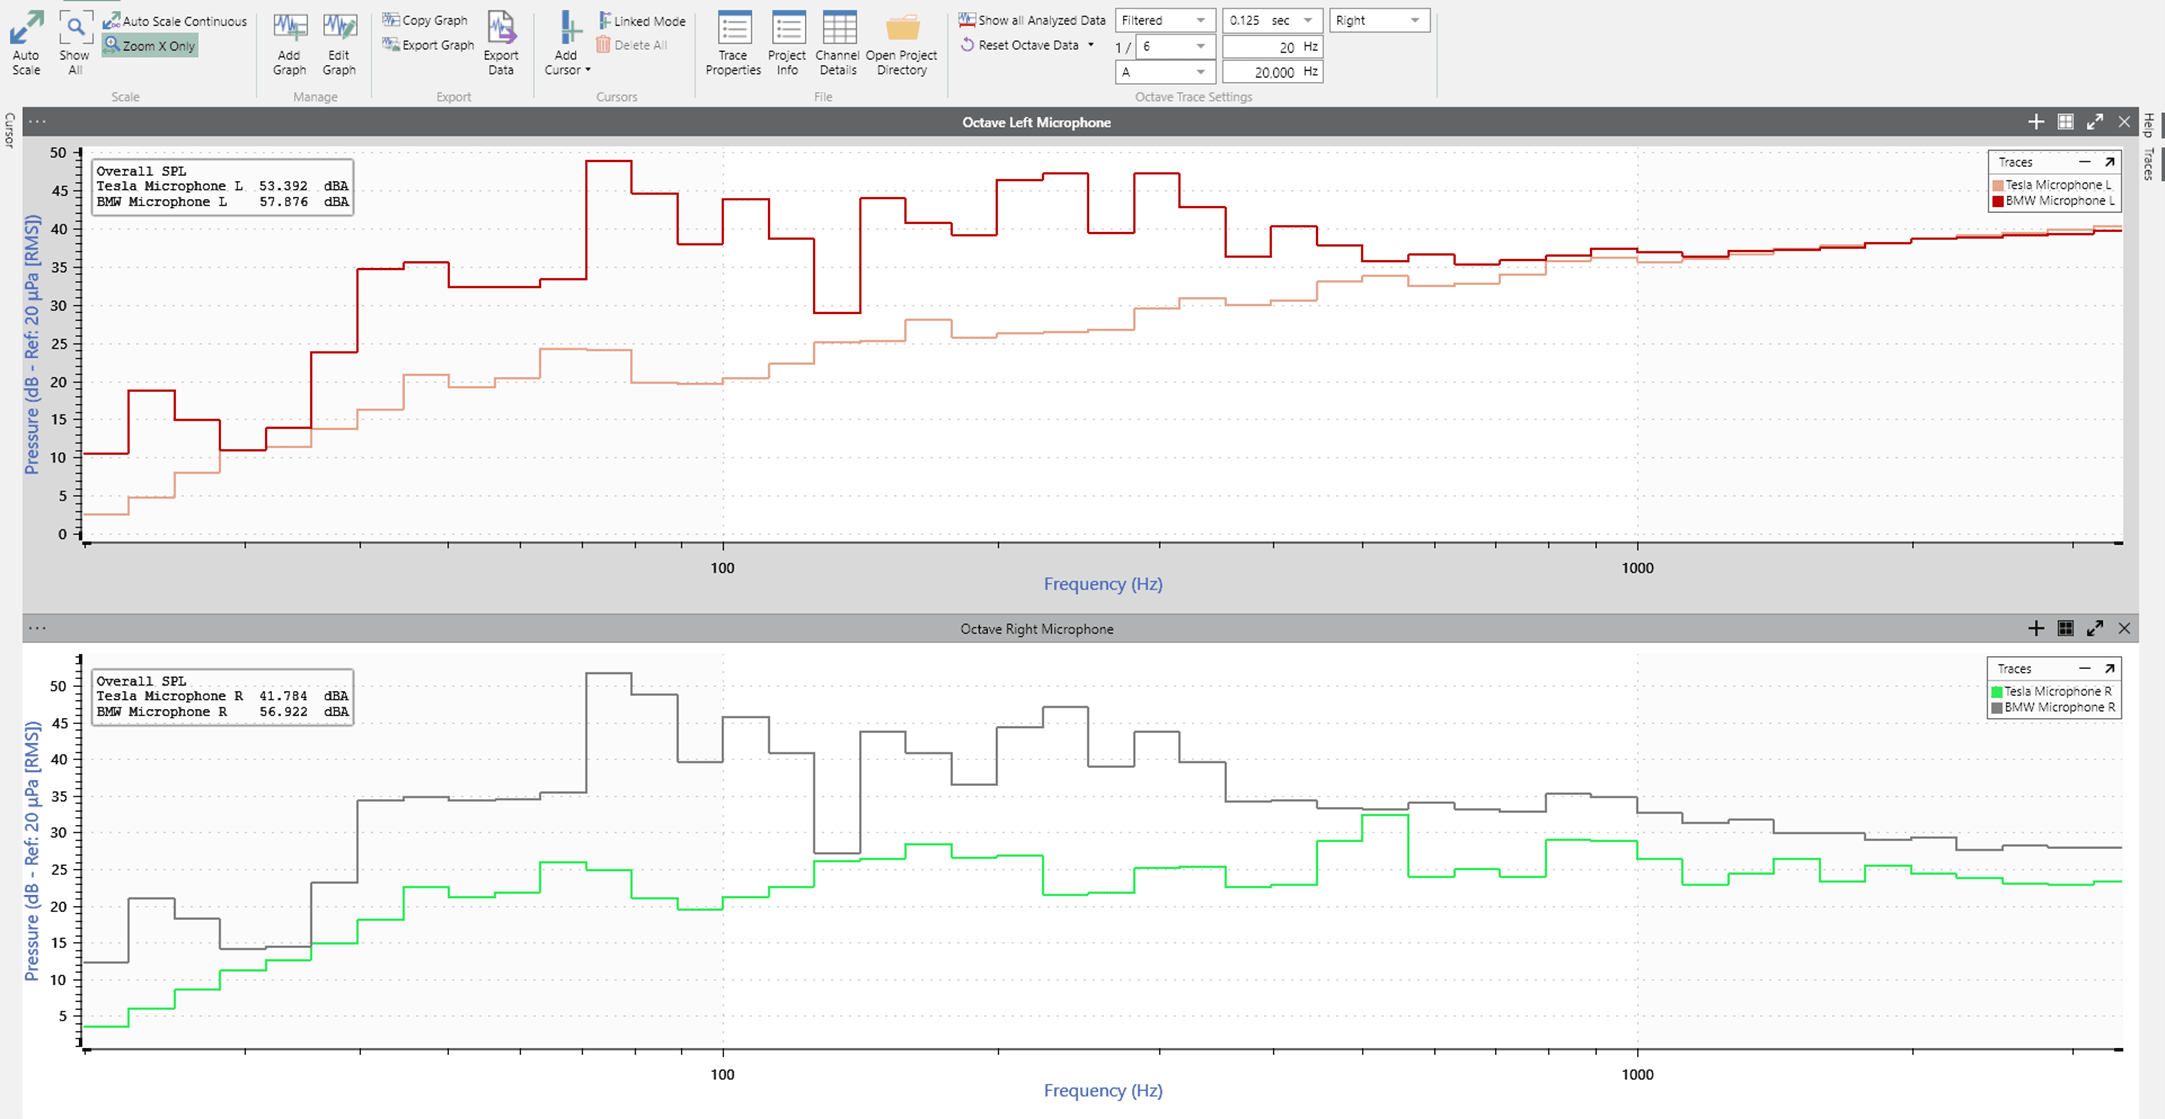
Figure 1. Audio recordings of vehicle startup.
You can see in Figure 1 that the dB levels of both audio recordings began to converge around 800Hz. The high-frequency content of both vehicles on and stationary appear to emit similar pressure levels, but the low frequencies are more audible in the BMW.
When we compare the difference in dB levels when the vehicle is on versus off, the BMW displays a larger disparity (Figures 2 and 3).
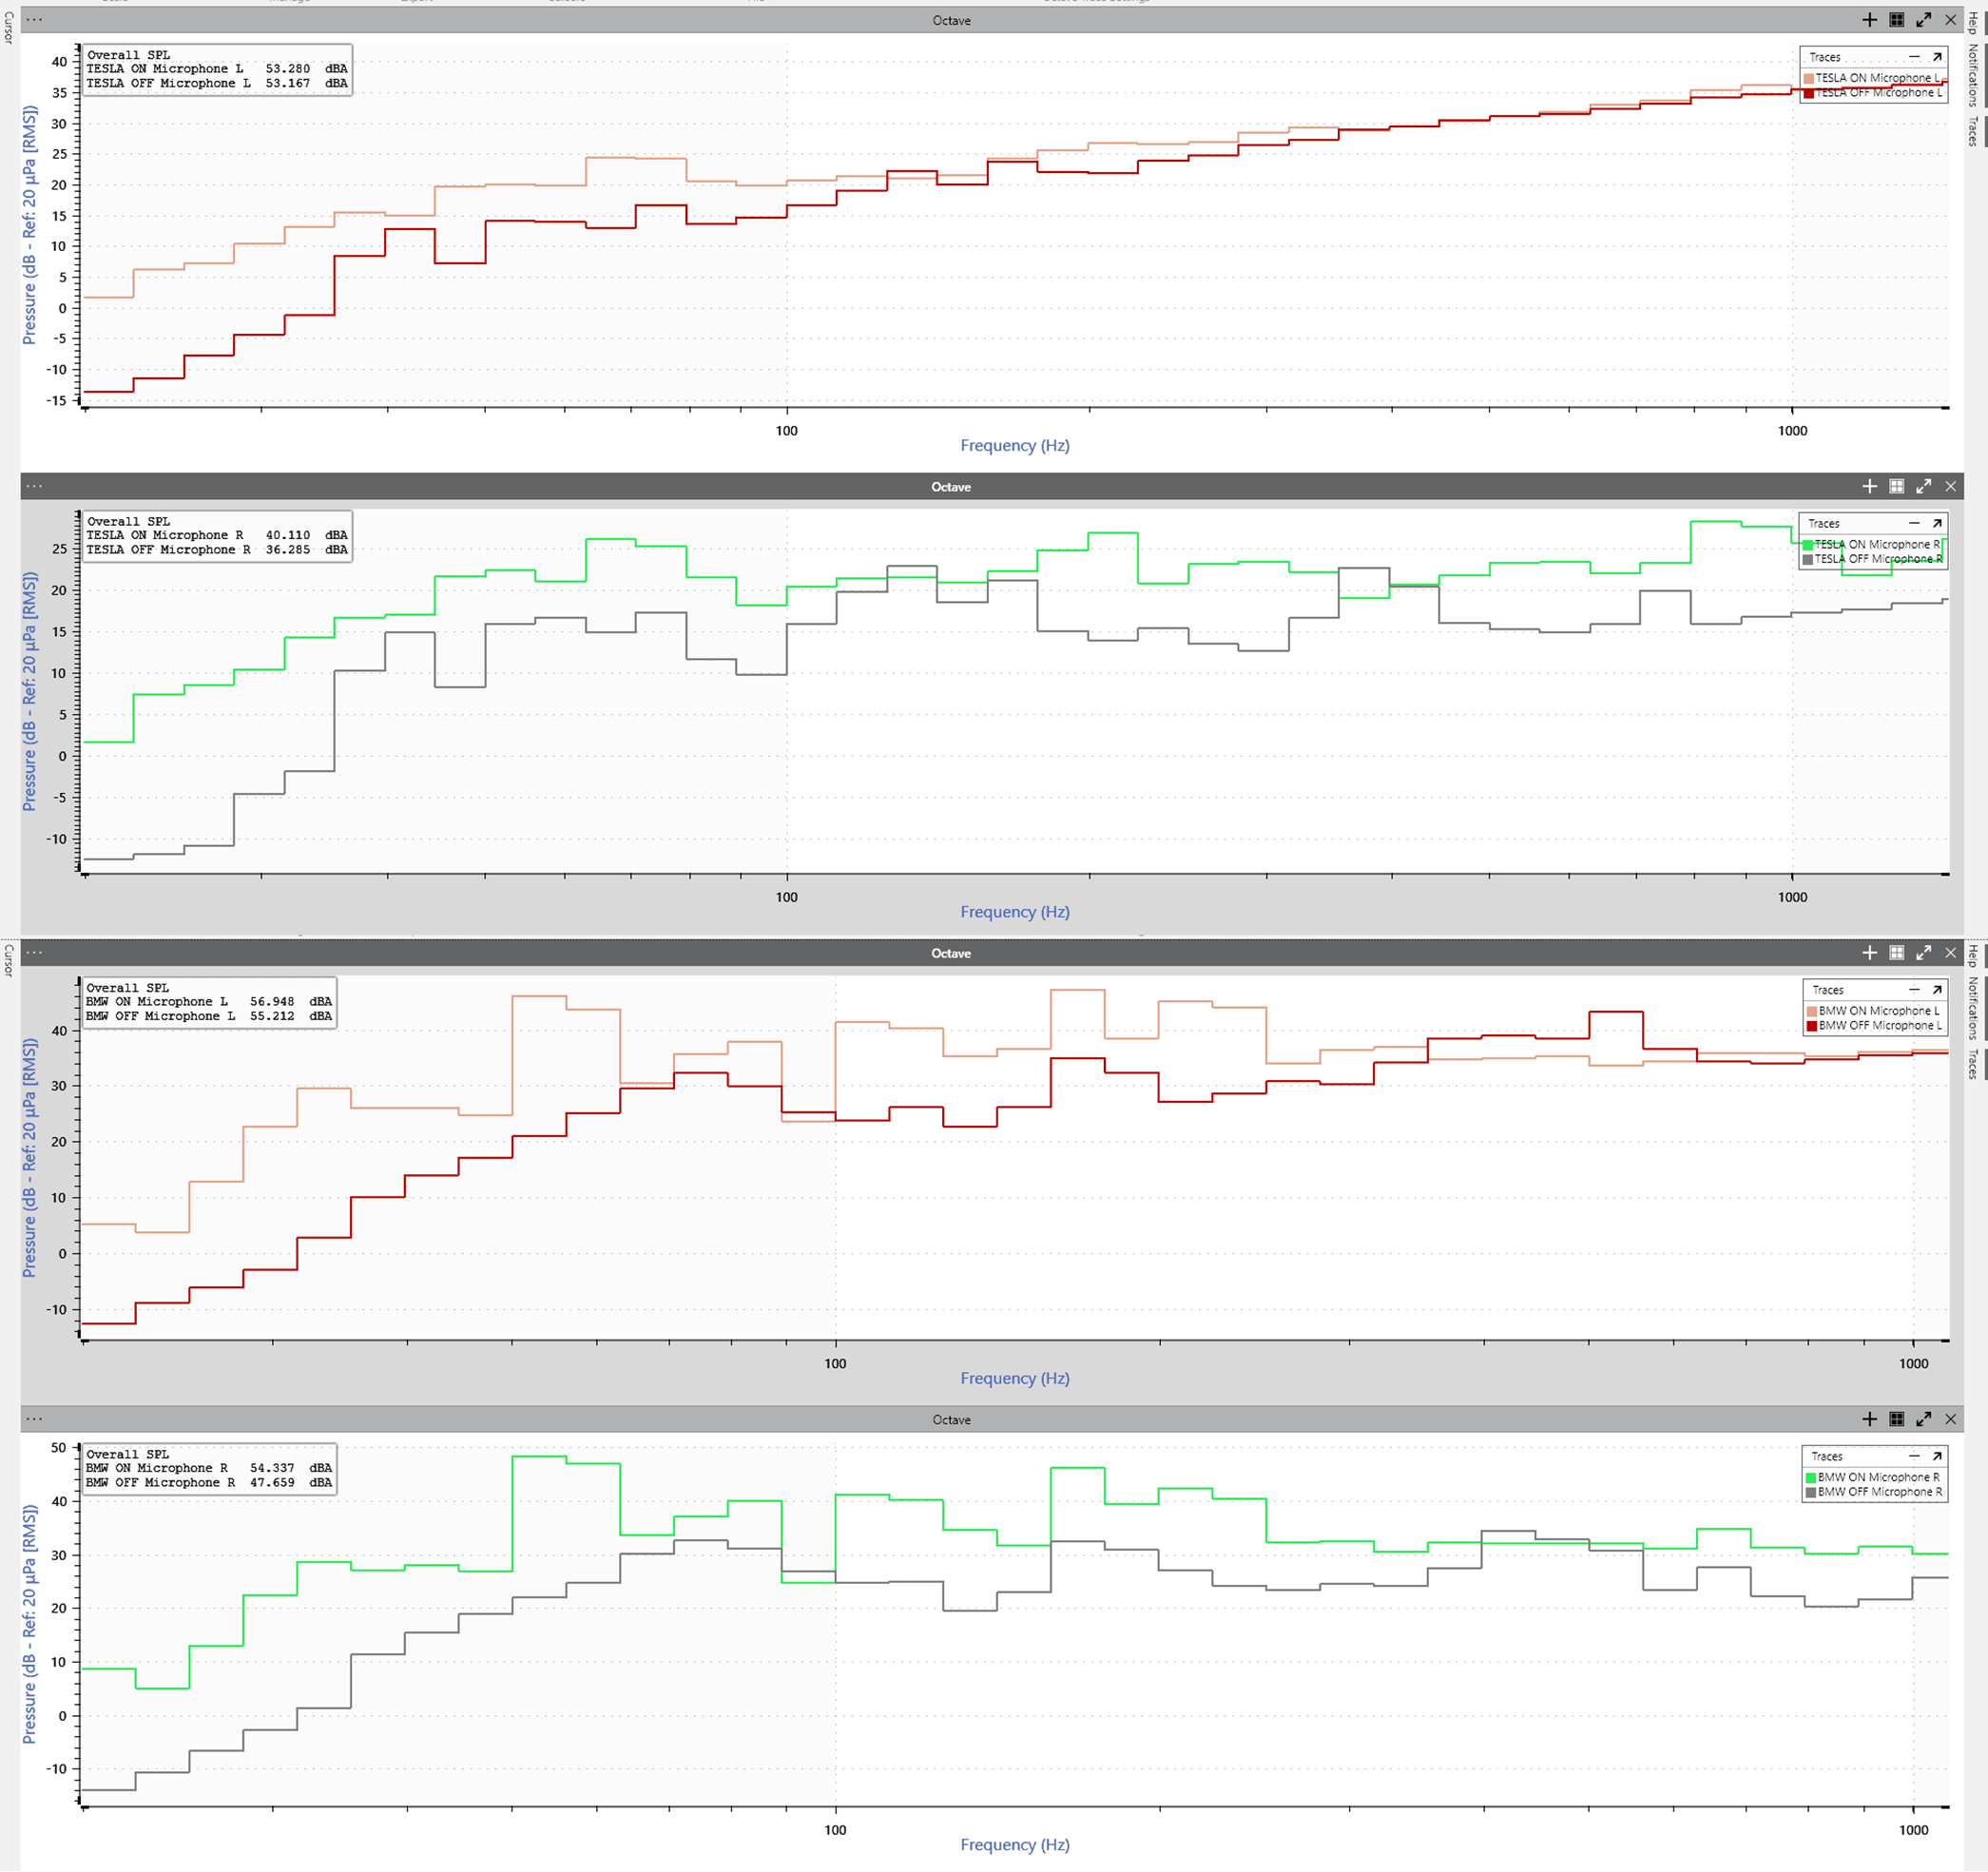
Figures 2 and 3. Comparison of decibel levels when the vehicle is on versus off.
The engineers also compared the octave analyses from the test drives of various road conditions. To view all the documentation, read the paper, “Comparison of Electric Vehicle and Internal Combustion Engine Vibration Analyses.”
Octave Analysis in ObserVIEW
ObserVIEW generates octave bands with an 8th-order filter to meet IEC 61260-1 Class 1 filter specifications. Fast/slow or user-defined time weightings, linear or exponential averaging, and peak hold options are available. It also includes A, C, and Z frequency weighting options to meet the IEC 61672-1 requirement.
The software includes the most used fractional octave bands; however, the user can enter any 1/N fraction that suits their test objectives. ObserVIEW does not have a limit on fractional octave bands. (Note: there is a soft limit at 1/96 for computer performance, but the user can override the limit.)
The octave band graph supports the advanced functionalities of ObserVIEW, including live analysis, copy-and-paste, and graph traces.