A new version of ObserVIEW (2021.2) is now available for download. In this latest software release, access octave analysis, batch file conversion, and more.
Octave Analysis
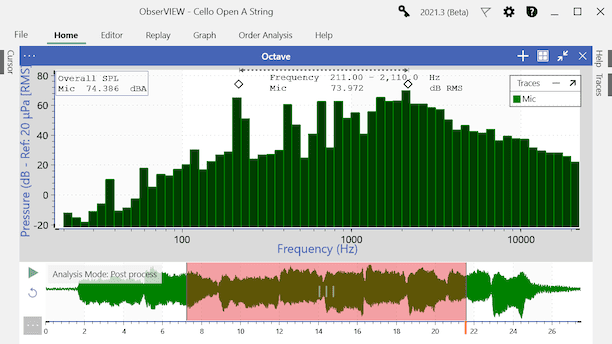
Octave analysis allows for the objective evaluation of sound and vibration by grouping the frequencies of an acoustic signal into “bins,” often to reflect how humans perceive the frequency spectrum. ObserVIEW can now generate octave bands with an 8th order filter to meet IEC 61260-1 Class 1 filter specifications.
A, C, and Z frequency weighting options are available to meet IEC 61672-1 requirement. Fast/slow or user-defined time weightings, linear or exponential averaging, and peak hold options are also available.
The software includes the most used fractional octave bands; however, the user can enter any 1/N fraction that suits their test objectives. ObserVIEW does not have a limit on fractional octave bands. (Note: there is a soft limit at 1/96 for computer performance, but the user can override the limit.)
Audio Frequency Spectrum
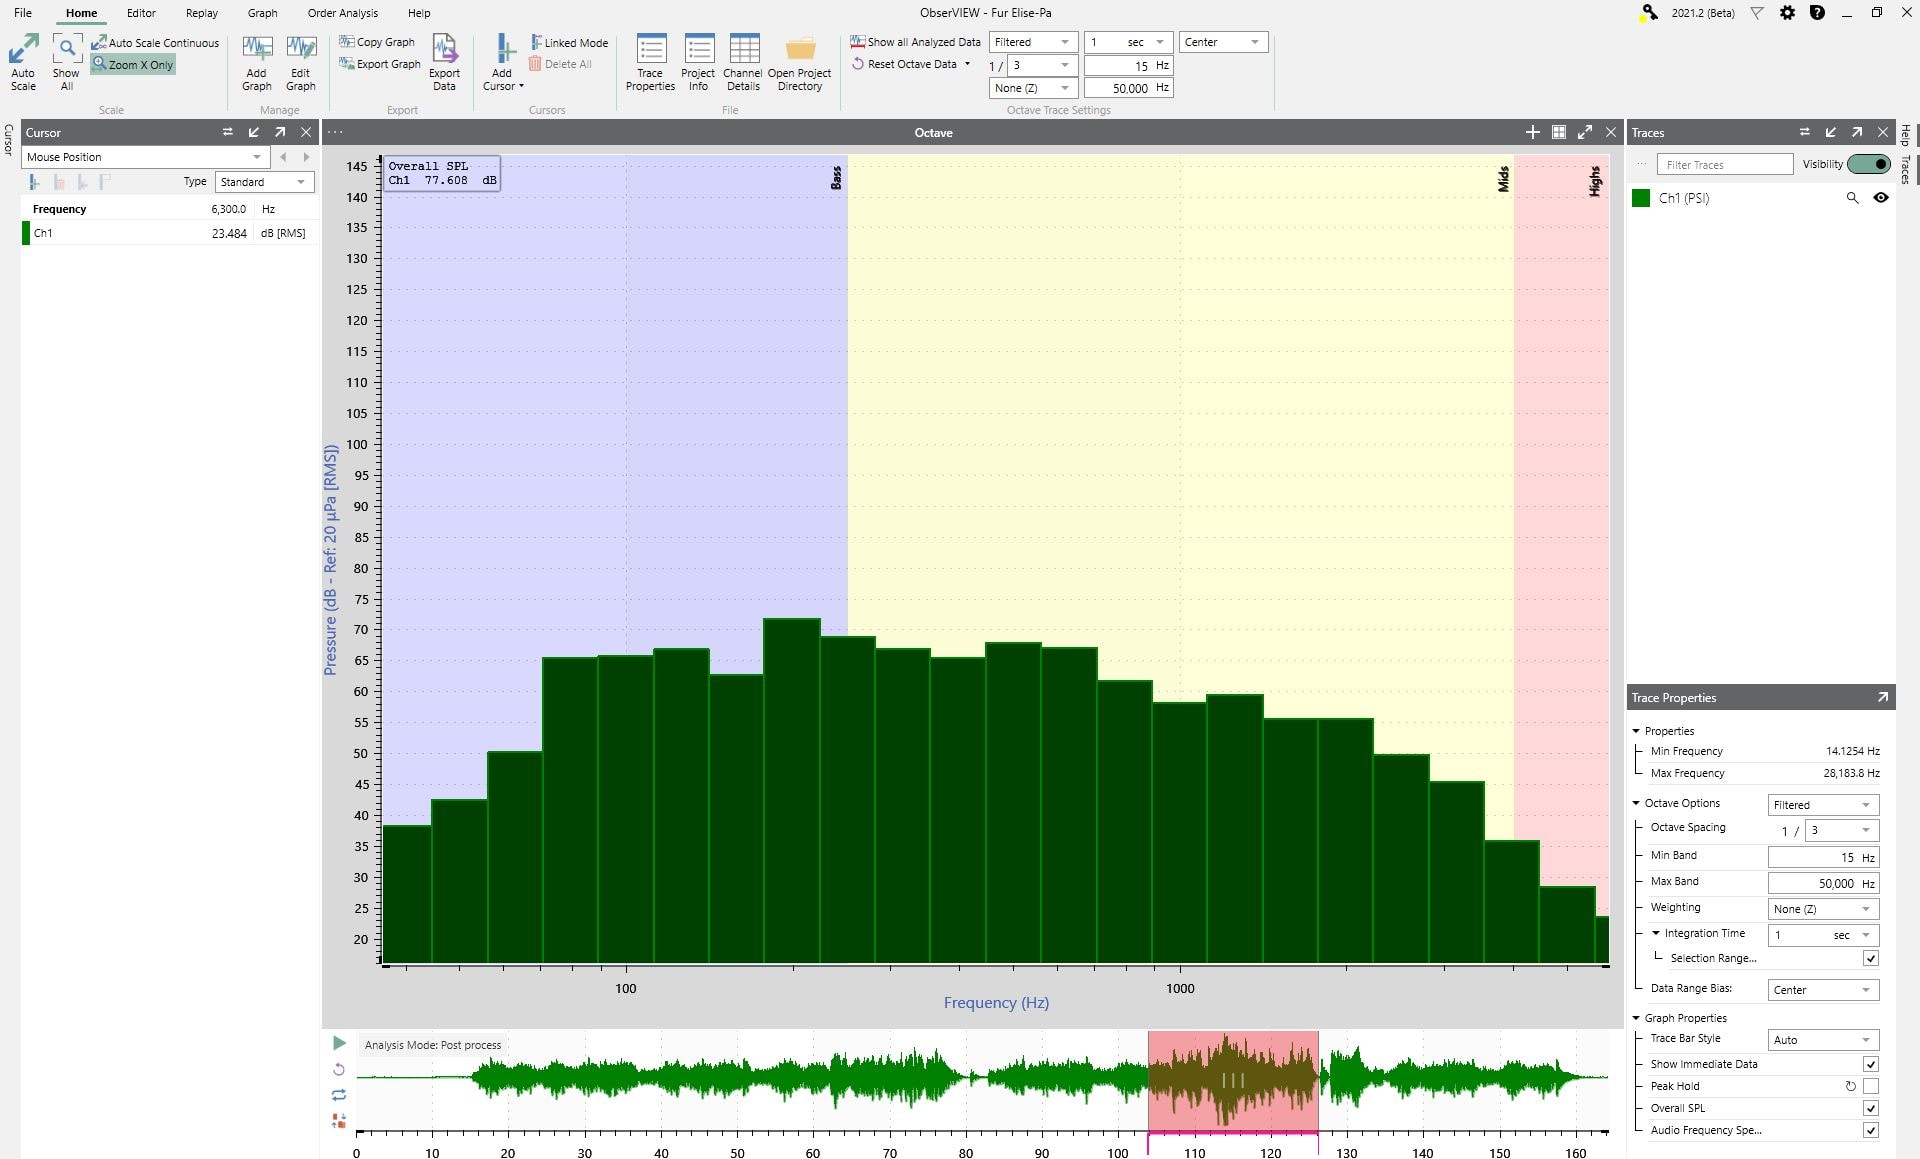
The audio frequency spectrum is an overlay that represents the range of human hearing. Bass frequencies range from 20 to 250Hz (purple), Mids from 250 to 4kHz (yellow), and Highs from 4k to 20kHz (pink).
Peak Hold and Overall RMS
The octave band graph supports many of the advanced functionalities of ObserVIEW, including live analysis, copy & paste, and graph traces. More specifically, it can display peak hold and overall RMS traces.
- Peak hold displays the maximum amplitude for each bin over the peak hold data range.
- Overall RMS displays the total RMS for the integration period using the selected filter.
For pressure units, overall RMS is called overall sound pressure level (SPL). SPL displays the total volume of a sound signal.
Also relevant to octave analysis is the harmonic cursor, which displays the trace values at each harmonic of the base cursor. When the Y-Axis of the cursor graph is in dB, the harmonics are displayed relative to the reference measurement.
Changing of dB Reference per Unit
The decibels (dB) unit is a relative logarithmic unit, so two values with unit dB cannot be added. Instead, they must be converted between linear units (and then back to log) and have the same reference measurement.
A reference measurement defines the value of 0dB. For instance, many engineers use 20uPa as the reference value for sound pressure because it is the quietest sound level a human ear can distinguish. In this case, people can hear any value above 0dB and cannot hear anything below it.
In ObserVIEW’s Display Units settings, the user can configure reference values for each unit category. The default value is 1 for all units except pressure, which is 20uPa.
Reference measurement for a dB scale type.
Batch File Conversion
Convert files to any time waveform format supported by ObserVIEW
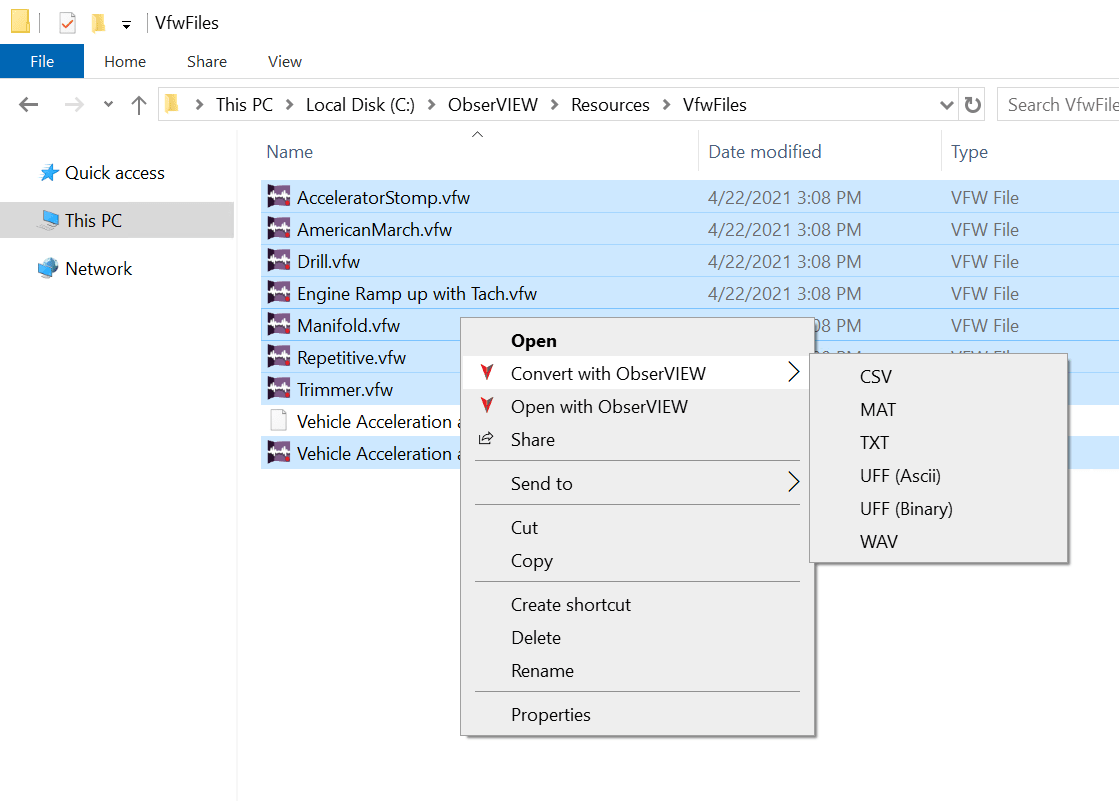
ObserVIEW can convert files using its command-line executable. If the user provides a valid set of parameters, the console app will read the file and convert it to the desired file type.
For example, a .vfw file can be converted to any one of multiple file types without opening the software application. Instead, the user runs the command-line arguments from File Explorer. Any file type that ObserVIEW can open will support the File Explorer options.
Control Traces
Change trace visibility with the left and right arrow keys. Rather than using the toggle button, use this keyboard shortcut for quicker navigation.
Live Spectrogram
The user can now enable a spectrogram graph during live analysis. Previously, the DVR had to be paused to view this graph option.
Download the Latest Version of ObserVIEW
Users with a valid Upgrades and Support Agreement (U&SA) can upgrade to the latest version of ObserVIEW for free. The demo version is available to any user for free.