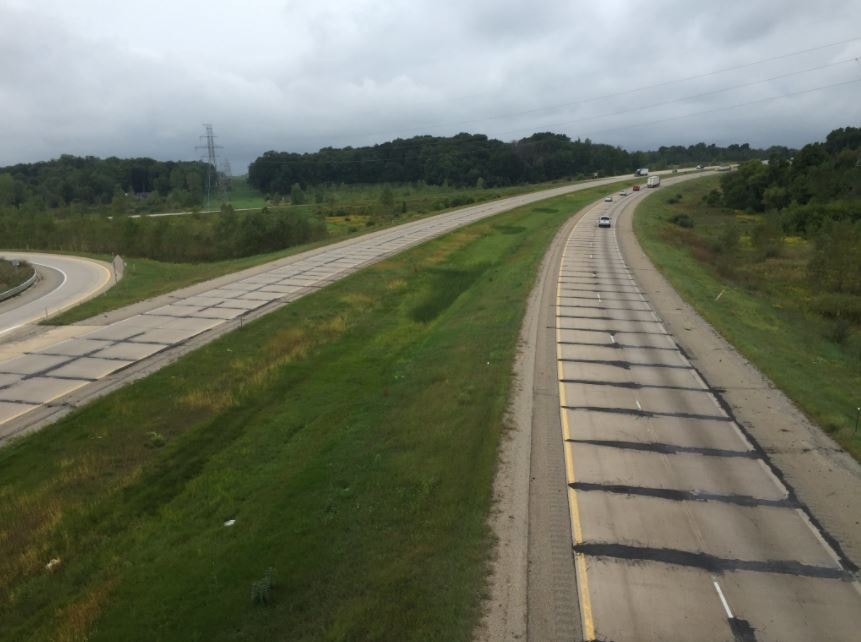
State Highway 6 is a bypass from I-196 to I-96. It is the fastest route to the airport if you live south of Grand Rapids, Michigan. It was also a reoccurring topic of conversation in the late 2010s.
It was well known that something went wrong when workers poured the concrete in the late 90s. Yet, the state allowed the highway to decay until the summer of 2017, particularly the portion from I-196 to Byron Center Avenue. The degradation of the road was centralized around the cut joints in the concrete, which were 14 feet apart for most of the stretch of highway.
Drivers and passengers could feel and hear the impact of these damaged concrete joints. As vibration test engineers, we wondered how this road damage affected the vehicles.
A vehicle experiences fatigue damage any time it is driven. Automotive manufacturers design and test their products to withstand an average amount of damage per mile. They use a variety of road conditions and approximate how many miles of each condition the vehicle will likely experience in its lifetime. The engineers consider daily occurrences as well as unlikely but damaging transient events.
We wondered: if the repaired section of the highway is a typical environment, how much additional damage was applied to vehicles for each mile driven on the damaged section of M-6? The following case study looks into how a road in disrepair may increase a vehicle’s exposure to damage over time.
M-6 Case Study
The western four miles of M-6 were in the worst condition until the summer of 2017 when workers tore out all four lanes and replaced them with new asphalt. Expecting the road to be repaired, engineers from Vibration Research Corporation set out to conduct a case study. The goal was to compare the damage inflicted on vehicles when operating on the old highway versus the new one.
 Using Vibration Research’s ObserVR1000 data acquisition hardware and triaxial accelerometers from Dytran Instruments, the engineers recorded a vehicle’s vibration before and after the road repair.
The ObserVR1000 is a portable, 16-channel device that connects to the VR Mobile application to observe live data from a mobile device or laboratory. Technicians can record field data to a disk or SD card and then analyze it in the ObserVIEW software.
Recording and Analysis
Vibration data was recorded on a 2016 Chevy Silverado 1500 truck while the driver made multiple passes across the 4-mile section of M-6 in both directions. The measured road vibration recordings were evaluated independently using accepted industry means.
At some frequencies, the old (damaged) road was less damaging than the new (repaired) section. For example, the y-axis (horizontal and forward) motion at approximately 13.7Hz corresponded to the wheel speed, so any differences in speed throughout the recording shifted this point.
The concrete joints on the old road were 14 feet apart. At 65 mph, a driver crosses 6.8 joints per second. The impact frequency at 65 mph is 6.8Hz, 7.8Hz at 75 mph, and 8.3Hz at 80 mph.
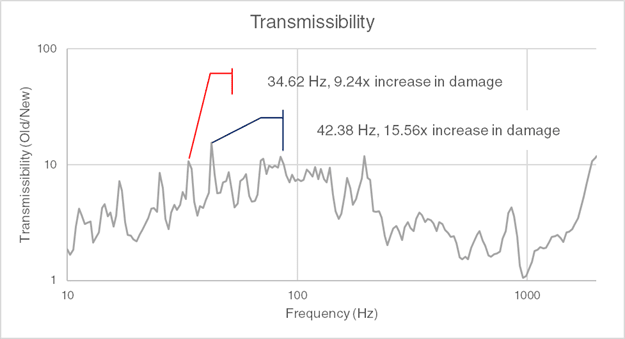
Figure 1. Comparison of transmissibility between the damaged road and repaired section.
When a vehicle is exposed to these types of impact events, the frequency of the impact is not necessarily at fault for the damage. Rather, the culprit is the higher frequency content generated from the vibration exposure. This high-frequency energy is much more likely to excite resonances in the vehicle components and cause additional damage.
For instance, if a vehicle’s component had a natural resonance of 34Hz, the damage difference between the two road sections would be approximately 10Hz (Figure 1). The average driver crosses this section of the highway 4 times per week. If driving on the old road with the 10x damage multiple at 34Hz, the vehicle would experience nearly 4,000 miles of damage in 400 miles.
Results
The data show that significantly more damage was applied to the vehicle due to the degraded condition of the highway section. There is no point between 10Hz and 2,000Hz (the typical frequency range for automotive testing) where the old road is less or equally damaging than the new one. This damage would likely affect the suspension components and bushings inside the vehicle, as they are most prone to low-frequency damage.
State, county, and city officials can use this comparison as an example of how to determine which roads need to be replaced or repaired. It can also be used as a reference to determine the rate of degradation a road experiences year after year. As more data are collected, it can be used to more efficiently predict when road sections need to be repaired or replaced. This consideration would allow for more efficient budgeting and work from the local to national level.
Automotive Vibration Testing
Automotive testing is critical during vehicle development and allows test engineers to characterize the effect of long-term road-induced vibration and shock. Vibration Research offers a comprehensive suite of software options that address the many testing requirements for automotive vibration testing. To learn more about Vibration Research’s offerings for automotive vibration testing, please visit the industry page.