A new version of ObserVIEW (2025.2) is now available for download. In this latest software release, perform live analysis of data with multiple analyzer devices.
Release Video
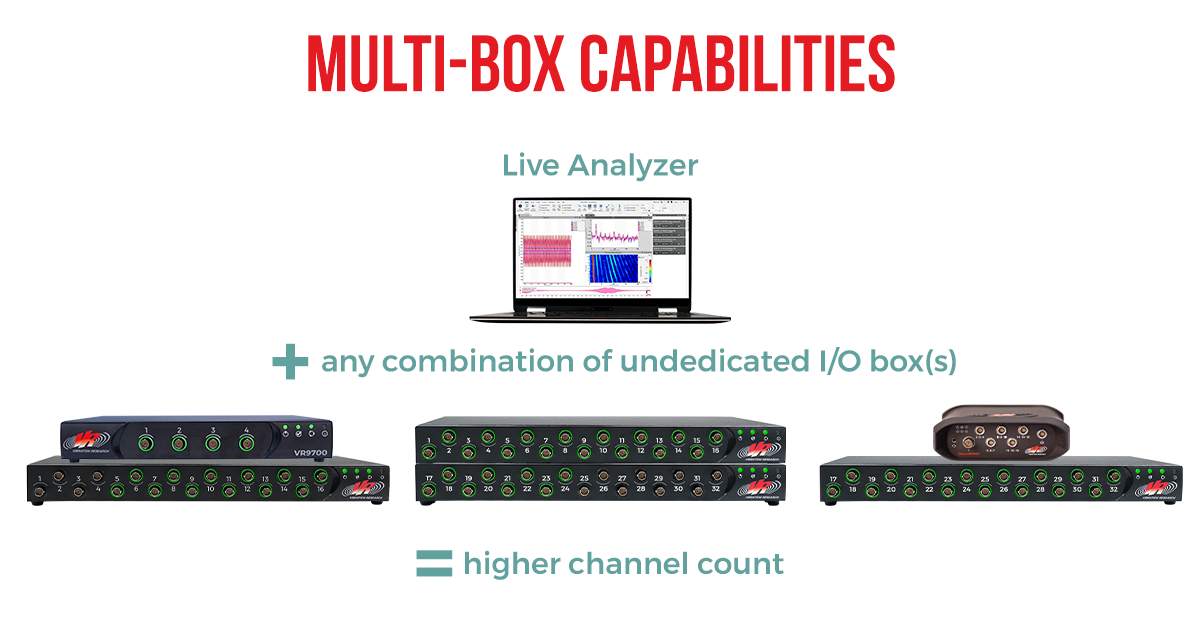
Multi-channel Analysis with Multiple I/O Devices
In ObserVIEW’s Live Analyzer, engineers can record and monitor live data while running a vibration control test. Versions 2025.2 and newer allow customers to record up to 64 channels to their PC using multiple Vibration Research I/O devices. They can mix the ObserVR1000, VR9700, and VR10500 as a single system or connect multiple devices of the same type, including the VR9500.
A multi-box system can perform all functions available in Live Analyzer, including:
- Analyze, record, and compare data
- Verify shaker tests, including sine reduction and SRS/PSD analysis
- Statistical analysis, monitoring, and outlier evaluation
- Acoustic analysis with octave and SPL time history
- Basic rotational analysis
- Live damage analysis (FDS, SRS, ERS)
This update allows labs with larger or more complex test systems to perform comprehensive test/status monitoring. The workflow simplifies high-channel-count setups.
Additional 2025.2 updates support this new option for multi-channel recording and analysis.
Example Applications
Sine Reduction
Use analyzer channels for sine reduction when running a control test to optimize test parameters using multiple devices.
- Monitor response channels during sine/random tests
- Compare response against reference profiles (MIL-STD-810H)
Sine-on-random
Perform specialized tests, like sine-on-random, to conduct complex vibration analysis using multiple devices.
- Create phase relationship math channels
- Set up transfer function
- Export/import complex graph layouts
Multi-device Connection and Management
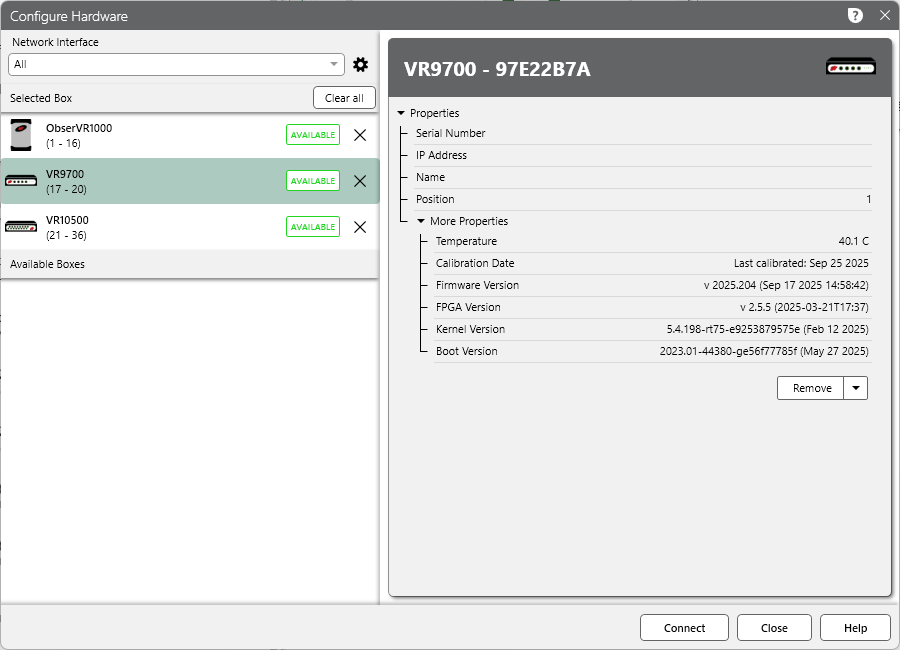
An improved configuration setup in ObserVIEW makes it easier to connect multiple hardware devices.
To connect to multiple devices, all boxes must have all inputs enabled. Select Connect to Device > Configure Hardware. Under “Discovered Boxes,” select the + icon to add an available box to the system. Under “Selected Boxes,” the program will list the selected boxes and their associated channels (1-16, 17-20, etc.). After connection, the Live Analyzer display will appear.
The program saves previous connections, including multi-box connections, for easy configuration in the future.
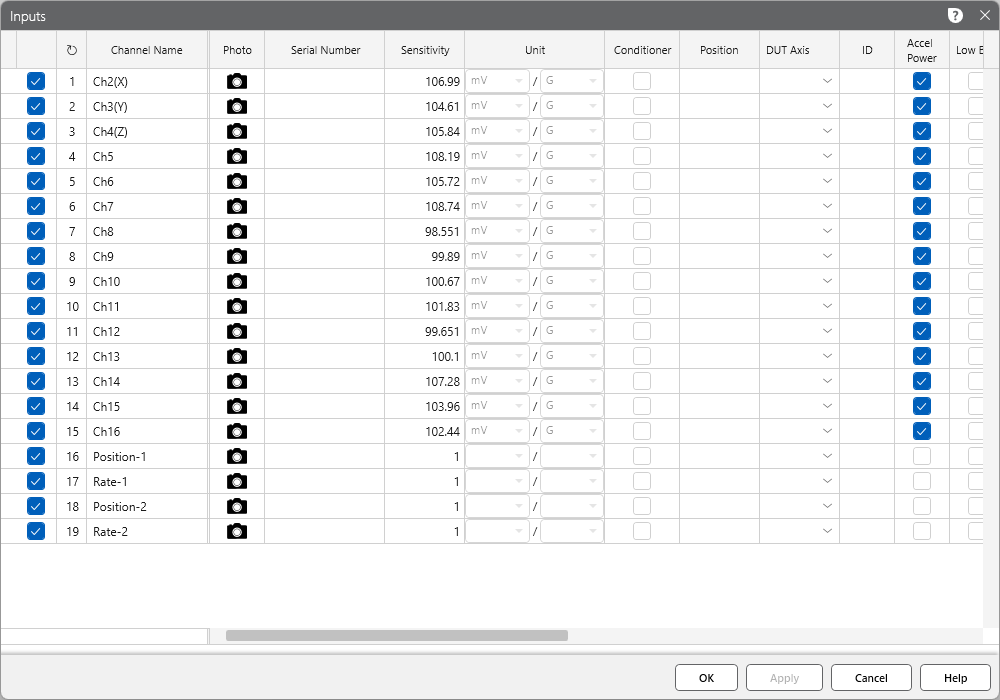
Input Management for Multi-channel Configurations
ObserVIEW’s input dialog has also been improved to support multi-channel systems. Engineers can configure all multi-box system inputs/tachometers in one place. They can also save or load input configurations.
For any text entry field, engineers can highlight multiple channels to apply a global setting. Drop-down options can be copied and pasted to multiple selected channels.
With the new “Tags” function, engineers can also organize their inputs with custom filters. Tags also appear as a graphing filter option (see “Graph Filters” below).
Multi-device Live Analysis and Monitoring
The Live Analyzer interface displays live data for all channels. The “Channel Readings” pane shows all channel statuses, so engineers can quickly identify any issues. The display includes the live amplitude values and alerts the user if a channel disconnects or exceeds the defined amplitude range. Hover over a channel to view more of its statistics.
Graphing
Engineers can add power spectral density (PSD), root-mean-square (RMS) time history, and waveform graphs to the display to monitor their test and the performance of their multi-device setup. ObserVIEW displays warnings on the graph data that are lagging.
Additionally, users can apply the capabilities of math channels to perform real-time analysis. The math channel traces can be added to live displays or graph templates. Examples of applications include:
- Create an average control channel
- Calculate differential displacement
- Calculate transmissibility
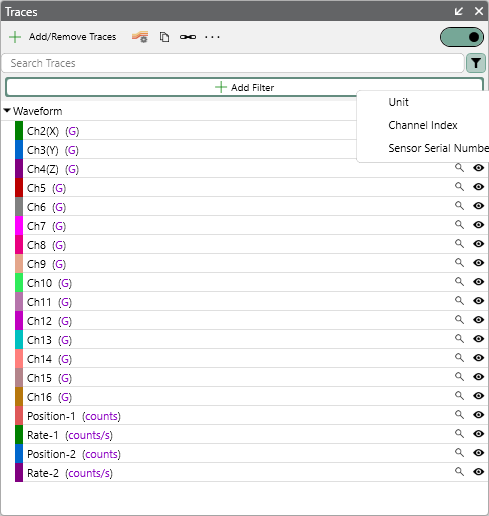
Graph Filters
Versions 2025.2 and newer include an Add Filter option in the “Traces” pane. The filter options are:
- Tags
- Unit
- Channel Index
- Axis
- Sensor Serial Number
When an engineer defines a filter, the program will only display the available channels for graphing. This option simplifies the process of graphing when multiple boxes are connected.
Download ObserVIEW 2025