The cross-spectral density (CSD) is one of several advanced functions used to compare vibration signals. Specifically, it displays the distribution of power for a pair of signals across a frequency spectrum at any time. This information can be used to determine the influence of a signal in relation to another.
Put simply, the CSD can be used to find mutual resonant frequencies in a pair of signals. It shows how correlated (“related,” “statistically connected,” “influenced”) two signals are in reference to another.
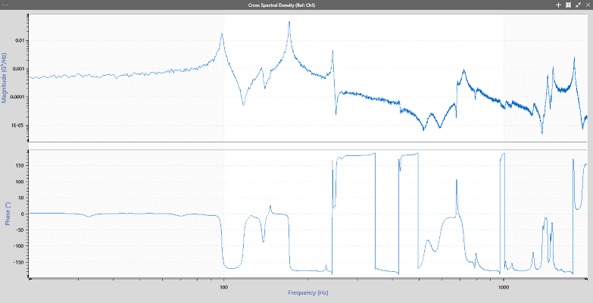
Cross spectral density analysis option in ObserVIEW software.
Article Overview
- Definition of cross-spectral density (CSD) as a frequency-domain measure of power distribution between two signals
- How CSD reveals resonant frequencies and statistical correlation between signals
- Comparison to power spectral density (PSD)
- Interpretation of the CSD plot
- Relationship between CSD and cross-correlation
- Estimation techniques such as Welch’s method for approximating CSD from sampled data
Association with the Power Spectral Density (PSD)
Cross spectral density may remind you of another term that is used recurrently in vibration testing: power spectral density (PSD). The PSD represents the distribution of a signal over a frequency spectrum. The magnitude, or power, of the PSD is the mean-square value of the signal.
The cross-spectral density provides similar information as the PSD but presents it as a statistic for a pair of signals. As the name power spectral density does not include the measured quantity, the word power can be replaced with the name of the measured quantity, such as acceleration.
In this case, cross-correlation is used to determine the power of the pair of signals, hence the word “cross.” The CSD may also be called the cross power spectral density.
Equivalencies
Similar to the PSD, the CSD is a function of frequency. However, the CSD describe a relationship between two signals, whereas the PSD is limited to one. Still, the CSD and PSD are equivalent in some instances. If two signals (x, y) analyzed by the CSD are the same (x=y), then the CSD is the same as the PSD. Just as with the PSD, the true CSD cannot be known but can be estimated.
In essence, the CSD is the same as the PSD except the signal may be compared to another signal rather than itself.
Statistical Property of the Cross-Spectral Density (CSD)
A CSD plot displays the power of a pair of signals that are multiplied in the frequency domain across a defined band of frequencies (also known as the spectrum). The area under the CSD curve from frequency f1 (input) to frequency f2 (output) represents the spectral power (RMS) of the input projected to the output in that frequency band.
The CSD is a statistical property for a pair of random signals. It indicates the likely distribution of power across the spectrum at any time. The CSD is a function of frequency that can change over time. Indeed, the statistical properties of a pair of output signals are likely to change over time if the test item changes (e.g., deforms or experiences metal fatigue) or if the input signal to the shaker changes, such as during a shock test.
CSD and Cross-Correlation
The CSD of a signal pair is the Fourier transform of the pair’s cross-correlation. The Fourier transform may be a discrete-time Fourier transform, discrete Fourier transform, or fast Fourier transform (FFT).
Cross-correlation Function
Cross-correlation is a third signal that compares the displacement of two input signals relative to one another. It is an estimated statistic based on sampling data. The cross-correlation function is defined as:
(1) ![\begin{equation*} C_{xy}(n,n+m) = E[x(n) y(n+m)] \end{equation*}](https://vibrationresearch.com/wp-content/ql-cache/quicklatex.com-2bed70371f7f86d36d32bd79757d271d_l3.png "Rendered by QuickLaTeX.com")
where E[x(n)] is the expected value of a random variable Z = x(n)y(n+m). The expected value is defined in terms of the probability density function of Z, such as a Gaussian distribution, Rayleigh distribution, etc.
If the statistical properties are not changing over time, then the cross-correlation during that time is stationary. As a result, the cross-correlation function can be simplified to C_xy(m) = E[x(0) y(m)] because the statistical properties depend on the time difference m rather than absolute time n.
Estimation of the CSD
As mentioned previously, the true CSD value cannot be known but can be estimated if the data are stationary (i.e., the CSD is not changing with time.)
Estimation Using Sampling
There are several methods of estimating the CSD that use sampling. One of the most popular is Welch’s method, based on the paper, “The use of fast Fourier transform for the estimation of power spectra: A method based on time averaging over short, modified periodograms” (Welch, 1967).
Welch’s method divides the data sequence into analysis frames of equal length (the frames can overlap.) The FFT is applied to each frame, and the pair x(n), y(n) of the FFT operation is multiplied together. The multiplied FFT segments are averaged to yield an estimated CSD.
Applications of the CSD
A testing engineer may require a better understanding of a complex vibration relationship between two signals. For example, in a multi-axis system, vibrations in one axis can affect the vibrations in another.
The CSD reveals the influence of signal x in relation to signal y. When comparing signals from two sources, there may be a time delay in measurement. Consequently, there also will be a phase difference between the two signals. Therefore, the CSD contains data about the differences in amplitude and phase of the two signals.
Multi-axis Testing
The CSD is particularly beneficial when studying multi-axis systems. The purpose of the CSD plot is to determine if there is a relationship between two variables, and the coherence plot helps quantify the relationship between them.
For example, consider the following multi-axis system:
An engineer tested a product on a shaker in the x, y, and z-axes. As the product vibrated, a rotational or rocking motion occurred. The test engineer might ask, “does the vibration in the x-axis have a relationship to the vibration in the y-axis?” If so, every time the product vibrated in the x-axis, it would have a y-axis component. The test engineer could use the CSD and coherence plots to determine a relationship between the motions.
Figure 1 contains three CSD plots where the three linear axes are compared to the drive. In the first plot, the three axes’ accelerations are compared to the drive acceleration on the x-axis. In the second, they are compared to the drive acceleration on the y-axis; in the third, the z-axis.
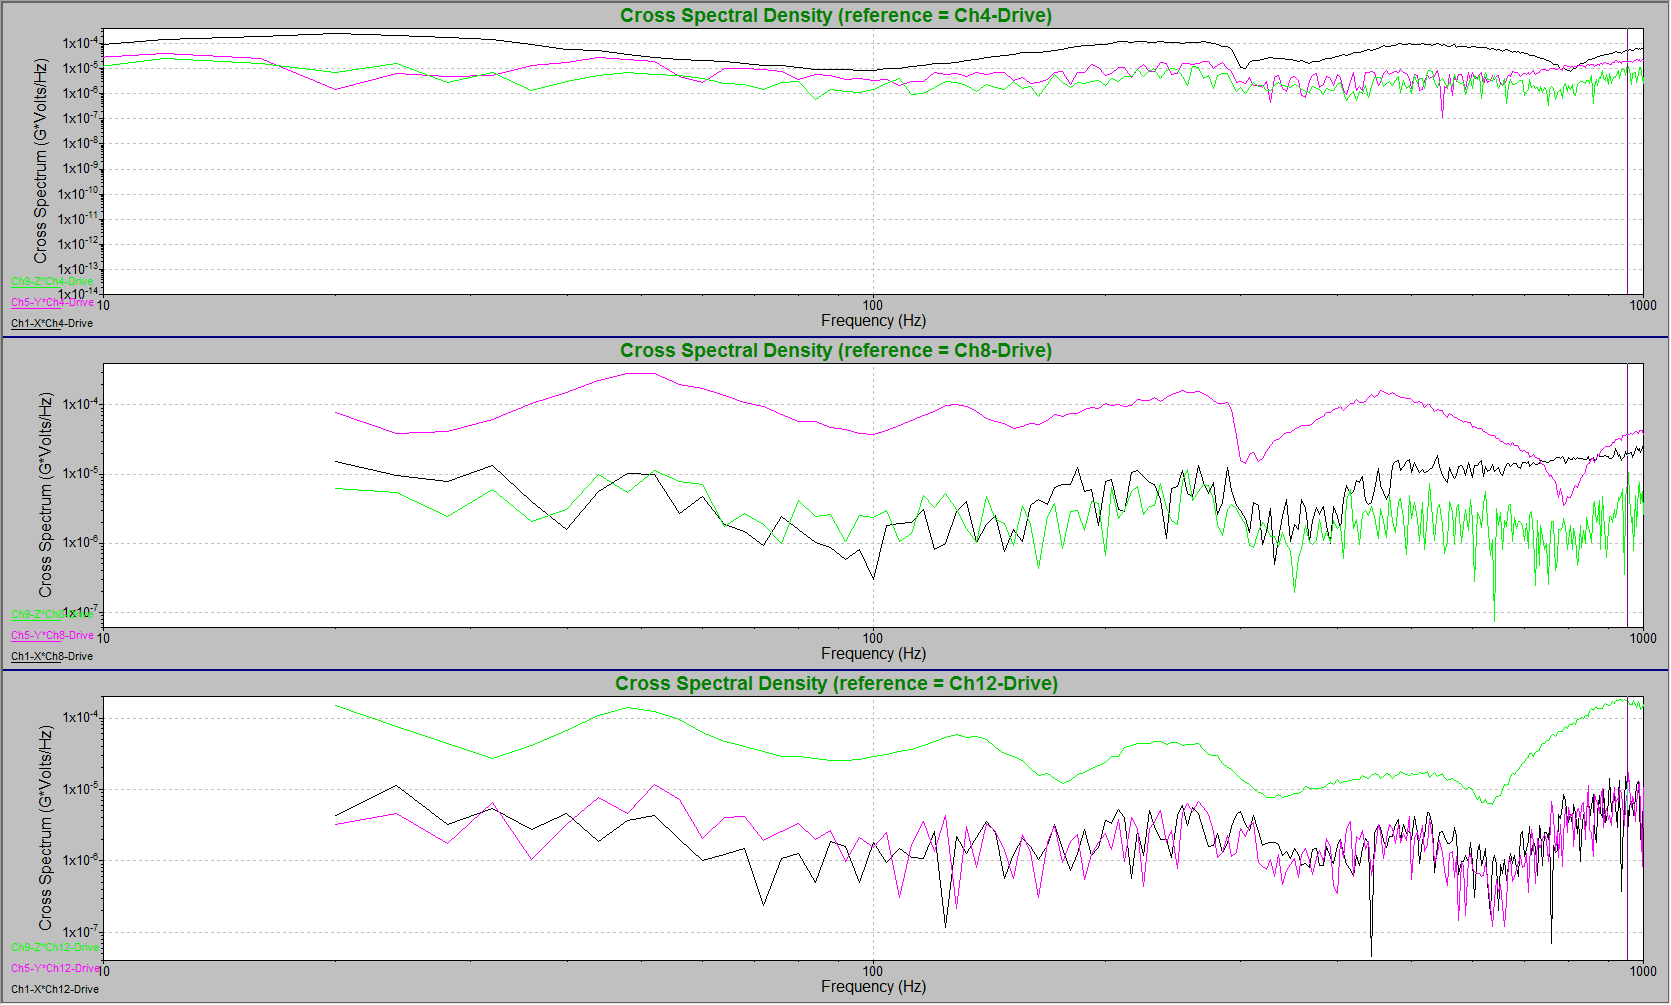
Figure 1. Cross-spectral density plot for a multi-axis system.
In the top plot, the x-axis (black trace) and the drive acceleration vibrate similarly across the frequency domain, aside from a resonance around 300 Hz. At 800 Hz, the x and the y-axes (pink trace) have the same ratio compared to the drive signal. The vibration intended to affect the x-axis is simultaneously similarly affecting the y-axis. The drive should have only influenced the motion of the x-axis, which indicates a problem with the system. In the third plot, the z-axis (green trace) has a different ratio to the drive signal than the x and y-axes. The vibrations across the spectrum intended to affect the z-axis do not affect the x or y-axes.
An examination of the coherence plot for the same data set results in a similar conclusion (Figure 2). In the top plot, the correlation value is 1 for much of the frequency spectrum. This value indicates that the x-axis vibrates perfectly with the drive except for the 300 Hz and 800 Hz resonances.
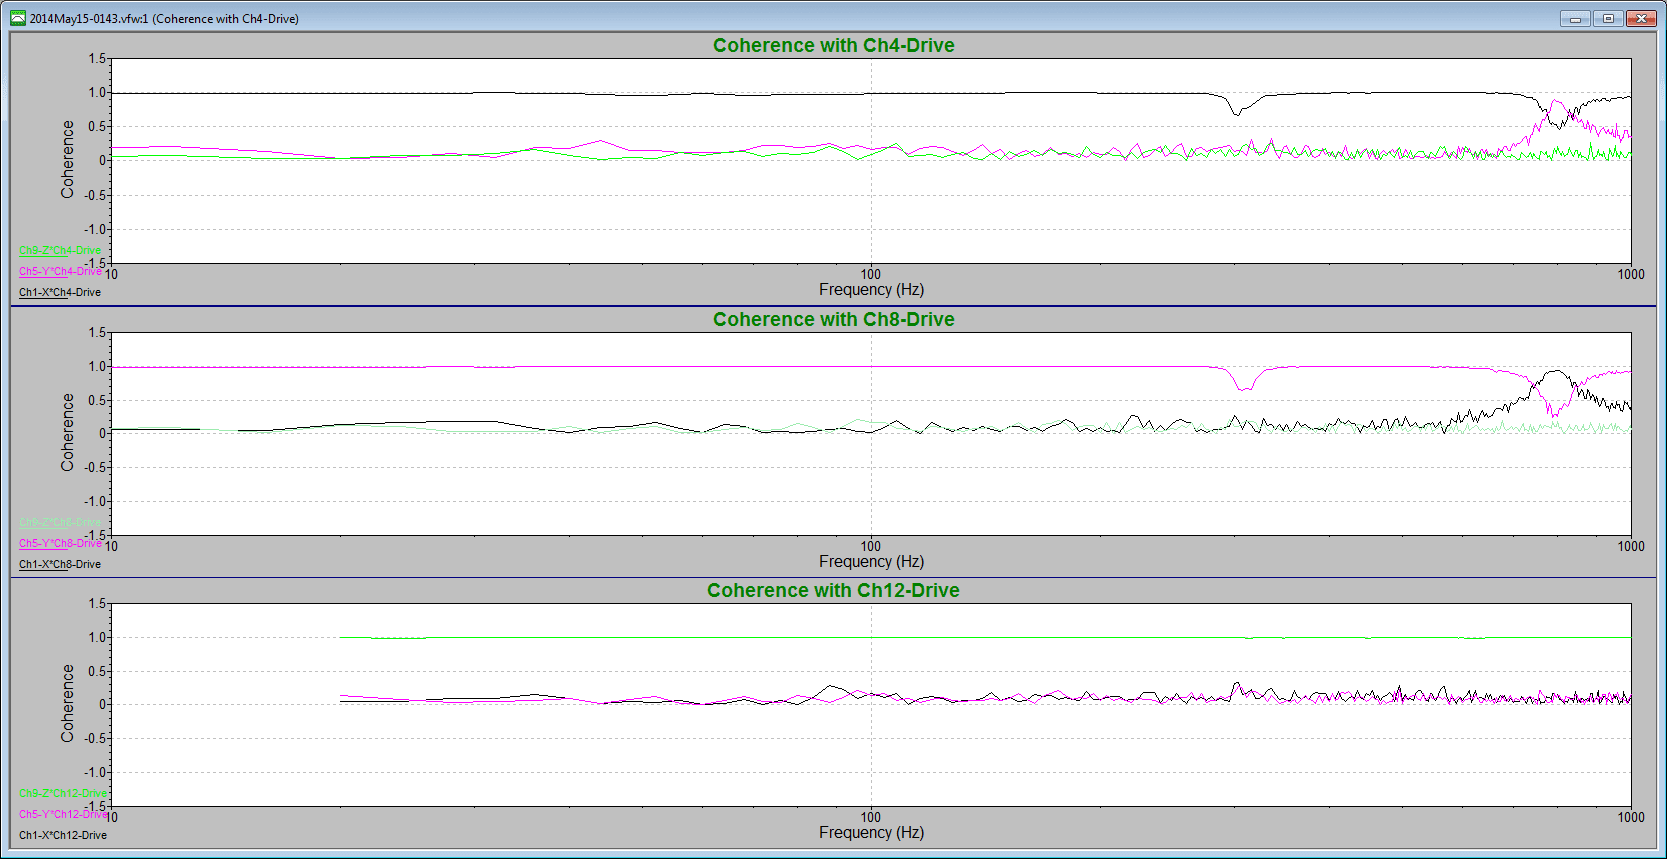
Figure 2: Coherence plot for a multi-axis system.
At 800 Hz, the y-axis is more correlated to the drive than the x-axis, which means its vibrations are more similar. This correlation indicates a problem with the product’s vibration. The vibrations intended to affect the x-axis are influencing the y-axis stronger at that frequency. The CSD and coherence plots clue the test engineer into this problem on the multi-axis shaker.
Specific Indications
The CSD can be used to find mutual resonant frequencies for a pair of signals, and can also be used to determine the following information:
- A pair of signals with a CSD value of zero is uncorrelated, meaning they have no influence on one another.
- If the CSD is flat but the value is not zero, then the pair of signals are uncorrelated. However, the signals are either the same or nearly the same.
- If the CSD has a main lobe, then the pair of signals have some degree of correlation. Generally, a wider main lobe indicates a more uncorrelated pair and a narrower main lobe indicates a more correlated pair.
- A CSD with a spike at some frequency (F) in Hertz (Hz) indicates that the pair of signals is periodically correlated every 1/F seconds. The correlation may be due to a resonant frequency at F.
- If the CSD is nearly flat, then the pair samples are mostly uncorrelated.
- A CSD with a single spike at 0 Hz is likely the result of a large DC offset in both signals.
- A CSD with a medium-width main lobe indicates that the samples in one signal are correlated with other samples located close in time, but the correlation diminishes with separation in time.
Vibration Testing and Analysis Software
Cross-spectral density offers engineers a method to quantify how two signals interact in the frequency domain. By leveraging the Fourier transform of the cross-correlation function, CSD identifies shared resonant frequencies, signal coherence, and energy transfer between channels. Unlike PSD, which examines a single signal, CSD enables comparison across channels, necessary for diagnosing coupled systems or influence between measurements.
The power distribution of a CSD plot, coupled with patterns such as lobes or spikes, can help guide engineers’ interpretation of correlation strength and resonance. While the true CSD cannot be measured directly, methods like Welch’s provide reliable estimates, essential for practical vibration analysis and advanced diagnostics.
The cross-correlation plot is available with the ObserVIEW Advanced Analysis package. For more information, please visit the software module page.