Advanced Analysis
Employ an advanced analysis of one or multiple waveforms with features such as resampling, filtering, and advanced graphing functions (PSD, transfer function, etc.).
Download Demo All Software FeaturesEmploy an advanced analysis of one or multiple waveforms with features such as resampling, filtering, and advanced graphing functions (PSD, transfer function, etc.).
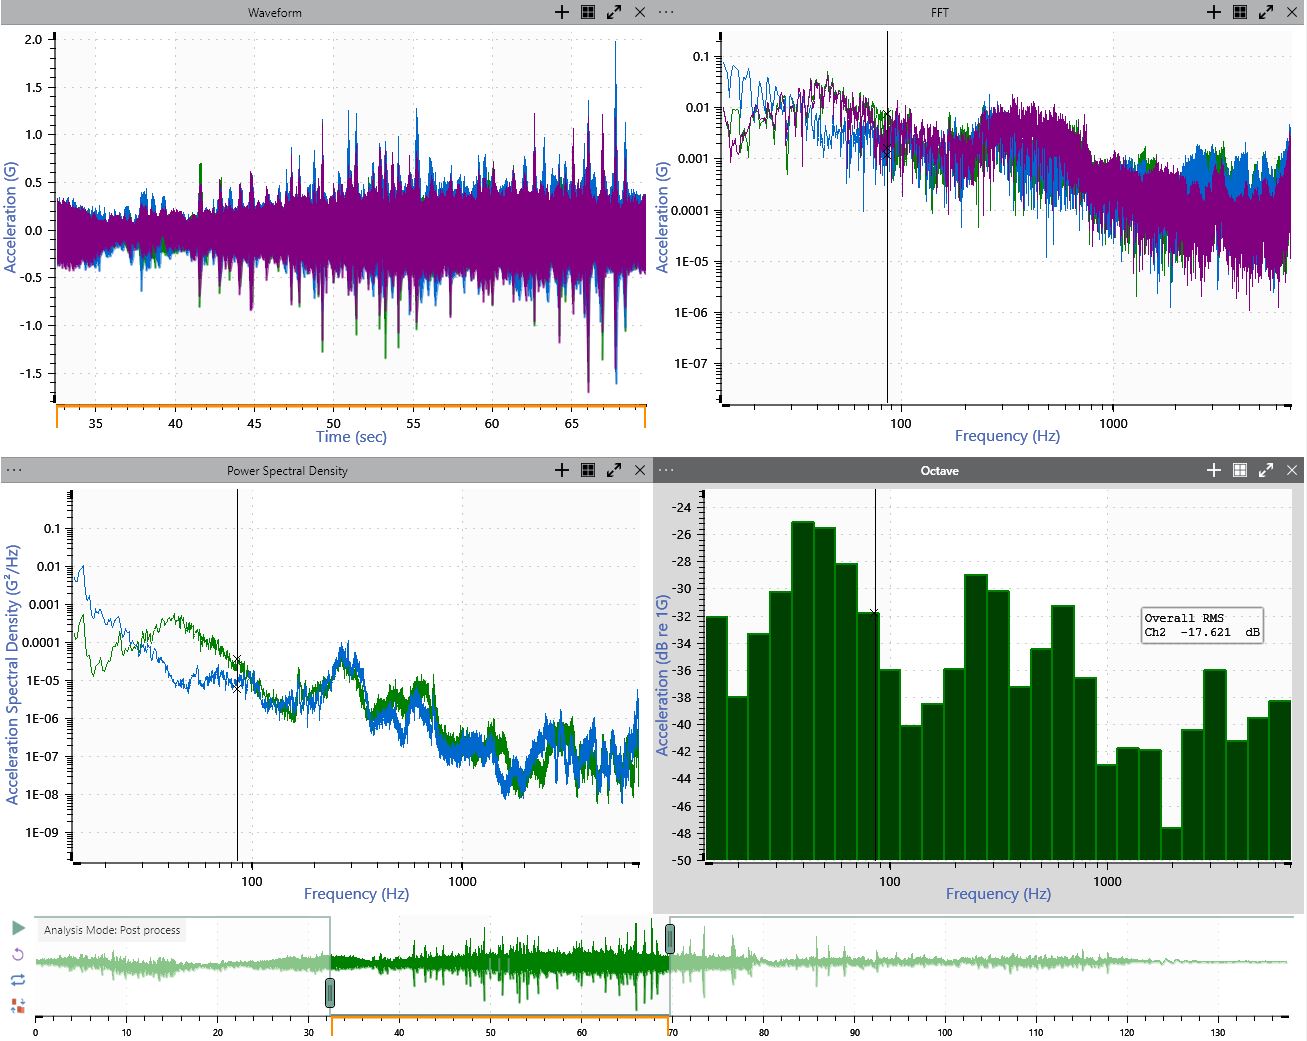
Download Demo All Software FeaturesAnalyze time-waveform data in the frequency domain with the following advanced graphing functions:
Engineers can copy and paste a PSD profile from an ObserVIEW graph to the VibrationVIEW control software for vibration testing. ObserVIEW offers several tools for editing and analysis to generate a random profile from recorded data that meets test criteria.
Engineers can also compare profiles to determine which is the most suitable for the test goals.
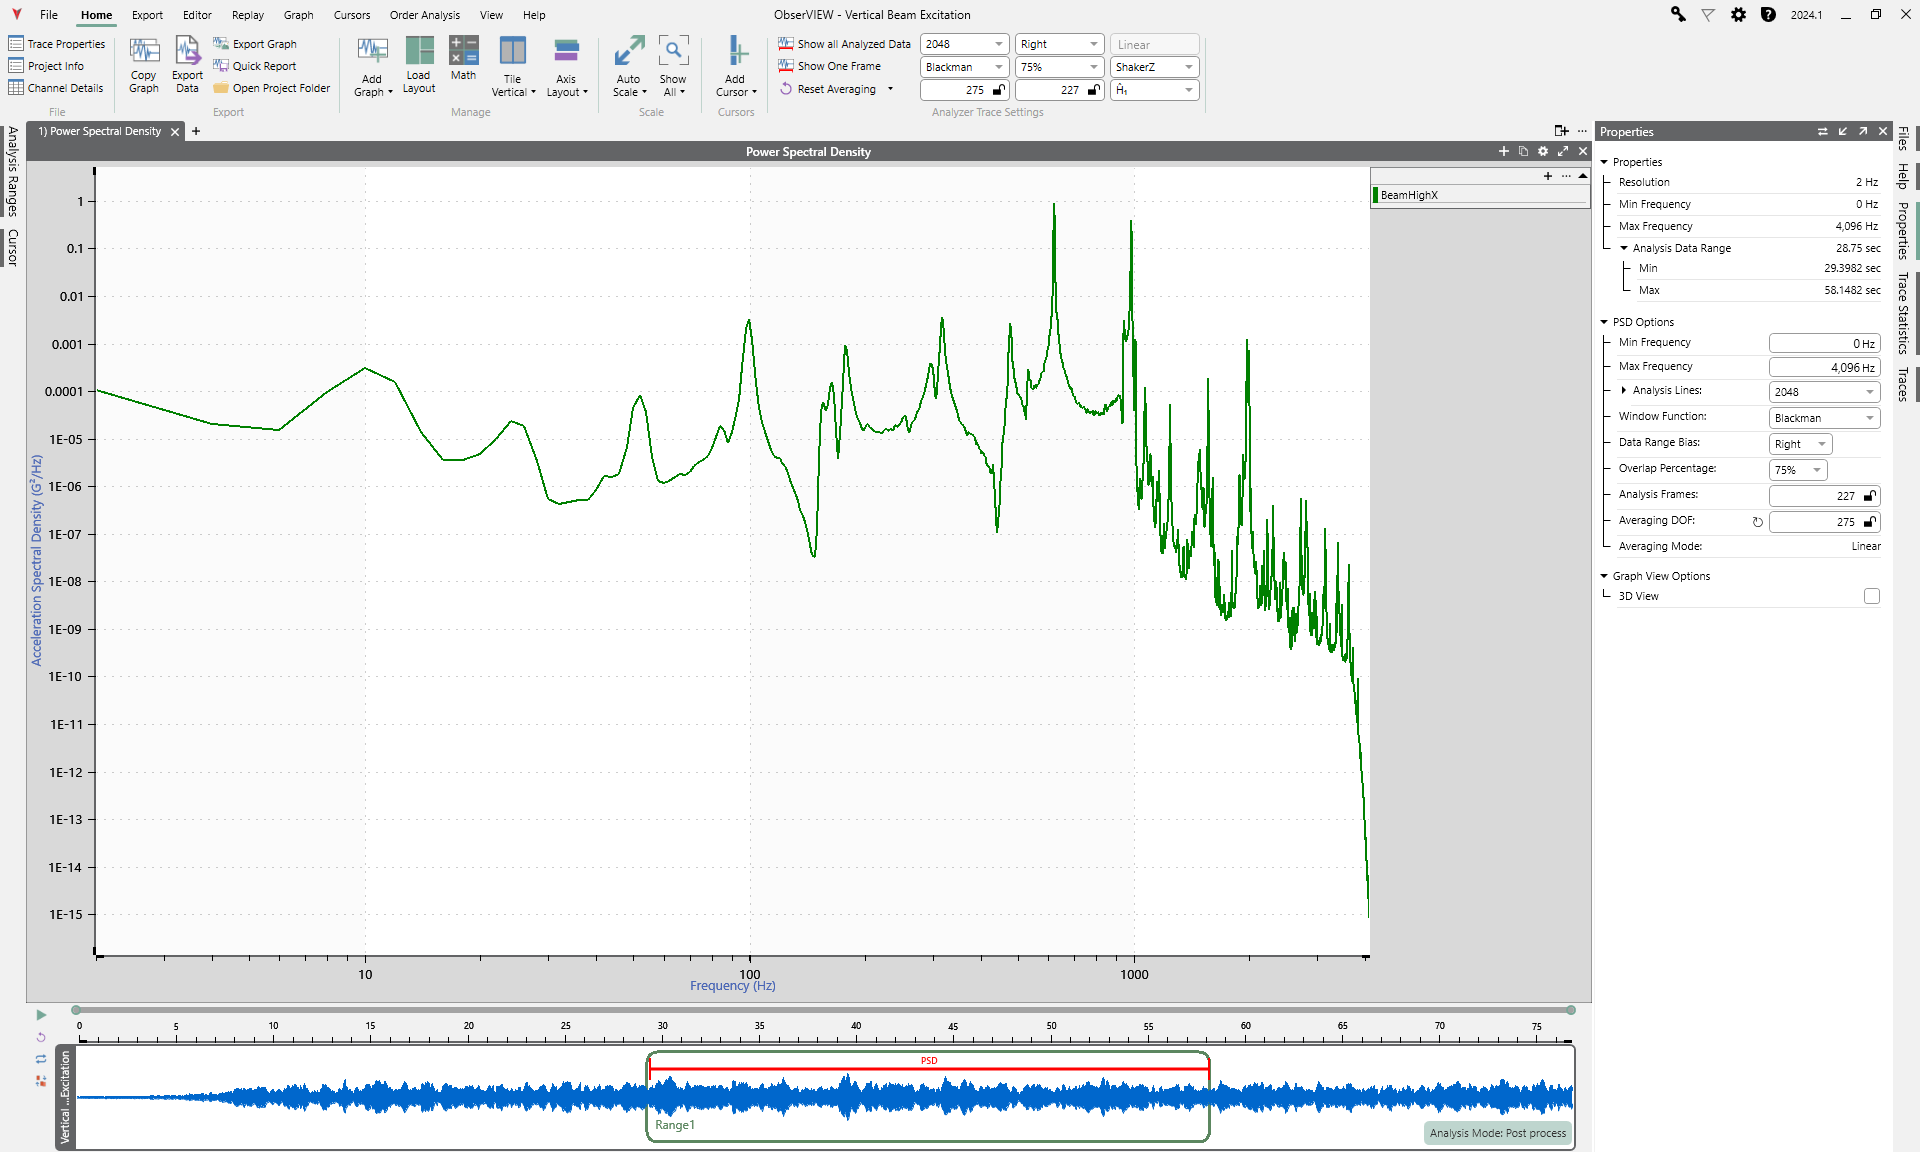
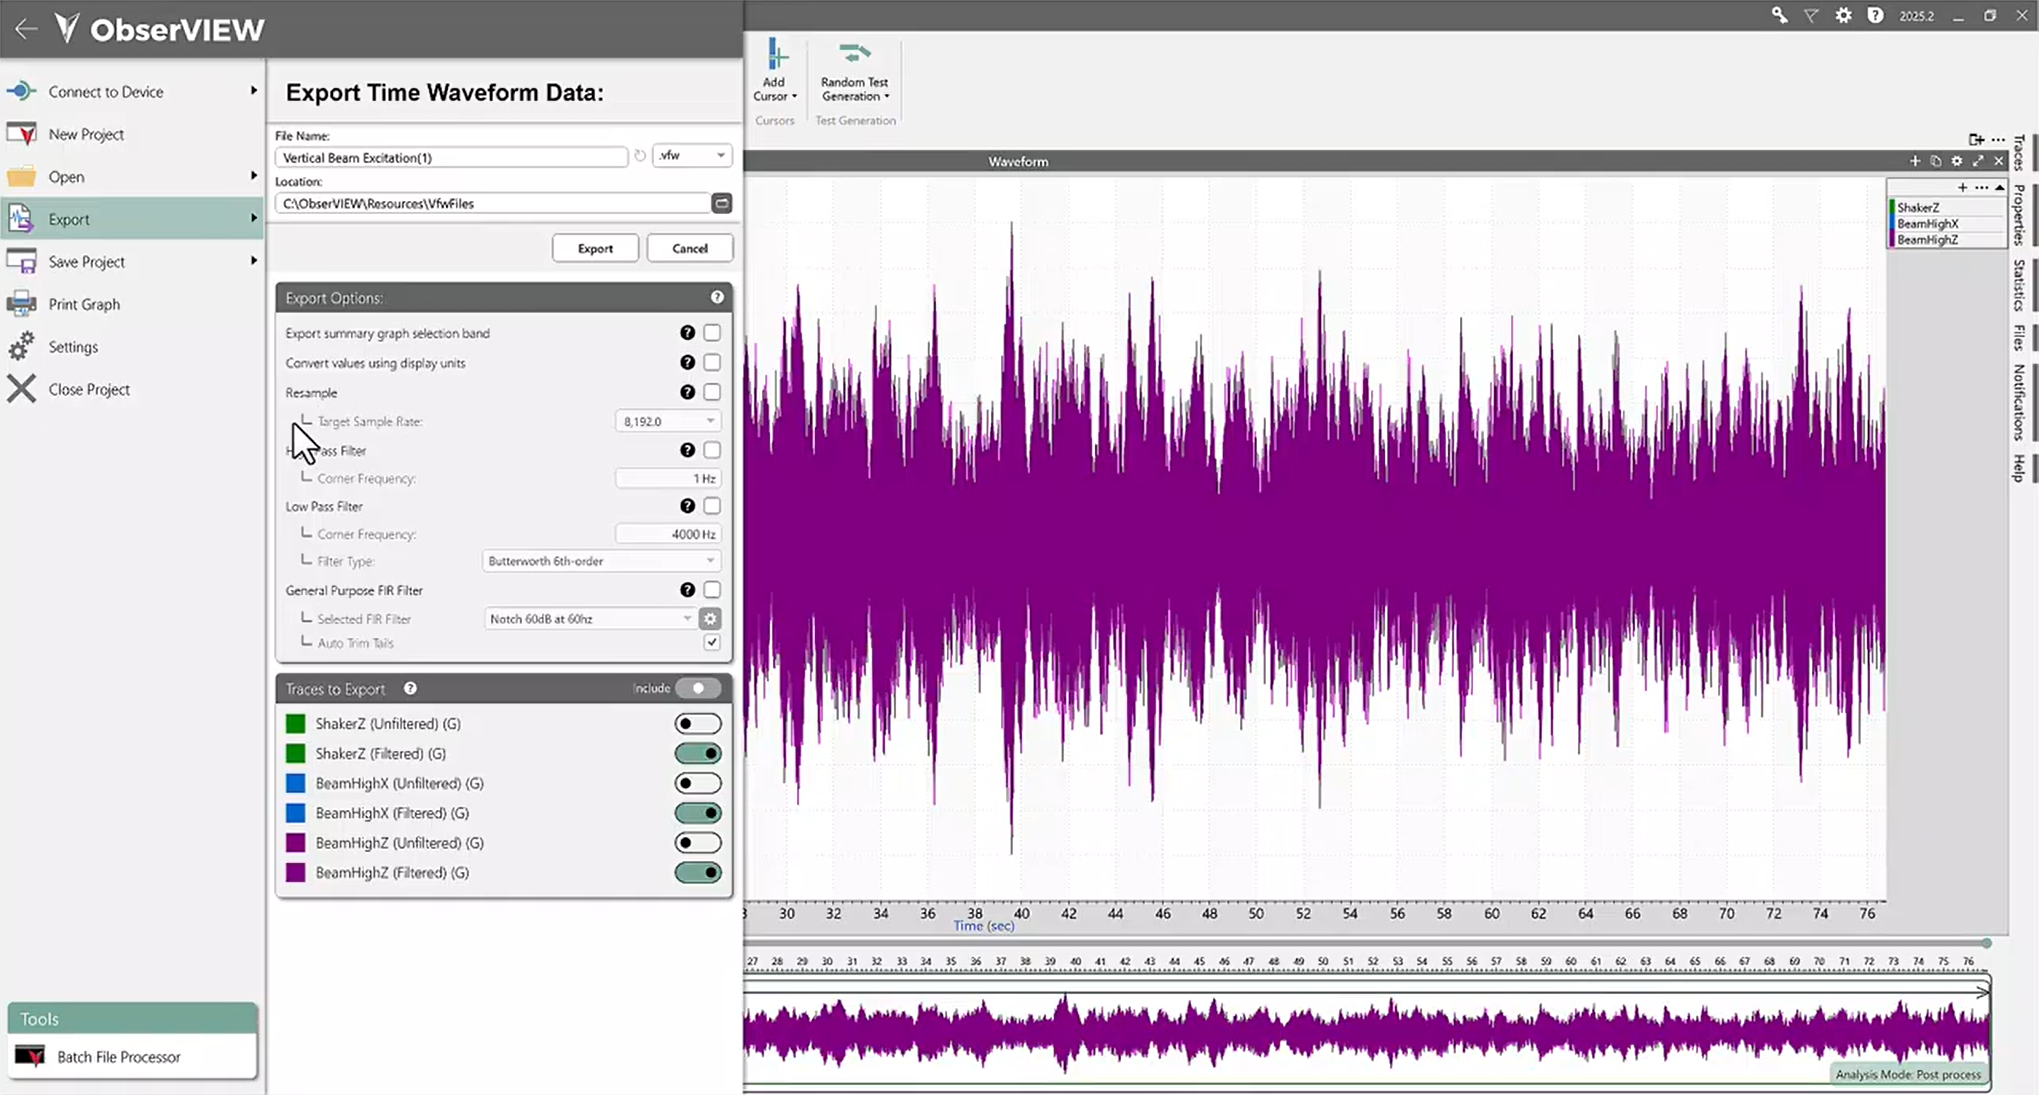
RESAMPLING: Adjust the sample rate of a time waveform
FILTERING: Filter out, accept, or boost frequency components in a time waveform; options include high-pass, low-pass, and bandpass filters
In addition to advanced analysis tools, the ObserVIEW Advanced license includes Multimedia Sync, Octave Analysis, and Math Traces.
Multimedia Sync opens a video file(s) and syncs it with the time of the recording. Users can view the video and data playback in sync, extract images/data for a report, and add other media files such as additional video files and audio files after the player is open. LEARN MORE.
Octave Analysis generates octave bands with an 8th-order filter to meet IEC 61260-1 Class 1 filter specifications. It performs filter-based analysis and can apply A and C frequency weighting, linear and exponential averaging, and peak hold. LEARN MORE.
Math Traces is a free entry field that builds a trace using existing trace data operated on by functions and operators. LEARN MORE.
Fast Fourier transform (FFT) and power spectral density (PSD) mathematics are powerful tools for analyzing the characteristics of a waveform. There are also several mathematic functions that help to explain the relationships between two or more waveforms.
The “Mathematics for Understanding Waveform Relationships” VRU course introduces three functions for comparing data: transfer function, correlation, and cross-spectral density.