
When you’re running a vibration test on a shaker, how do you know that the controller is performing in the way it claims? In some industries, trust in an established manufacturer is not enough; the engineer must confirm that the control algorithm is performing as expected. If you were performing a test on a highly sensitive, extremely expensive piece of equipment, would you leave anything up to chance?
Examples from the Lab
For example, some algorithms use low-level multiplication during PSD ramp-up. However, real-world data is rarely linear. The engineer may see a clean PSD in the software, but there’s no guarantee that the low-level data will increase linearly like an across-the-board multiplier. As such, the engineer may not see potentially damaging events during ramp-up or a short-duration test.
Similarly, engineers may choose to validate their defined test parameters for additional assurance that their test is performing as intended.
For example, we had a customer who revisited a test they ran years ago but could not replicate. They had a servo-hydraulic pneumatic shaker and wanted to run a sine test up to 500 hertz. We were surprised the customer could run such a high frequency on a small shaker of this type. So, we asked the technician to turn off the test’s tracking filters. The customer was enthusiastic because the test worked perfectly, but that wasn’t the reality. Without a tracking filter, the system assumed all the test energy was at the frequency of interest. As such, the test wasn’t controlling out-of-band energy.
Validating Vibration Control Test Results
Even if you are not in an industry where an error could cost millions, every lab wants reliable test results. Validating your results protects your lab from hidden risk and confirms system accuracy, providing assurance to the engineer running the test.
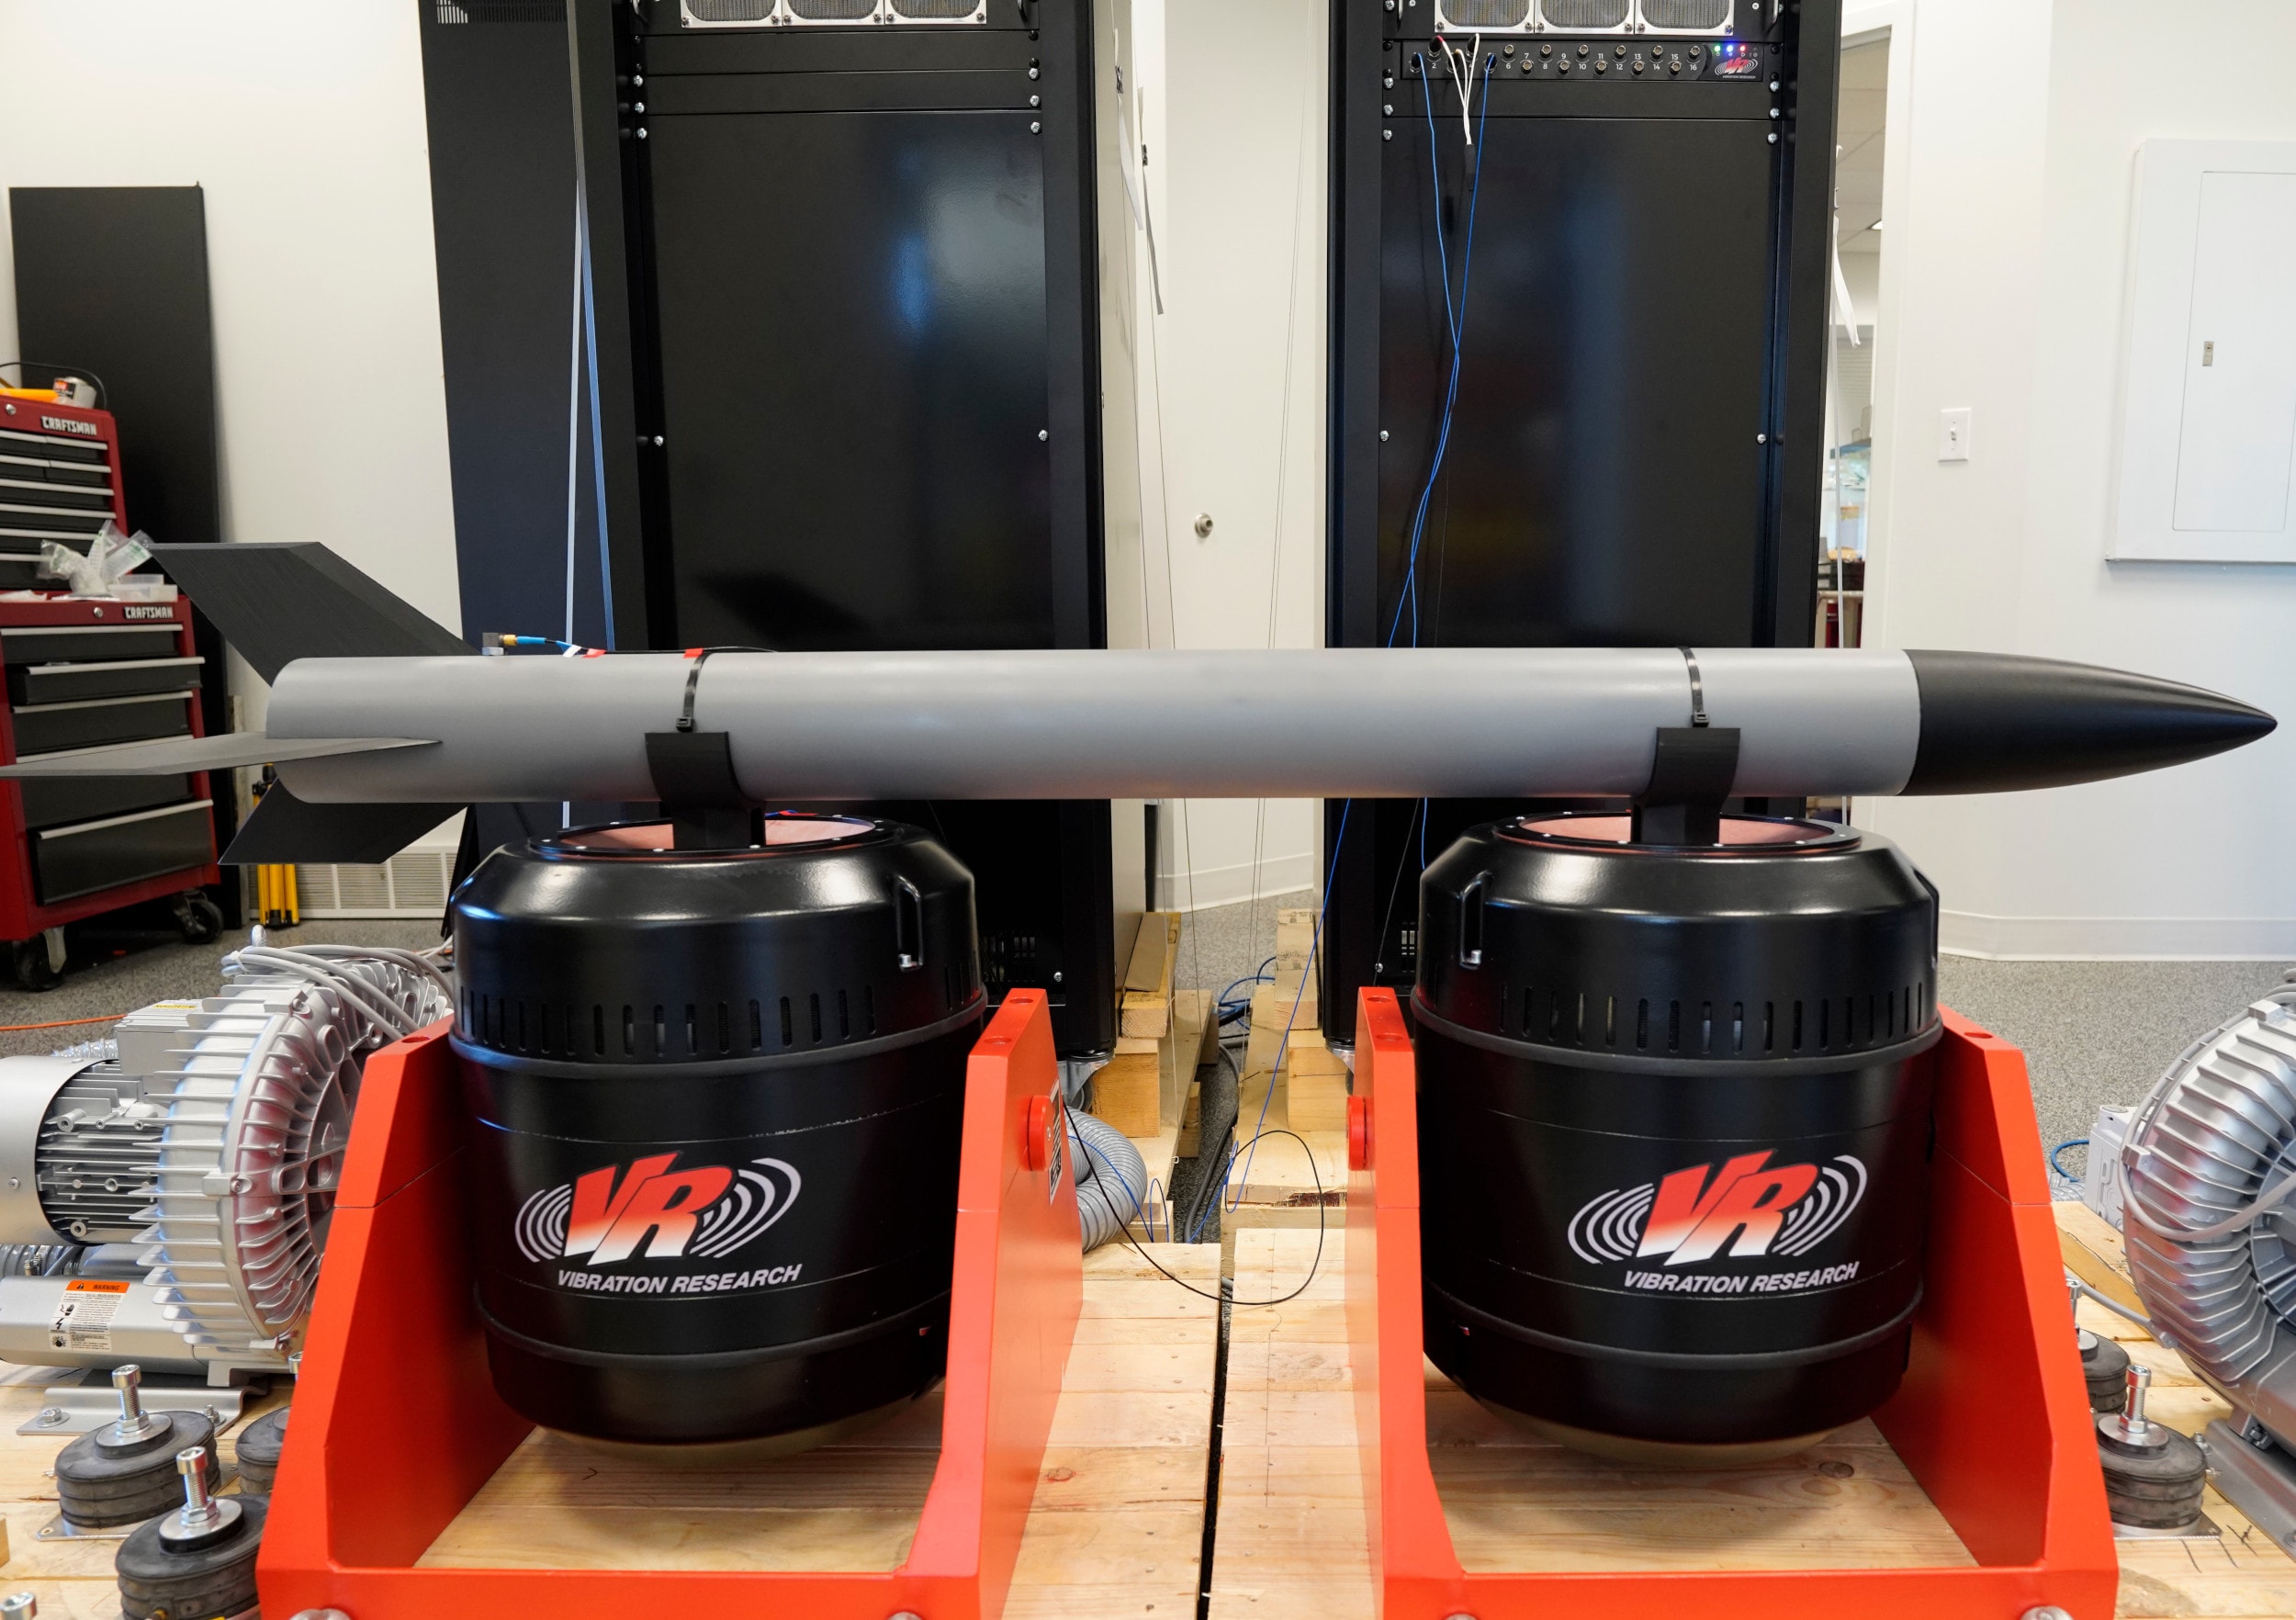
In this article, we will discuss how to validate vibration control test results using the ObserVIEW analysis software. Your lab will need an independent data acquisition system (all Vibration Research controllers can function as data recorders), sensors for the data you seek to analyze, and, potentially, breakout cables for measuring at the same points.
Which Claims Should I Validate?
- Random averaging accuracy: Correct windowing, overlap, and equivalent noise bandwidth; linear vs. exponential equivalence
- Multi-shaker control performance: Decoupling, in-tolerance control points
- Control loop stability: Control before and after resonances, application of limits or aborts
- Signal fidelity: Low distortion, accurate reproduction of field data
- Advanced capabilities: Time-data replication, correct power allocation of mixed-mode tests
Clean Data vs. Accurate Data
There is a tendency in the vibration testing industry to want smooth data for reporting. However, it is necessary to ask whether “clean” data reflects the real world, as we’ve discussed in length regarding short-duration random tests. A controller that smooths out ragged data can lead to bigger issues, such as a false pass due to under-testing.
At Vibration Research, we suggest that engineers get a second opinion. If you’d like to validate test results, record the test and compare the data to the controller’s results. Gathering great-looking test data is ideal, but an accurate test is more important.
A side-by-side comparison can confirm system fidelity or highlight areas where the data are inconsistent. One test is worth 1,000 opinions.
 For example, when running a multi-exciter, single-axis test, take a recording with up to 5 triaxial accelerometers. Compare the test and recording PSDs (making sure to use the same PSD parameters) and observe if they are within range. If the controller displays flat PSDs, but the recording shows 6-20 dB of variation, then the control may likely be obscuring some of the data.
The following are some of the tools engineers can use for validation.
ObserVIEW Software
The ObserVIEW software features analysis tools for recording, editing, graphing, and evaluation. Following a recorded test run, engineers can import the data to ObserVIEW for comparison. Engineers can import compatible data files from any recording device.
ObserVIEW displays data as graph traces. In the Analysis Ranges pane, you can add an additional file to a project or create an analysis range from an imported file. You can also copy and paste graph traces between graphs or projects.
Graphing
When considering random vibration, the power spectral density (PSD) is a primary tool for validation. The PSD displays the distribution of signal energy over frequency and can validate random control accuracy, bandwidth, and variance.
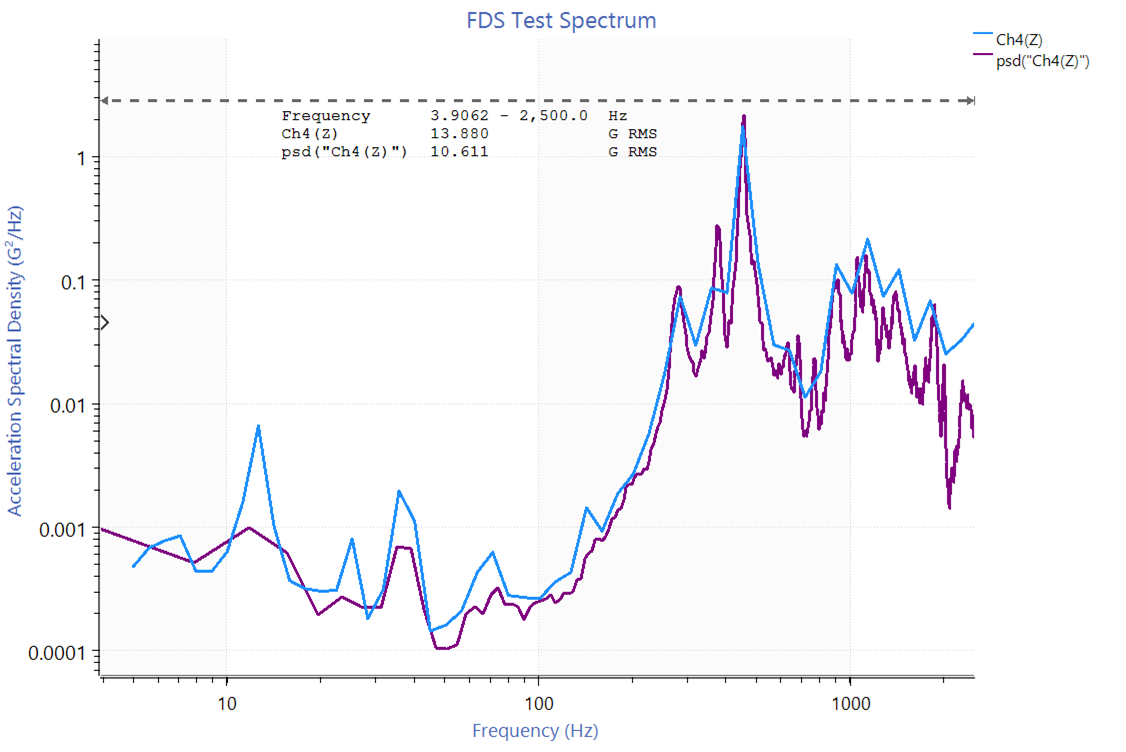
FDS-generated PSD with kurtosis control compared to linearly averaged PSD using the same data.
Engineers can also use transfer functions, coherence functions, spectrograms, and probability density functions for comparison and validation.
- Transfer function: Helps indicate stability across resonances and system dynamics
- Coherence function: Indicates the linear relationship between two signals, allowing the engineer to evaluate the relative motion between them
- Spectrogram: Helps to visualize how frequency content evolves and identify transients or drift
- Probability density function: Evaluates amplitude distribution, providing the probability of values occurring within certain ranges
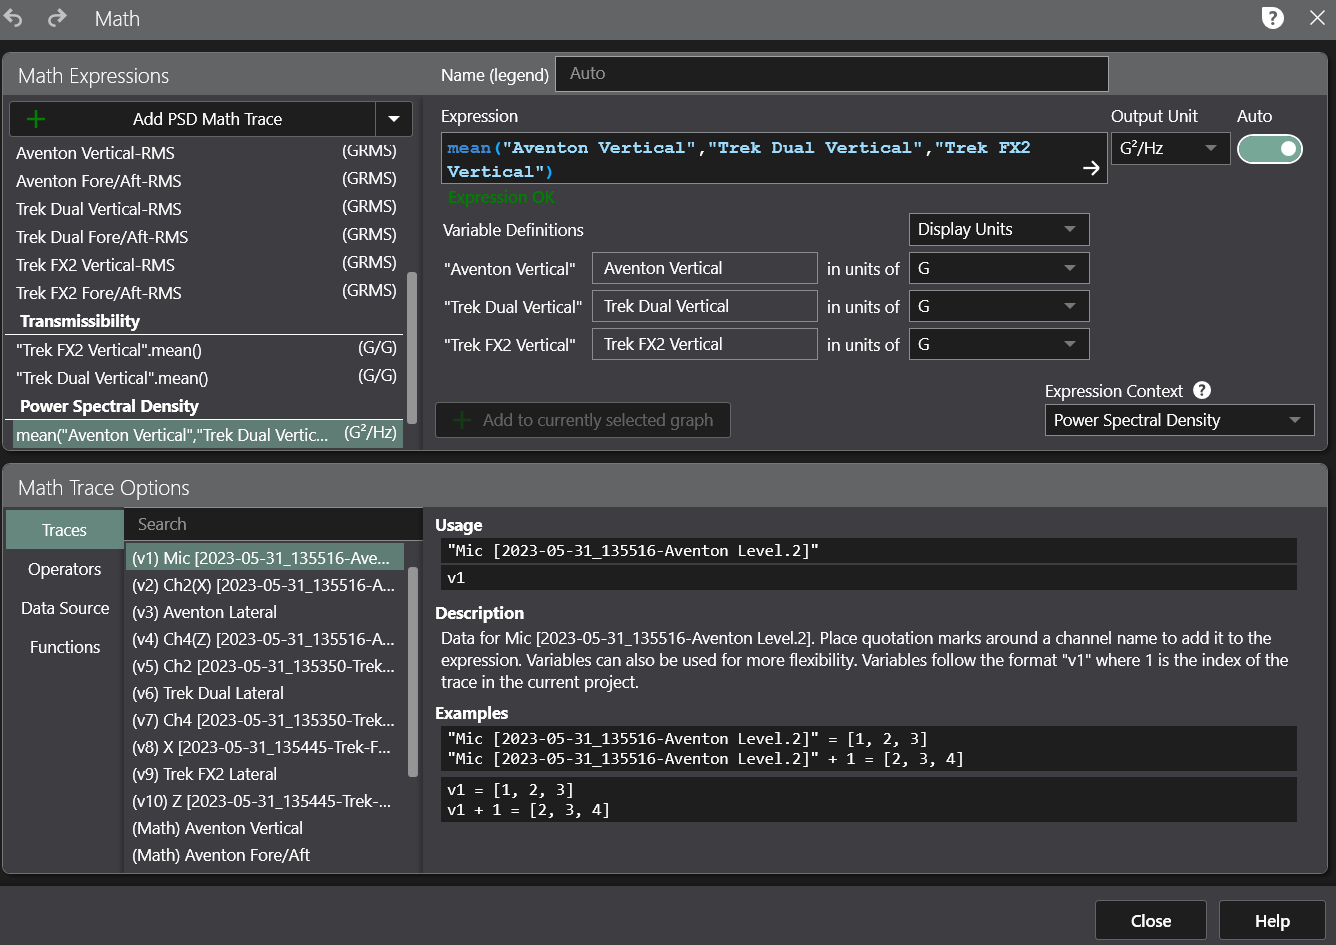
Math
ObserVIEW’s math traces offer ample opportunity to evaluate and compare data. Math traces add a user-defined function to a graph. Engineers can use them to compute statistics, comparisons, averaging and more. Examples in the context of validating controller claims include:
- Create an average PSD trace
- Find the ratio of two FFTs
- Add tolerance lines centered about a pasted demand trace
- Add a constant reference
- And more
For a comprehensive list of examples, visit the 40 Uses for Math Traces article.
What Are Potential Reasons for Inconsistencies?
If the recorded test data and controller results are not consistent after comparison, the data may point to the reason. If the recorded test data shows variation and the test results are flat, it is possible that the control algorithm is smoothing out outliers, noise, or resonances that are important to note. Again, smooth results look great on paper, but the risks of over/under-testing can be severe.
Some methods control algorithms use to produce “clean” data include:
- Averaging
- Update latency
- Windowing/leakage
- PSD normalization
- Outlier rejection
- Control/channel weighting
- Exponential vs. linear averaging
- Filtering
Equipment for Validating a Controller
Validating a control system builds confidence in test results. The ObserVR1000 is a portable data acquisition system that engineers can use to validate the claims of their controller. If you are interested in a demo system or in-person demonstration to compare systems, please contact our sales team for support.