Vibration test engineers need test acceleration methods because product fatigue occurs over time. The fatigue damage spectrum (FDS) calculates the relative damage a product will likely experience, and engineers can use it to create an accelerated random vibration test profile that is the damage equivalent to the end-use environment.
When engineers develop a test with FDS software, there is the possibility of over-accelerating the profile and risking unintentional damage. On the other hand, they may have room to increase acceleration safely and save time.
To help determine how much acceleration is “just right,” engineers can use the extreme response spectrum (ERS). The ERS not only helps engineers validate accelerated test profiles but also serves as a tool for damage comparison.
What is the Extreme Response Spectrum?
The ERS is a response function that represents a system’s maximum amplitude response to random excitation. It plots the theoretical frequency response of a single-degree-of-freedom (SDOF) system. In the book “Specification Development,” Lalanne1 proposed the ERS as a tool to evaluate vibration severity between:
- Different field environments
- A field environment and test specification
- Different test specifications
Lalanne suggested the ERS for this type of evaluation over the power spectral density (PSD), which estimates the distribution of a random vibration signal’s strength across a frequency spectrum. PSD averaging smooths out these spectra, thus averaging out the extreme peaks that are typically the most damaging.
As the ERS represents the test’s most severe random vibration, it is a tool engineers can use to ensure their test profile includes the maximum stress levels their product is likely to incur in the field. Keep in mind that these are the most extreme instances of vibration and do not occur frequently.
Shock Response Spectra and ERS
The ERS is similar to the shock response spectrum (SRS) because they both model extreme displacement2. The SRS estimates a time waveform’s maximum response to a transient event for a given frequency range. The ERS estimates a frequency-domain waveform’s maximum response to stationary random vibration. Both provide an SDOF system’s theoretical response to excitation.
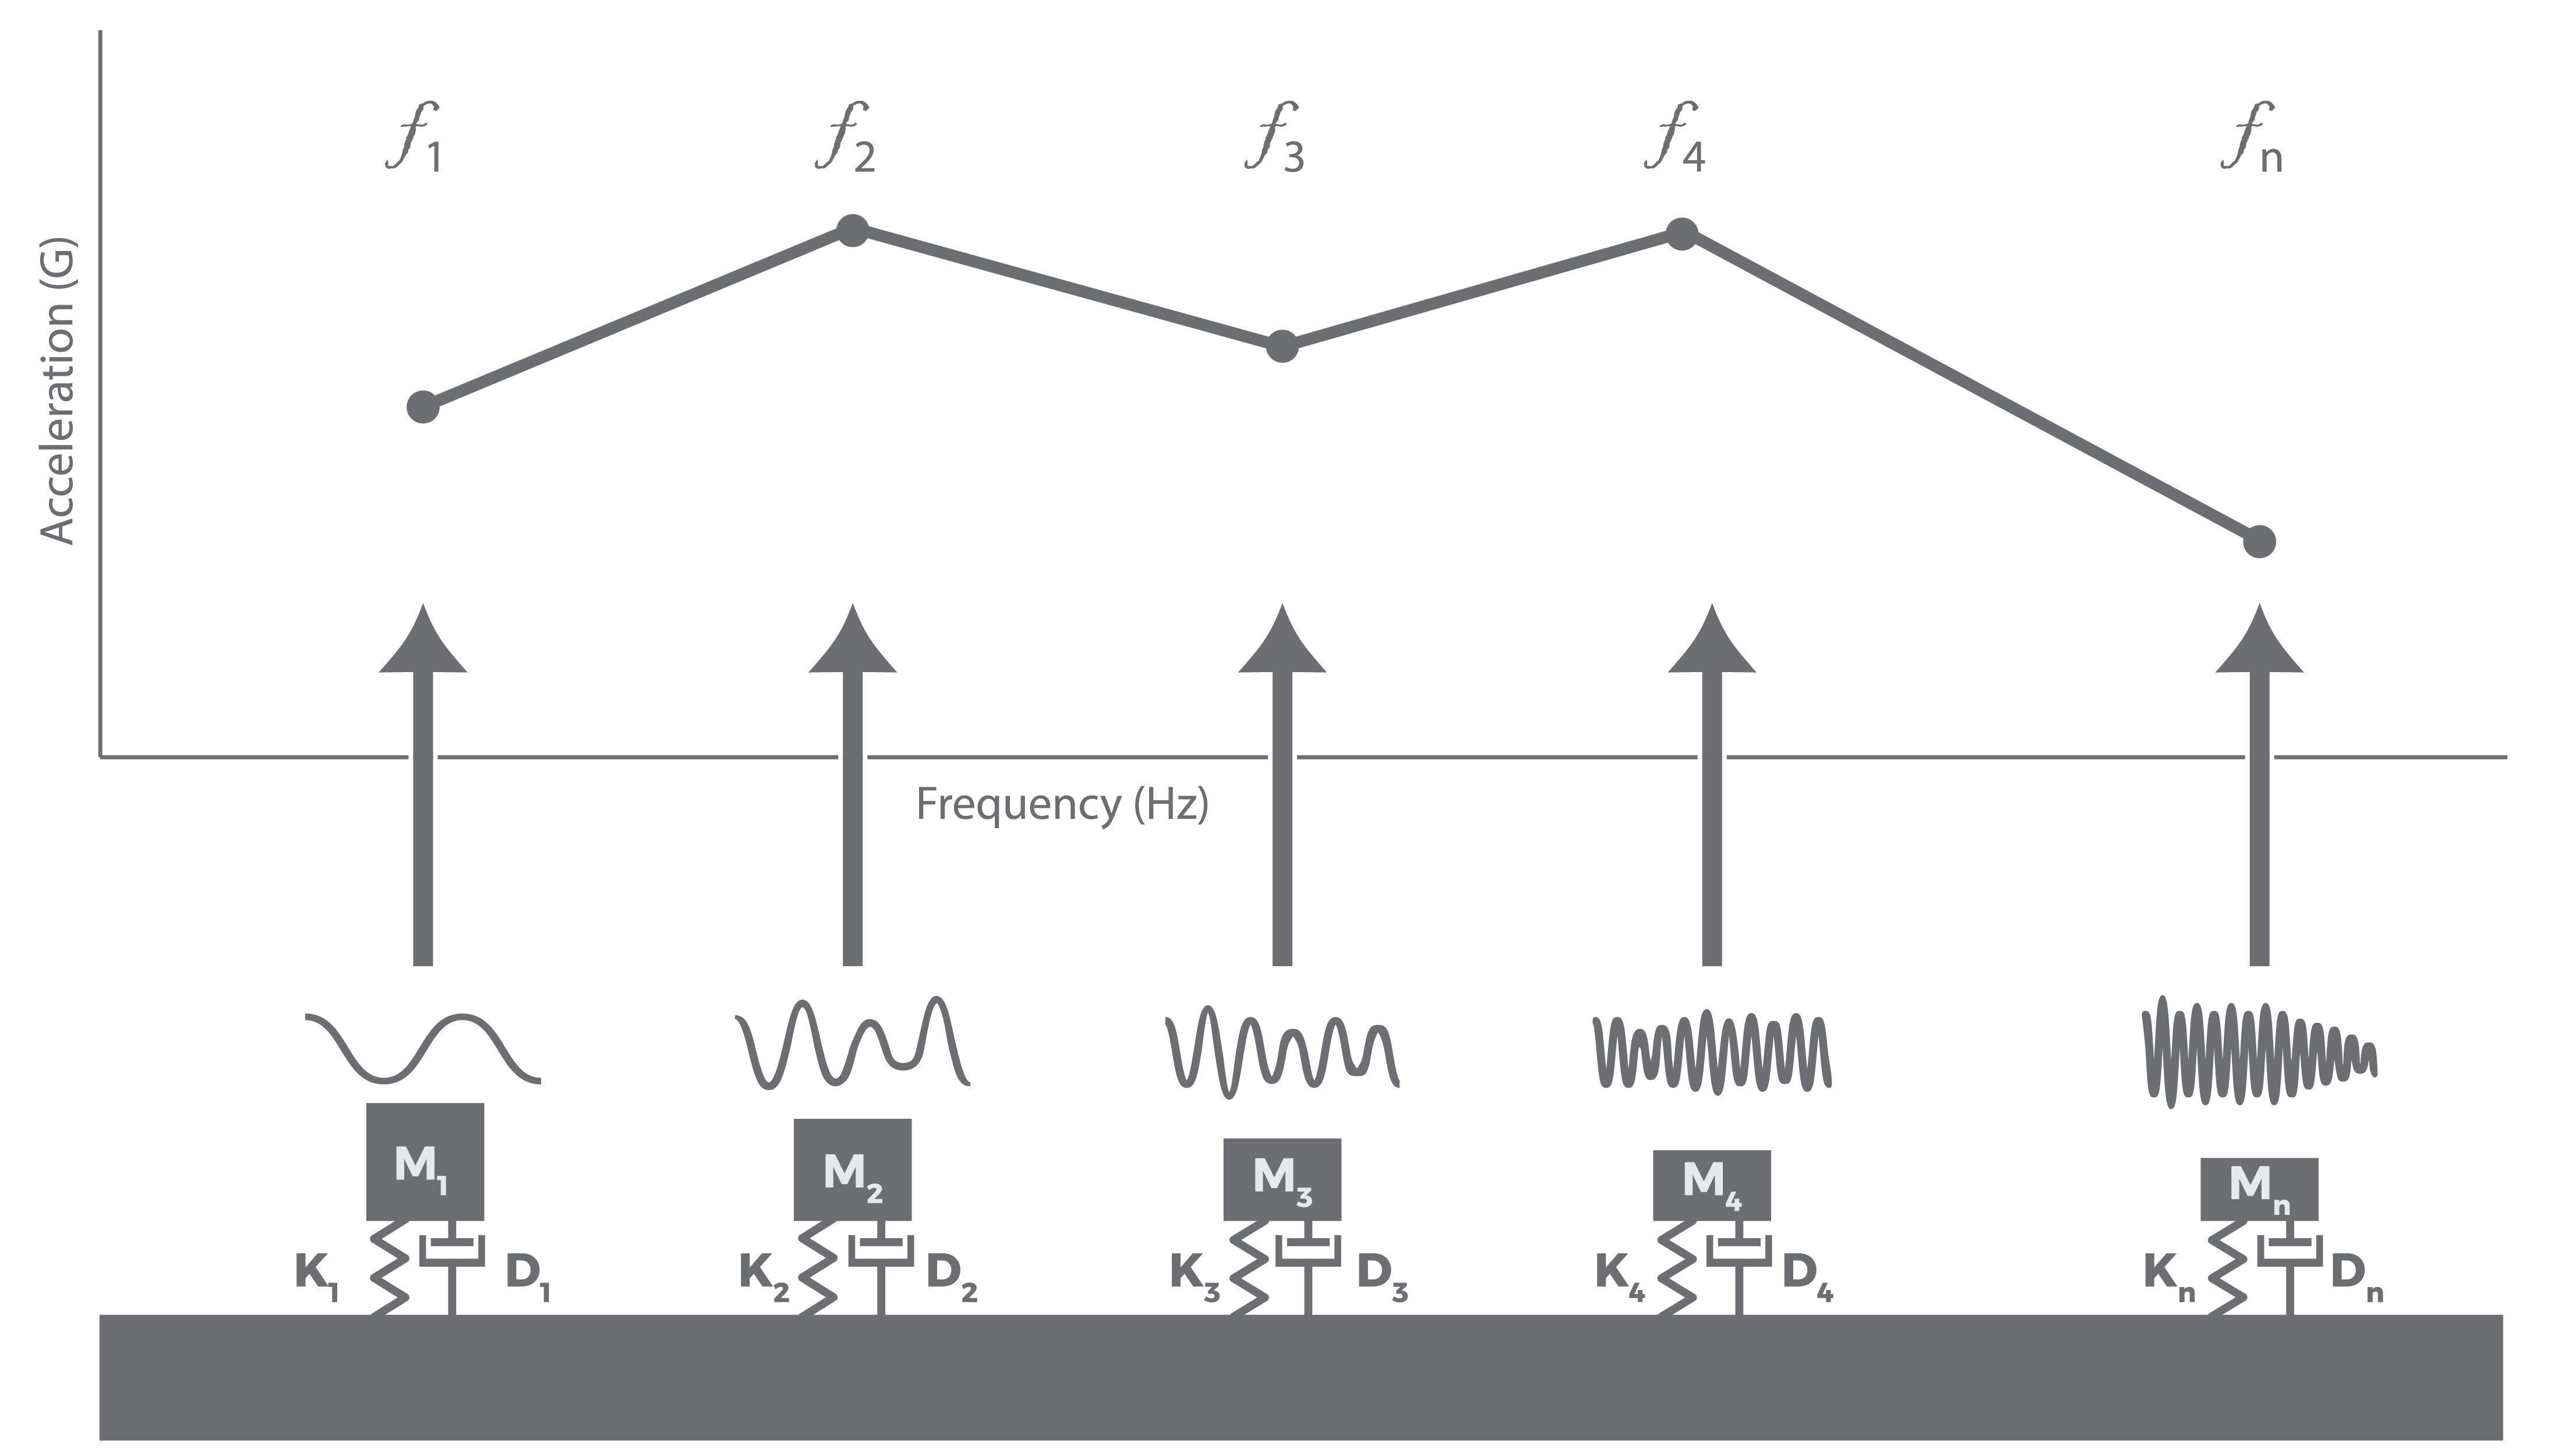
A basic model of the SRS.
The SRS models responses to high-frequency shocks such as earthquakes, rocket separation, and shipboard shock. The ERS models the maximum response to random vibration, which is typically lower in amplitude than complex shock events and occurs over a longer duration.
As with the SRS, the ERS is a theoretical response that engineers can use for conservative assumptions. Systems in the real-world are rarely single degree-of-freedom.
Lifetime Fatigue
An FDS-correlated random test profile represents the fatigue damage a product will likely experience in a typical lifetime of use. The lifetime fatigue is the sum of the FDS from all environments the product encounters, factoring in the distribution of individual contributions.
Software programs like ObserVIEW allow engineers to accelerate the FDS-correlated test profile to achieve a lifetime of damage on a shaker in a shorter time. To validate the accelerated profile, engineers can use the test’s SRS/ERS for comparison. If the accelerated test’s extreme response exceeds the ERS tolerance, then the test acceleration must be reduced (increase test duration).
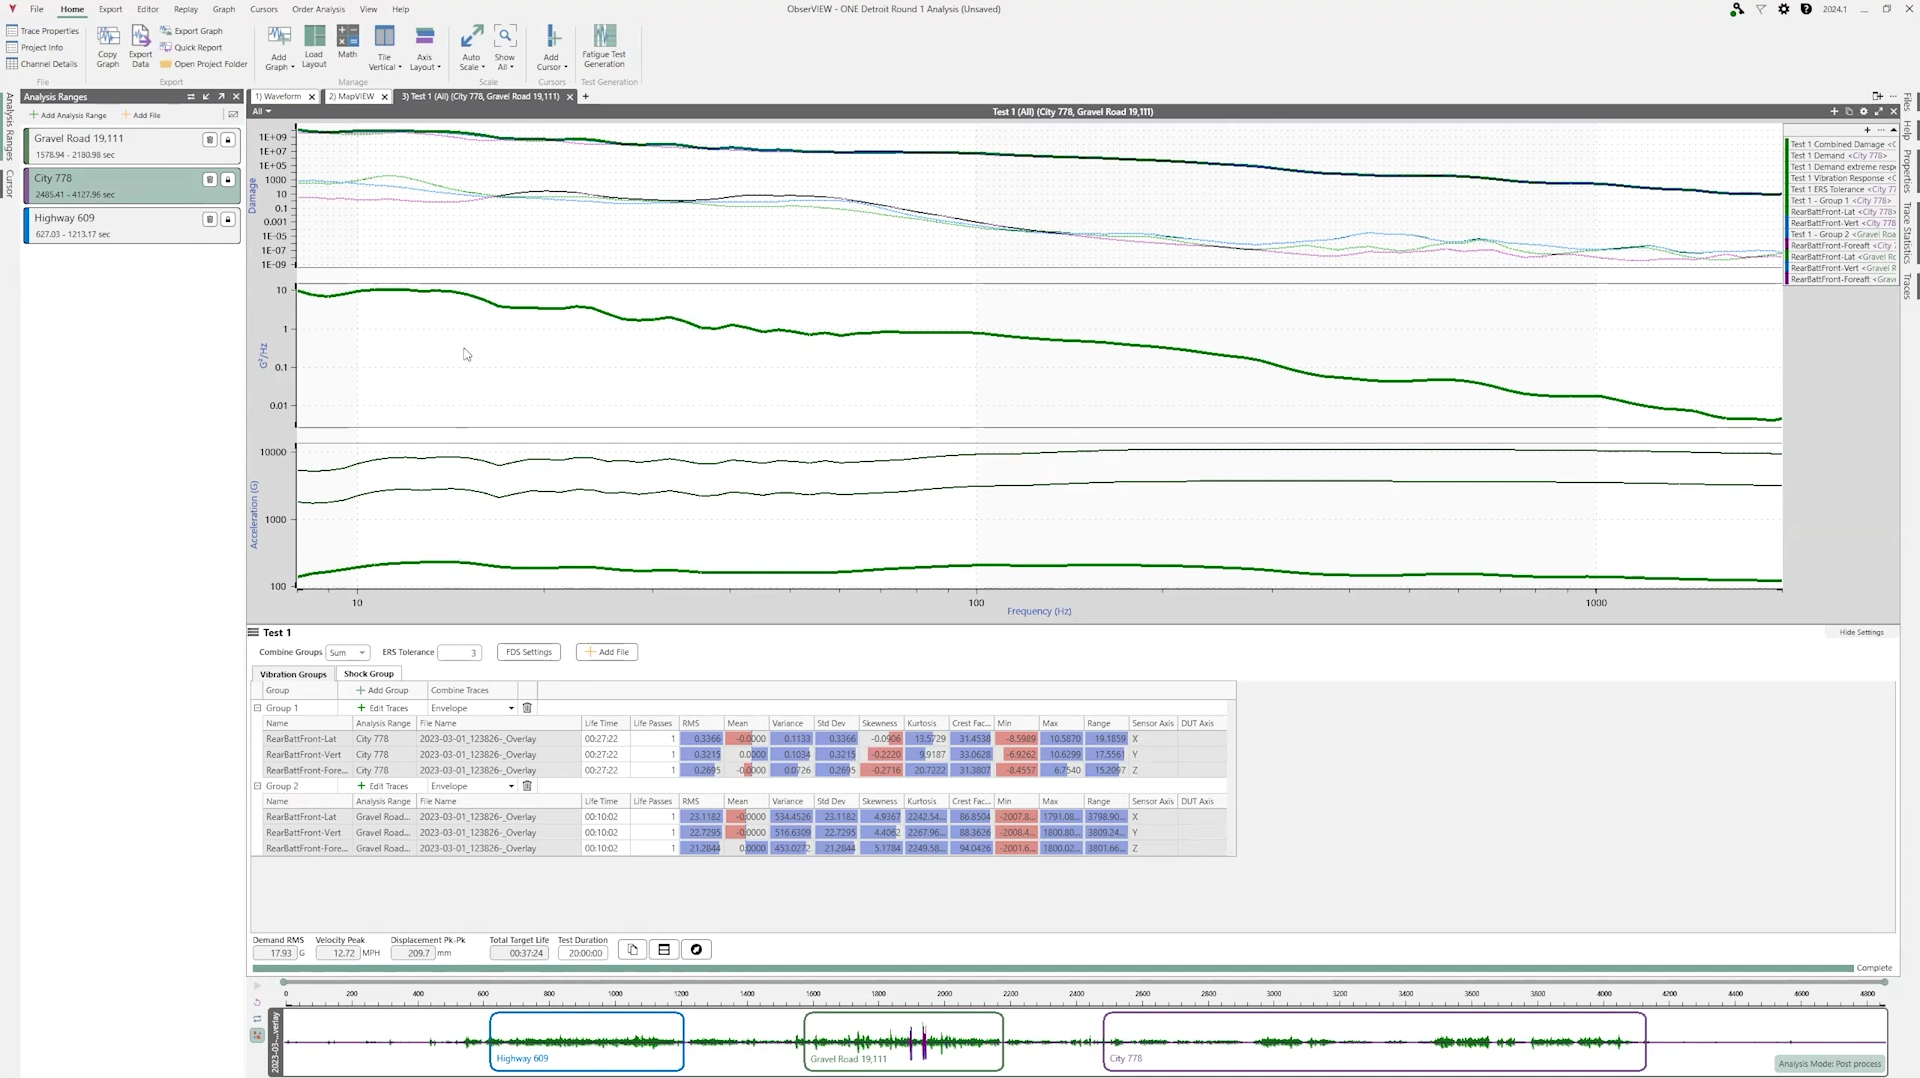
Test profile and ERS comparison in the Random Test Generation option.
Comparison
Engineers can also use the ERS as a “relative vibration test severity comparison tool” between different test profiles/procedures so long as the product and material properties are the same3. The graph traces should have the same property settings for comparison, including damping factor.
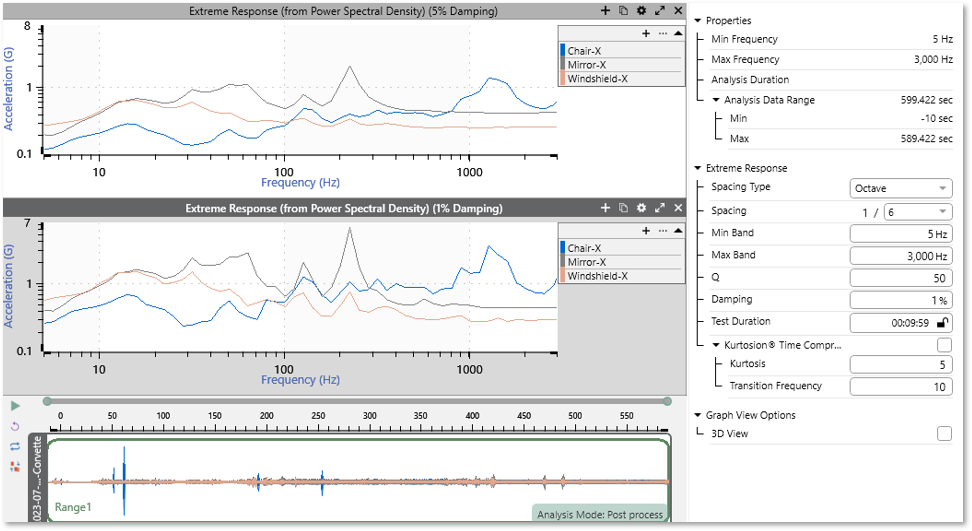
Comparison of ERS for x-axis data from three locations.
Random Test Generation in ObserVIEW
ObserVIEW versions 2025 and newer include an ERS graph trace option. The software can calculate the ERS from any acceleration PSD data (FDS Test Spectrum, PSD, pasted trace, etc.).
In the Random Test Generation option, engineers can plot a test’s SRS or ERS to validate its acceleration level. If their original time waveform recording includes shock data, the software can generate a test SRS for comparison. Otherwise, it can scan one or multiple PSD files to create a composite ERS. The tolerance ERS is a multiple of the test ERS (3x by default).
Example uses include:
- Determine if an FDS-correlated test profile is over-accelerated
- Upload many recordings to analyze, combine the results, and determine if the test is over-accelerated
- Compare the ERS of a PSD to other ERS/SRS traces to calculate the SRS or maximax response spectrum (MRS)
ObserVIEW’s ERS trace can help verify that a test profile does not exceed any shock events that are likely to occur in the real world. Additionally, engineers can use the ERS to determine the most suitable test acceleration factor.