ObserVIEW’s analysis ranges make it possible to use multiple ranges of the same or different data files in one project. The addition of ranges in version 2025 expanded our customer’s capabilities for analysis within a single project. The following text discusses several applications of ObserVIEW’s analysis ranges.
How To Add Ranges to a Project
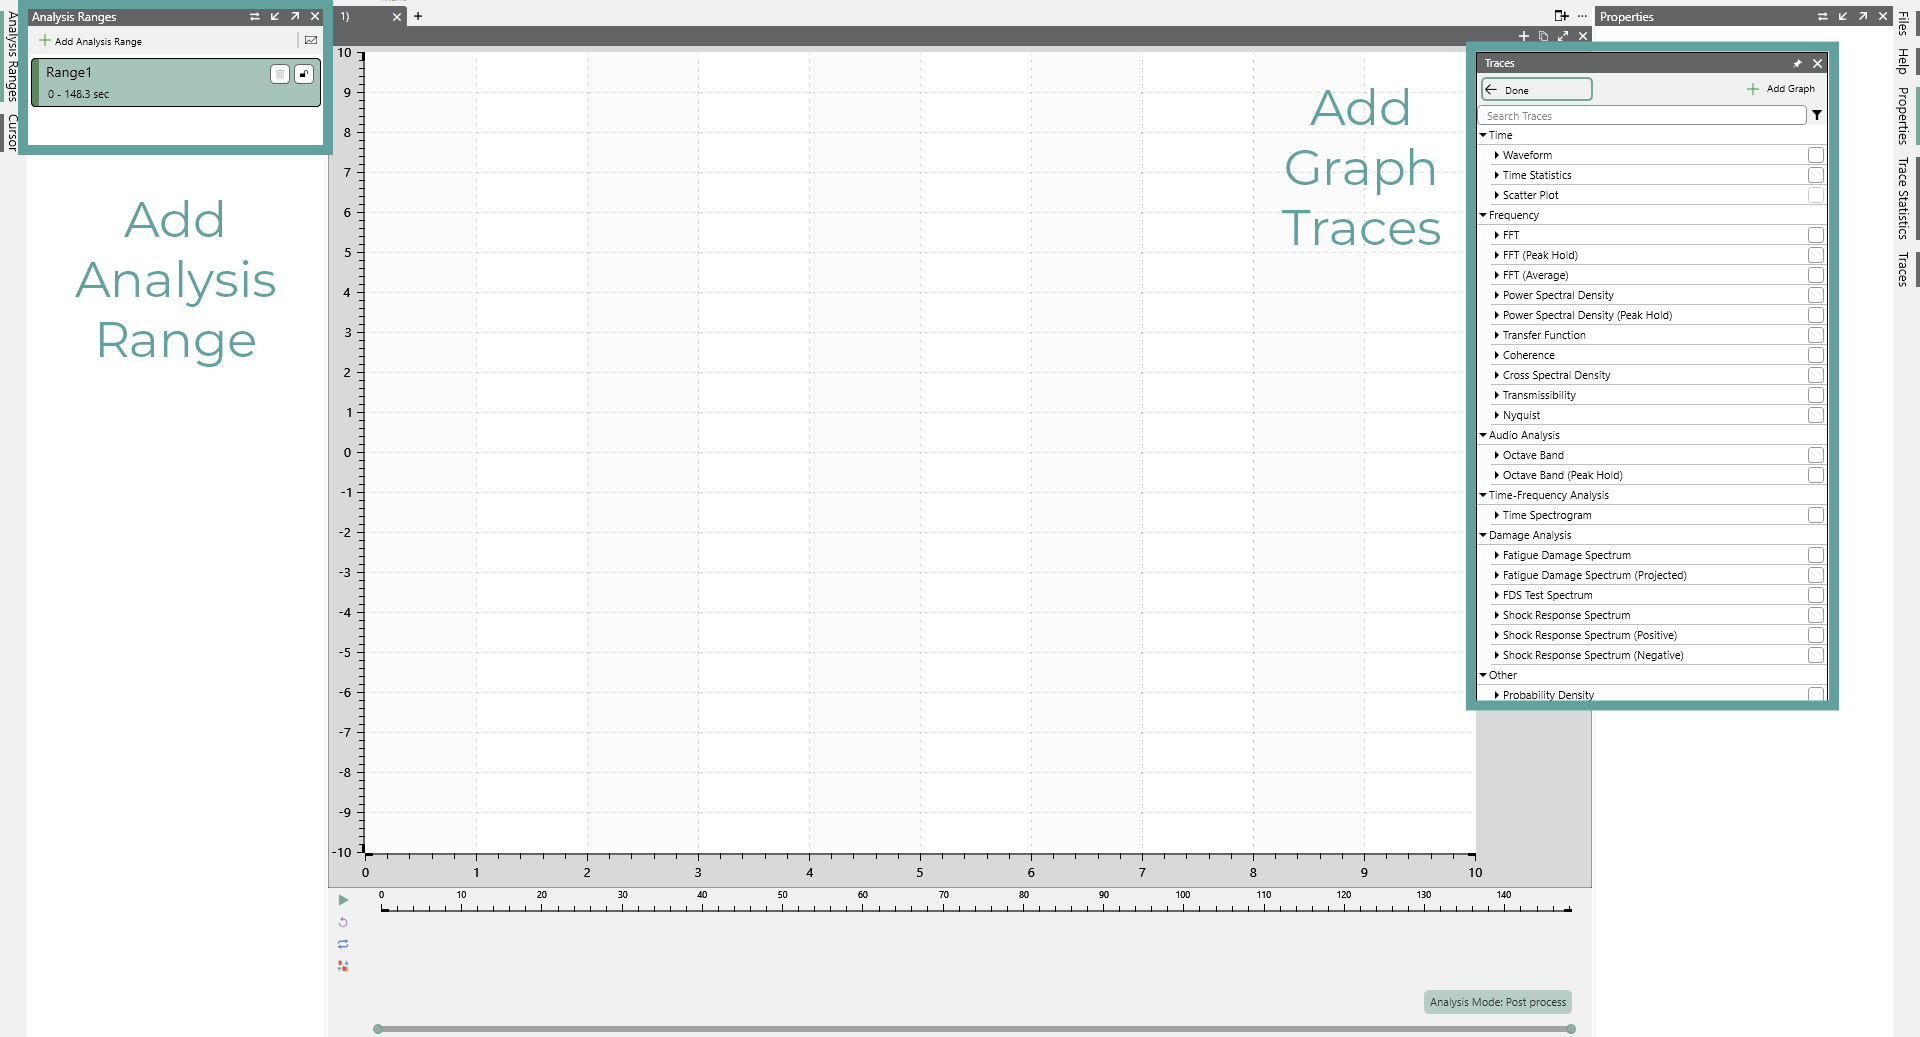
By default, the Analysis Ranges pane is to the left of the main graph. Select the Add Analysis Range button to create a new analysis range and the Add File button to add an additional data file to the project.
Applications of Analysis Ranges
Segment a data file by different field environments
When collecting data in the field, a data acquisition system may record vibration from multiple sources. For example, a vehicle test drive may include highways, city roads, and gravel roads. Engineers can compare the field environments or create a test profile that weighs the impact of each environment based on typical use.
In the following video, we demonstrate how to use analysis ranges to separate field environments in a single recording file and develop an accelerated random test profile.
Identify events of interest in a large data file
When reviewing field or test data, a large file may contain various event types. Engineers can create ranges around specific events, such as impacts, shifts, or failures, for analysis and comparison to baseline behavior.
Compare different runs of the same test
Engineers may repeat a test to verify consistency or confirm a fix. Creating ranges for each run allows for a quick comparison of stress response, vibration levels, or timing differences between tests.
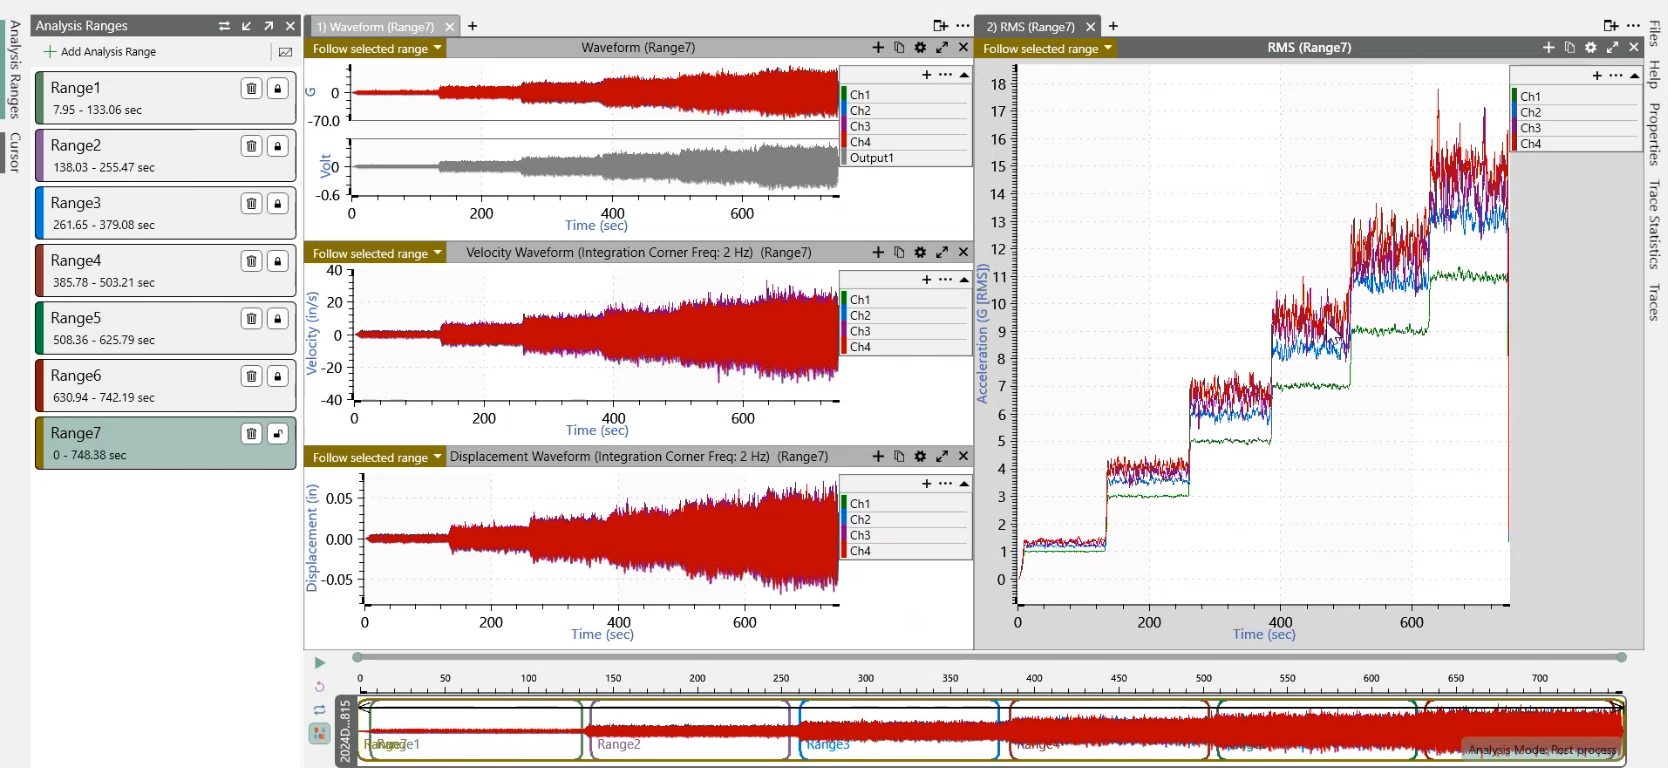
Compare fatigue of a coast-up, run-down, or stepped vibration test
In rotating machinery or component testing, engineers often need to pinpoint where the greatest fatigue occurs. By segmenting the data at different frequency intervals, they can compare accumulated damage and identify resonances or critical frequencies.
Compare test profiles to determine which best represents the field environment
Engineers may generate multiple test profiles to simulate field conditions. By segmenting field data and comparing it to different test profiles, engineers can determine which profile best reproduces real-world vibration exposure.
Isolate pre- and post-event behavior
In failure analysis or durability testing, it can be useful to isolate time ranges before and after an event, such as a crack formation or a loose bolt, allowing engineers to investigate early indicators or aftereffects.
Evaluate performance under different conditions
Environmental chambers or load conditions may vary during a test. Segmenting data by temperature range or load allows engineers to compare the system’s vibration response under each condition and identify sensitivities.
Validate fixture or sensor changes by comparing equivalent test segments
After changing a system setup, engineers can segment equivalent test ranges and compare the results to confirm the change had no unintended impact on data quality or test behavior.
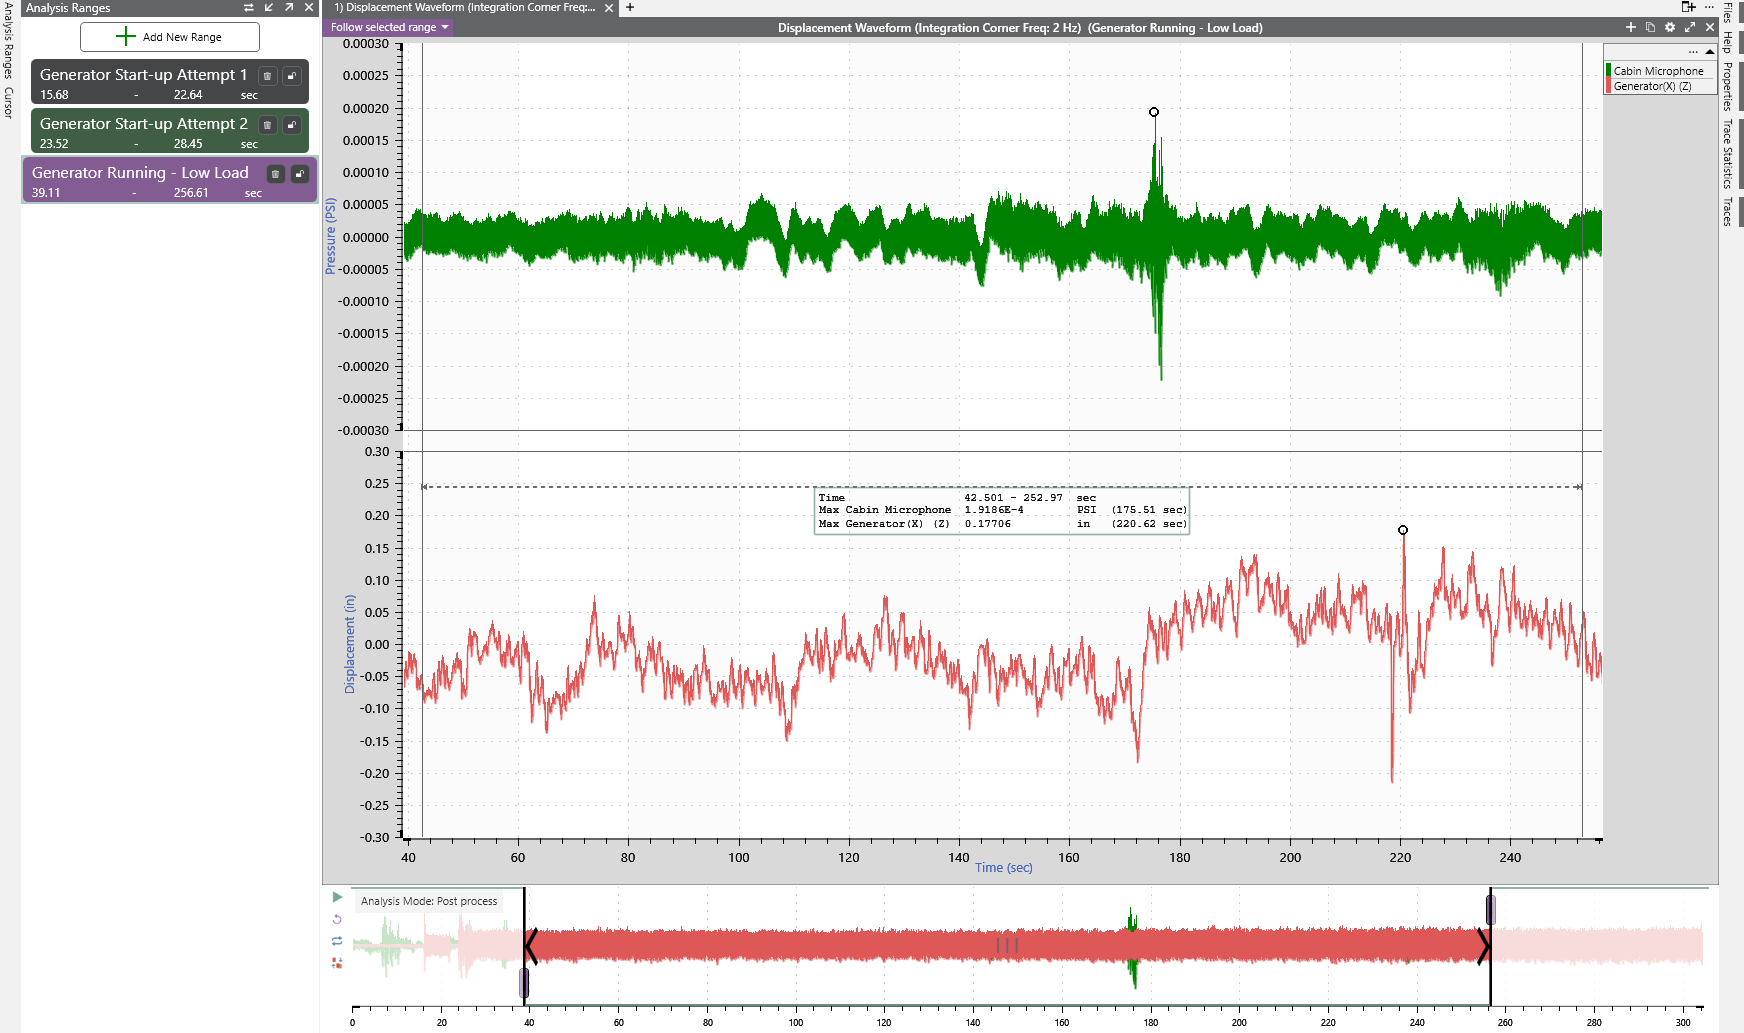
Analyze startup vs. steady-state behavior in rotating equipment
Startup and shutdown levels often exhibit different vibration characteristics than steady-state operation. Creating ranges for each level allows comparison of system dynamics and resonances.
Document specific ranges for customer reports or internal QA
For reporting purposes, engineers may need to highlight specific test sections, such as a vibration dwell or a specific loading sequence. Labeling these ranges helps to ensure consistent reference and simplifies report generation.
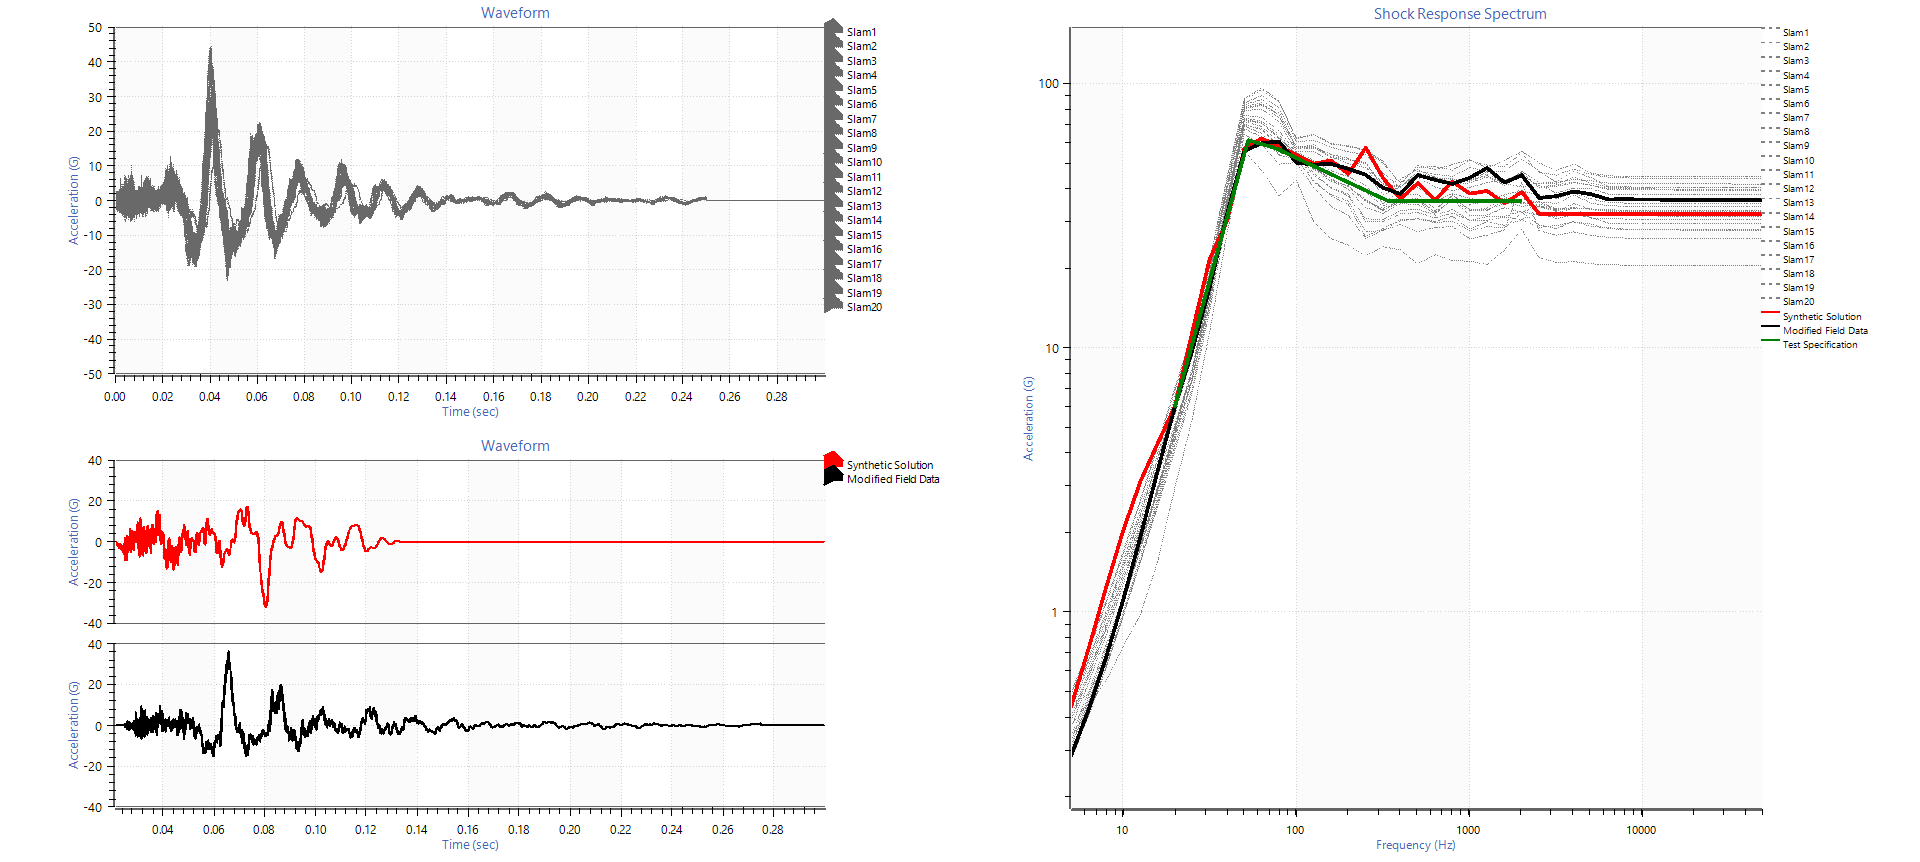
Segment and average similar events
Repeated events, such as drop tests or shock pulses, can be segmented and averaged to assess consistency, identify outliers, or generate a representative profile for test development.
Focus on resonances or dwells during sine or random tests
During sine sweeps or random tests, resonances or dwell frequencies can dominate the response. Engineers can create ranges around these areas to assess response, system behavior, or potential stress points.
Compare original and corrected signals after filtering or signal conditioning
After applying filters or correction algorithms to a signal, it can be useful to retain the original and compare it with the analyzed version. Segmenting both versions enables quick verification of improvements or unintended effects.
Getting Started in ObserVIEW
The demo version of ObserVIEW is free to download. You can find the current version of software on the Software Updates page.