Vibration Research’s industry-leading reporting capabilities are always a step ahead. The VibrationVIEW software provides default report templates or laboratories can customize their documents to meet test standards or customer requests.
VibrationVIEW’s Report Builder makes generating professional and informative reports as easy as ever. Whether you are new to the software or use it every workday, there are new reporting features you will want to know about to improve your documents or process.
15 Reporting Features to Improve Your Process
1. Convert a Legacy RTF Report Template to a VibrationVIEW Template
VibrationVIEW can automatically convert legacy RTF templates to a VibrationVIEW template without changing the content or formatting.
- Select Report > Edit Template > …More Templates
- Change the file type in the dropdown list to “All Files (*.*).”
- Select the RTF template file
The software will convert the template to a .vvtemplate file and open it in the report editor. A message at the top will appear:
“Notice: Template was automatically converted to a new file with the latest format. Save file to keep changes.” If you select the View Original button, the software will open the original RTF file in Microsoft Word.
Save the report template as a .vvtemplate file.
2. Preview Report in the VV Builder

Underlying code.
Corresponding results.
The Show Codes/Show Results button toggles the main view between the report preview and the underlying code. Engineers can change the code and then switch to the results to view the changes as they will appear on the report. This option streamlines the report generation process, eliminating the need to generate, review, and edit reports in different viewer instances.
3. Add, Resize, and Scale Graphs
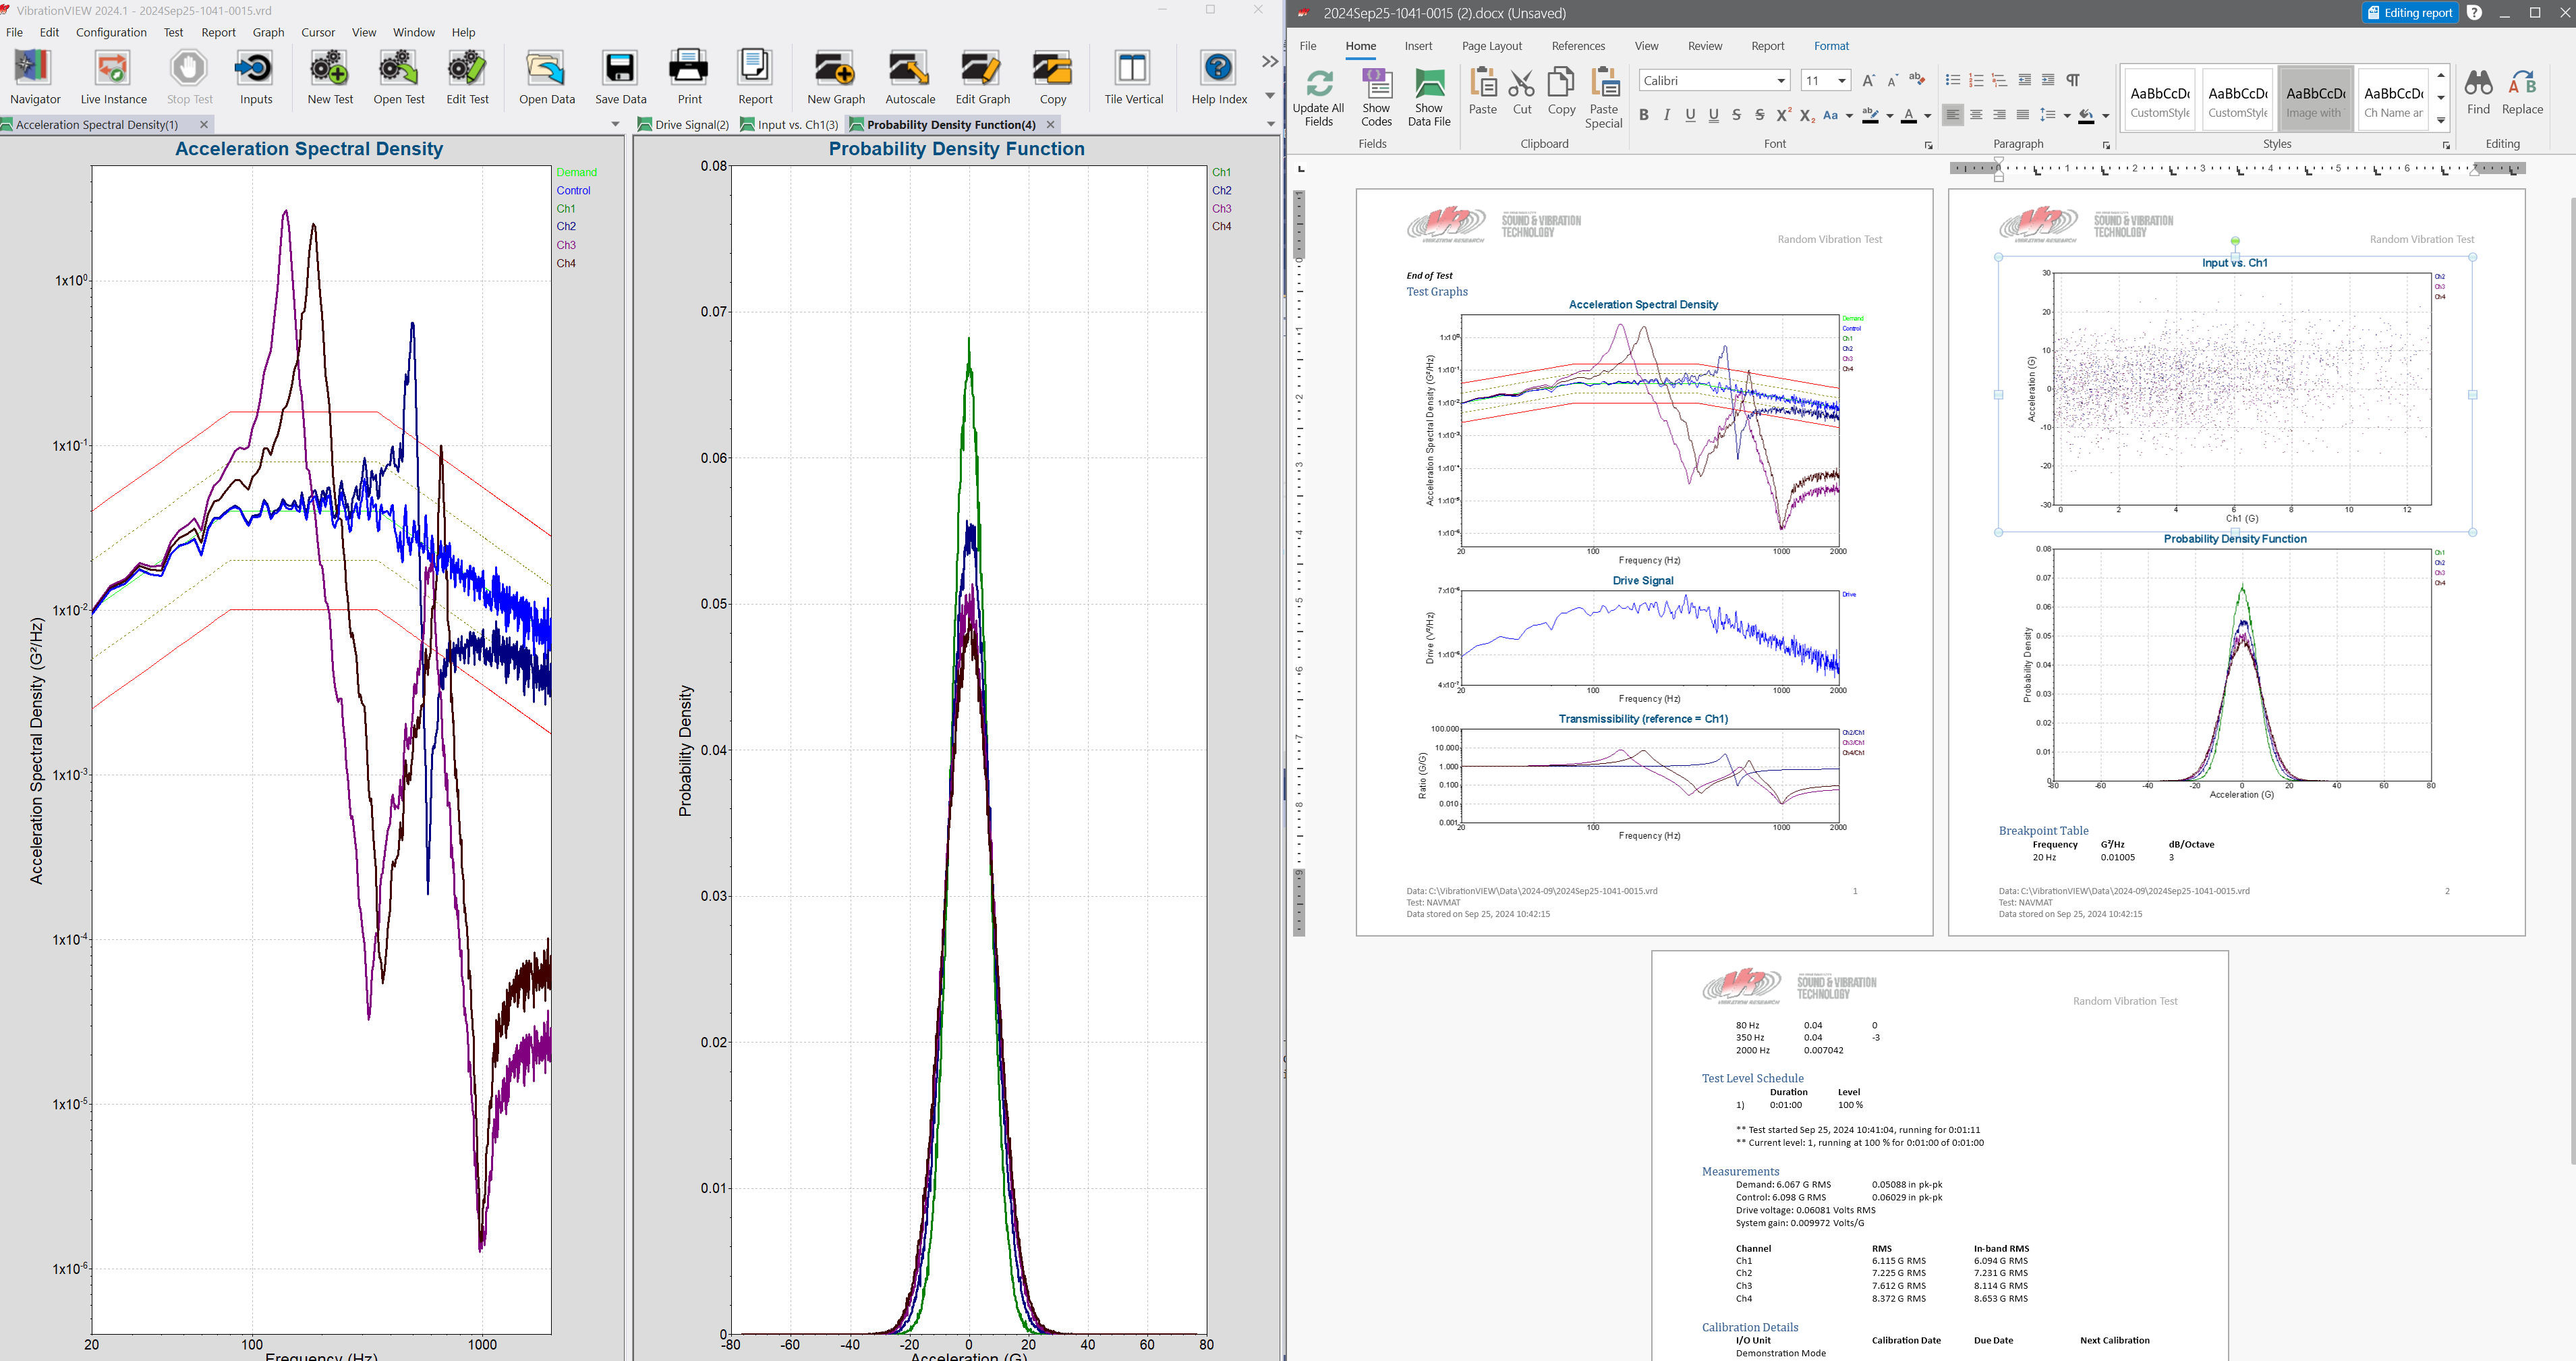
Test results in VibrationVIEW (left) and the test report (right)
Reports can include any of the VibrationVIEW graphs for the test type. Engineers can add a graph variable to the report template or add graphs after they generate the report. Click and drag or Copy > Paste any graph into a report in the VibrationVIEW Report Builder.
The graph format options allow engineers to size and position their graphs. A scaling factor adjusts the text for legibility, no matter the graph size.
4. Save Report as a Template
If an engineer makes changes to a report that they wish to use in the future, they can save the document as a template (rather than opening the template in a separate instance to make the changes). To save a report as a template:
- Navigate to the File tab
- Select the Save As Template button
5. Save Report as a PDF
To save a report as a PDF:
- Navigate to the File tab
- Select the Export button; the Save As prompt will appear
- Save the report as a .pdf file
6. Add Multiple Report Parameters to a Report
VibrationVIEW generates a report using mail merge-type processing and provides a list of supported report parameters. In the Report Builder, navigate to the Report tab and select the Report Parameters button to view all supported parameters. The search bar at the bottom of the sidebar can assist with navigation.
Click and drag or Copy > Paste a parameter into a report in the VibrationVIEW Report Builder. Press and hold the Shift key to select multiple parameters simultaneously.
7. Add a Company Logo to the Header
A company logo makes a document look professional and increases brand recognition. To add a logo to a document header:
- Navigate to the Insert tab
- Select the Header button; the software will direct you to the Design tab
- Navigate to the Insert tab
- Select the Picture button; the Open dialog will appear
- Select the company logo
Double-click anywhere in the document to exit the header design or select the Close Header and Footer button.
8. Add a Table of Contents
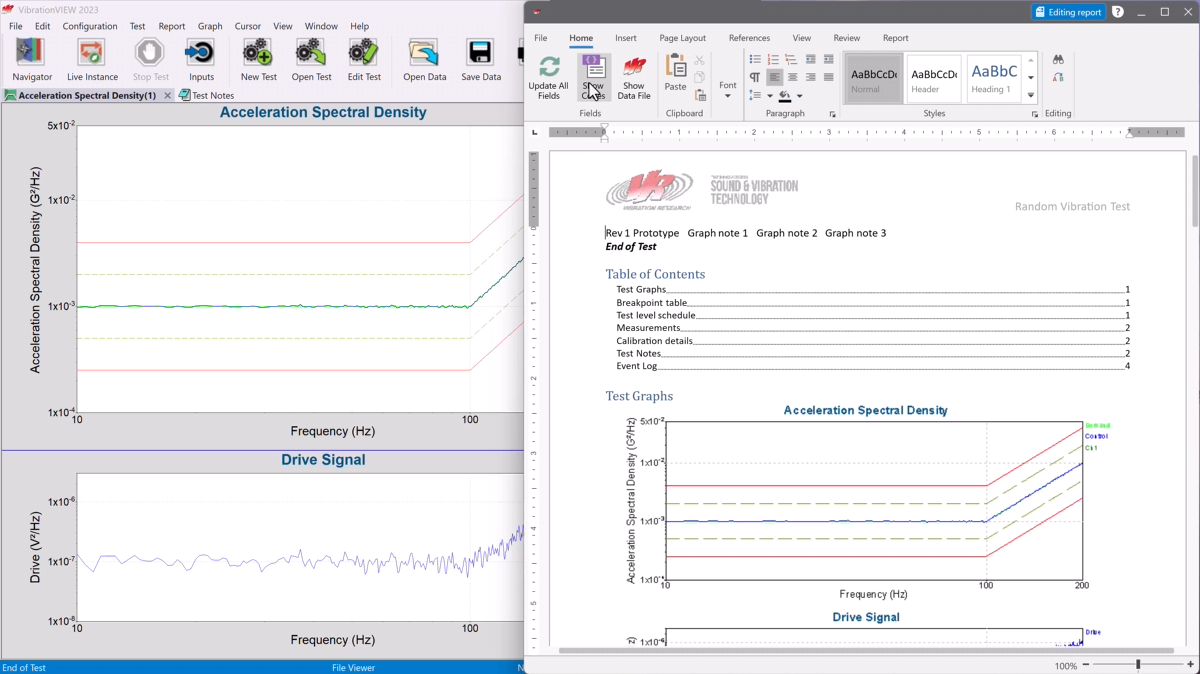
Test report Table of Contents preview
A table of contents (TOC) that anchors to its contents is useful for multi-page documents. To add a TOC to a VibrationVIEW report template:
- Navigate to the References tab
- Select the Table of Contents button
{TOC h} is the default code for a TOC. The h instructs the program to anchor the contents to the document’s headings.
- Select the Add Text button and select a level to add contents to the TOC
The levels relate to heading styles. For example, Level 1 adds H1 style text.
- Select the Update Table button to refresh the TOC after changes
9. Password Protect a Template
Document protection on VibrationVIEW templates prevents unauthorized users from making erroneous changes. Customers or quality standards may require/recommend this additional layer of security. To add document protection to a VibrationVIEW report template:
- Navigate to the Review tab
- Select the Protect Document button
- Select an editing restriction from the drop-down list
- Enter a password and reenter the password to confirm
- Select OK
To edit a password-protected document, navigate to the Review tab, select the Unprotect Document button, and enter the password.
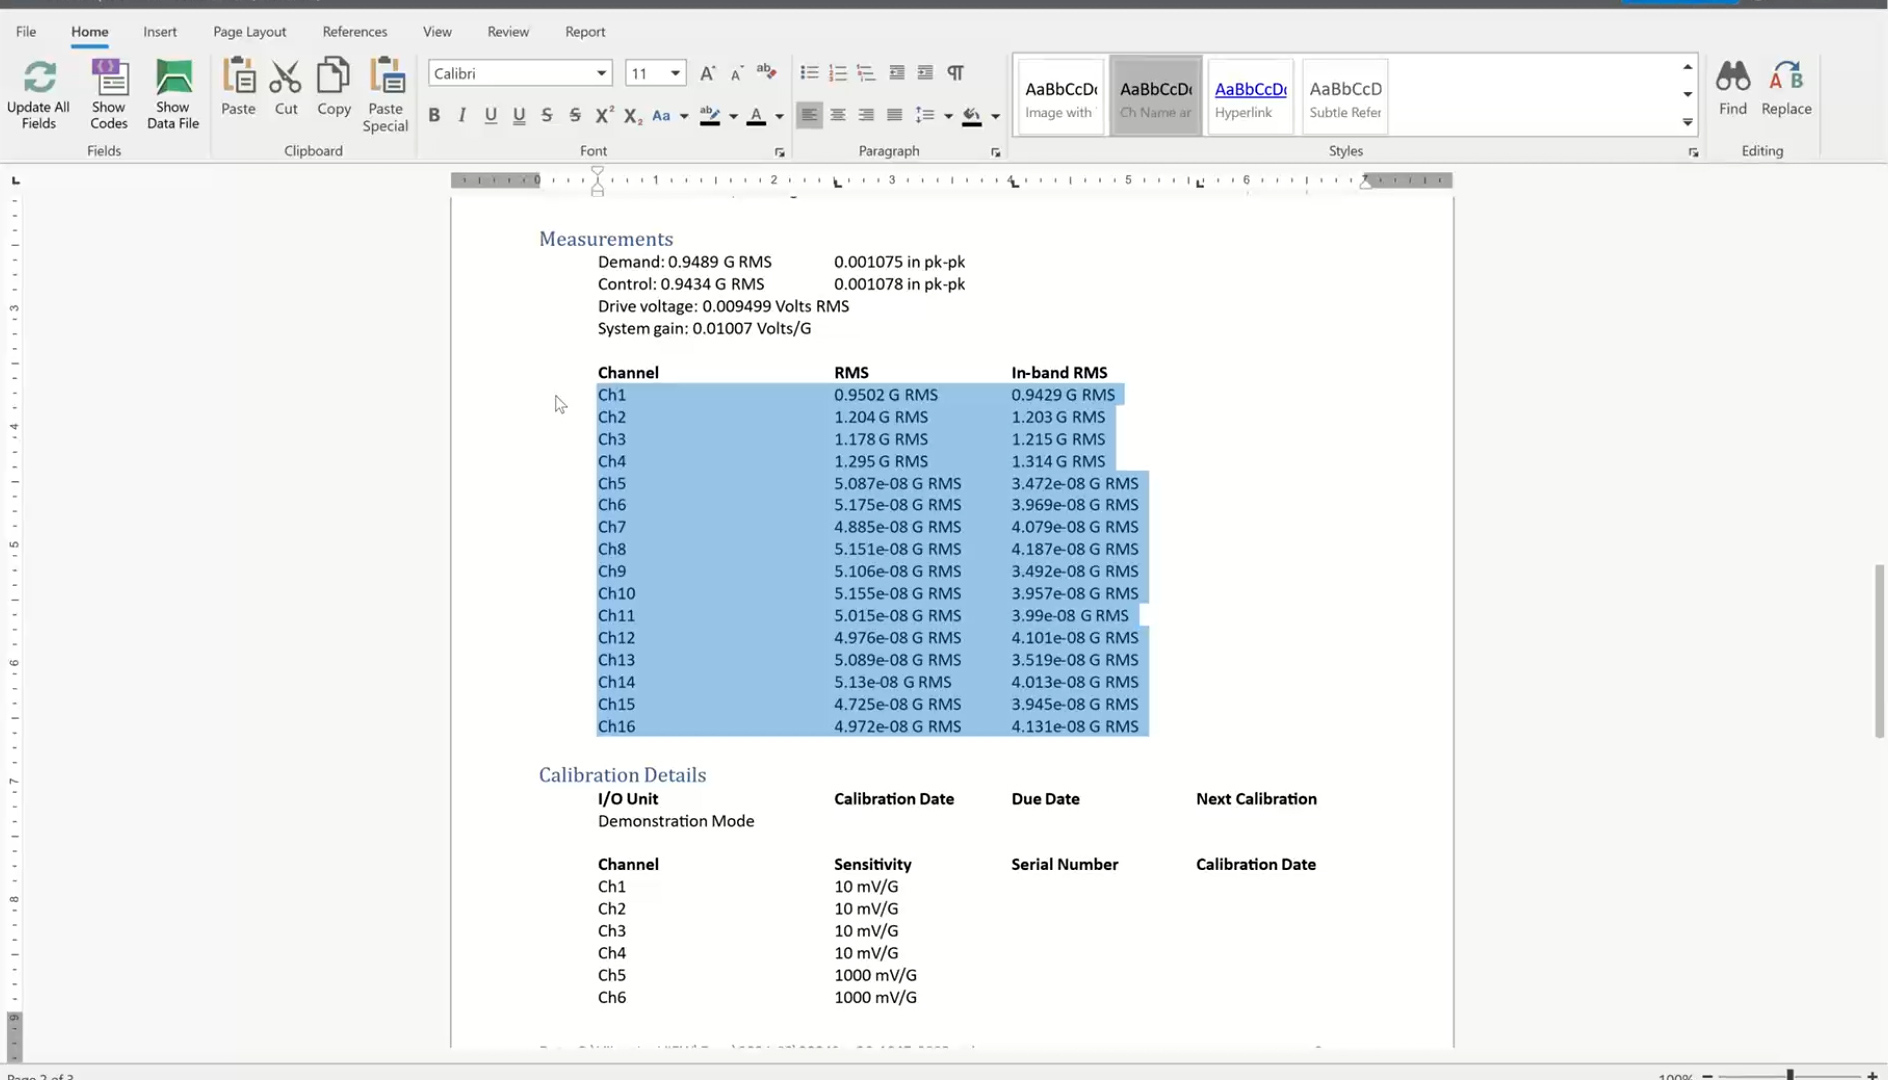
10. Output Multiple Parameters with One Variable
The multiline, multicolumn parameter format saves data entry time, particularly when running high-channel-count tests. It outputs the same parameter for multiple channels, each on a new line. Engineers also have the option to output columns of data side-by-side using the same variable string.
- Add the shortcut * after the variable to generate a row for each active channel
- Add the shortcut| to indicate a column break
For example, {DOCVARIABLE ChName*|Ch*|ibrms*} creates a three-column layout of the channel name, RMS, and in-band RMS for all active channels.
| Channel | RMS | In-band RMS |
| Ch1 | 0.2998 G RMS | 0.3008 G RMS |
| Ch2 | 0.0004711 G RMS | 0.0002212 G RMS |
| Ch3 | 0.0004722 G RMS | 0.0002242 G RMS |
| Ch4 | 0.0004621 G RMS | 0.0002176 G RMS |
Etc.
11. Add Test Notes
Engineers can use Test Notes to log comments throughout the test and easily transfer them to the final report.
- Select View > Test Notes
- Insert {DOCVARIABLE [TESTNOTES]} into the report template to include the test notes in your report
TIP: To add a timestamp to a test note, click in the test notes section and select Ctrl + t.
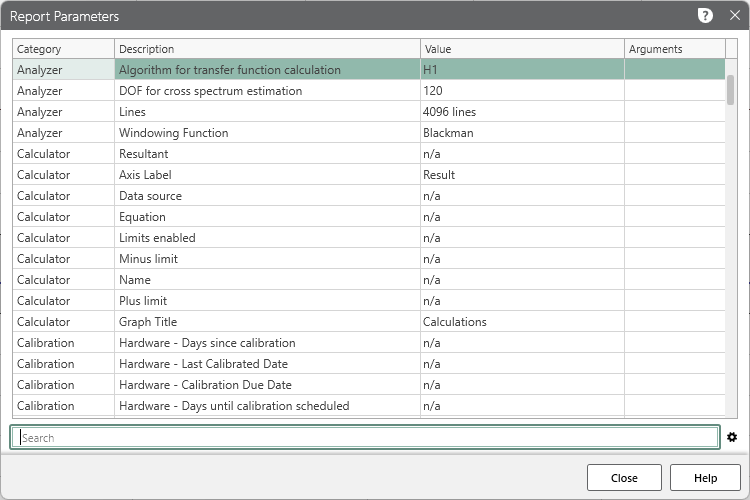
12. Pull Equipment Calibration Information
Rather than manually entering equipment calibration information, engineers can add a parameter to their test report template to pull the information from the hardware, accelerometers, or conditioner.
To view the parameters related to calibration:
- Navigate to the Report tab
- Select the Report Parameters button
- Navigate to the Calibration category or use the search bar at the bottom of the sidebar
13. Add a Prompt Before Running the Test
The “prompt for run name” option requires the test technician to enter a run name and up to three notes before the test starts, such as customer or technician. Reports can include these entries.
- Select the New Test or Edit Test button
- Navigate to the Data tab
- Select the “Prompt for Run Name and Annotation Lines when starting the test” checkbox; the graph annotations lines at the bottom of the dialog will become available
- Customize the prompts that will appear at the start of the test
- Select OK
- Add {DOCVARIABLE RunName} {DOCVARIABLE Note1} {DOCVARIABLE Note2} {DOCVARIABLE Note3} to the report template
14. Carry Over Graph Annotations
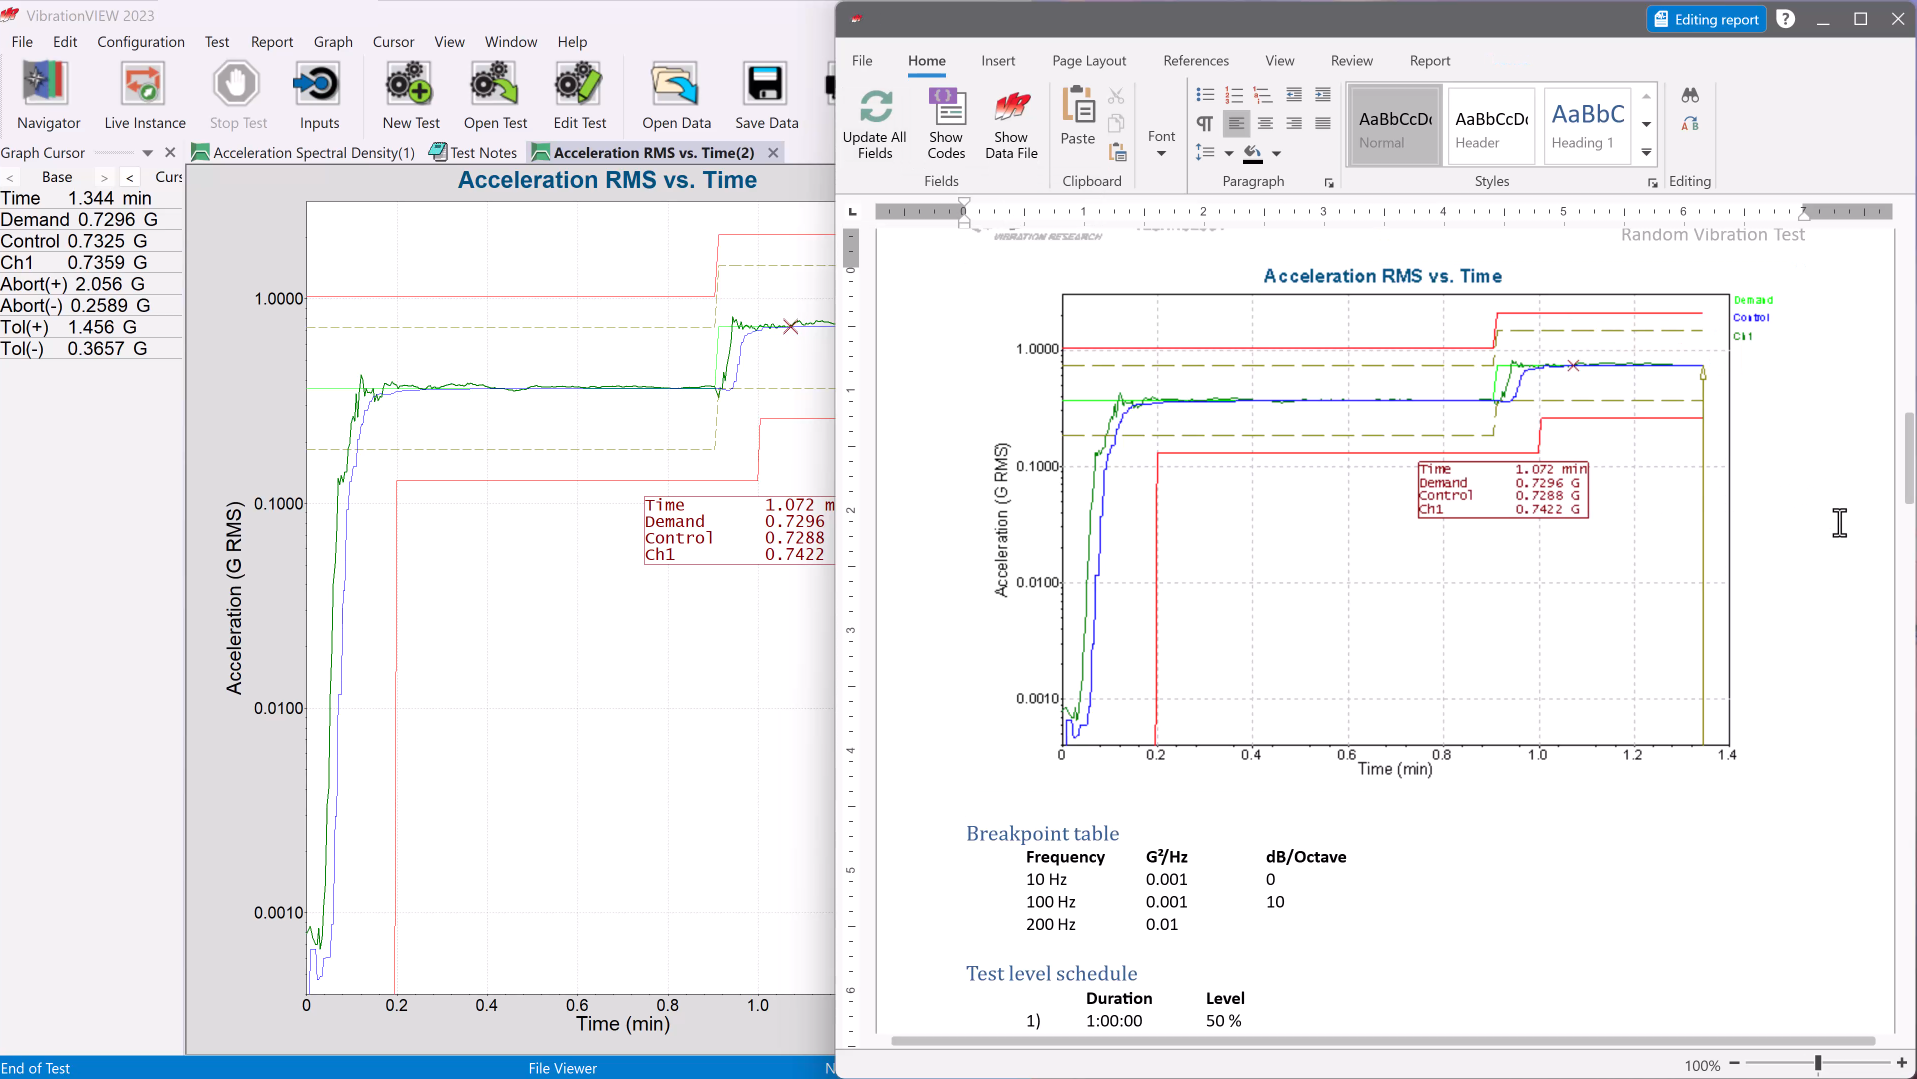
Carry over acceleration RMS graph annotation
Engineers can add graph annotations to specify values like a peak frequency. Annotations include the trace values at the cursor position. Graph annotations carry over to report graphs, and they can be added to a report open in the VibrationVIEW word processor. To add a graph annotation:
- Navigate the cursor to the desired location on the graph
- Press the Insert key
To add a graph annotation to a report that is open in the word processor or adjust the position of the annotation on the report:
- Add the annotation to the graph or adjust its position in the software
- Select the Update All Fields button in the word processor
15. Add a Watermark
A watermark protects a report from being reproduced. To add a watermark to a report:
- Navigate to the Page Layout tab
- Select the Watermark button
- Define the watermark style
- Select OK