At first glance, sine resonance track and dwell (SRTD) testing appears straightforward. The engineer first runs a sine sweep to find resonant frequencies. Then, they instruct the system to dwell on a frequency for a pre-determined time or until the device under test (DUT) fails.
However, the real world is not that simple. Measurement of resonance is never fully accurate. In particular, a DUT’s resonances shift as its material fatigues. For the SRTD test to be valid, the dwell frequency also needs to shift. Therefore, the engineer needs insight into these shifts. Ideally, they should be able to identify multiple resonances, select a resonant frequency for a sine dwell, and run the SRTD test confident that the frequency will stay on the resonance.
This paper begins by examining 1) the nature of shifts in resonant frequencies and 2) the phase relationship between the control channel and the response channel at those frequencies. The discussion will then describe the two primary methods of SRTD tracking: phase tracking and peak tracking.
With this background information, this paper will present the results of two sets of tests. Each test set compares the SRTD test results of phase tracking versus peak tracking. The paper will then make conclusions based on the test result comparisons.
SRTD Testing
An SRTD test begins with a sine sweep across a broad frequency range. The engineer analyzes the transmissibility between the control and response data. The peaks in transmissibility identify resonance frequencies, and a product experiences the most fatigue when exposed to its natural resonance.
After identifying resonances, the engineer can then initiate the sine dwell. The system controls the shaker frequency on a selected resonance until the product fails. A pre-established threshold of time or number of cycles to product failure determines whether or not the test is successful.
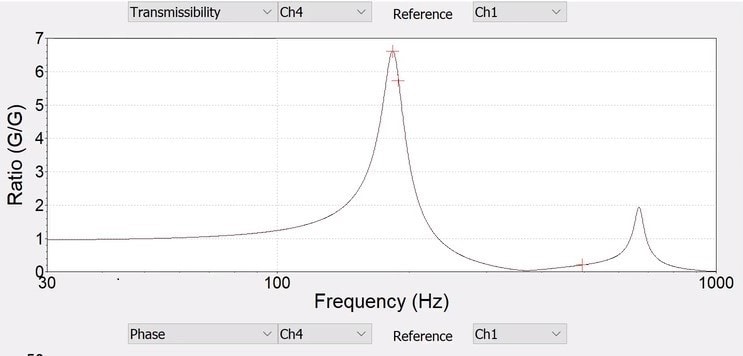
Figure 1. Peak transmissibility identifies the resonant frequency.
Resonance Phase and Frequency
When test engineers originally began performing these sine dwell tests, they controlled the frequency of the resonance with little concern for the phase difference between the control channel and the response channel at the resonance frequency. There seemed to be good reasoning for this oversight. Resonance occurs when a material’s vibrations are reinforced by the “reflected” waves in the material (constructive interference), so it can be assumed that the ideal phase difference is 90°. Consider a cantilevered beam vibrating in its fundamental mode, in which the end of the beam is at its peak amplitude while the shaker head is at its equilibrium position (Figures 2 and 3). Based on this reasoning, engineers would often set the default phase difference setting for a resonance to 90° out of phase.
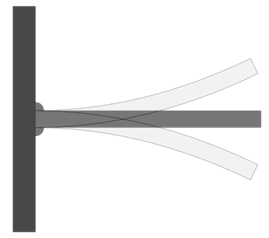
Figure 2. Resonating cantilever beam – profile.
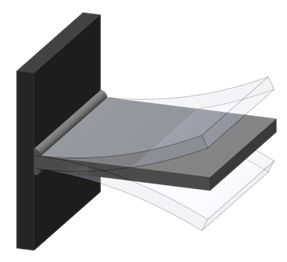
Figure 3. Resonating cantilever beam – 3D.
However, the real phase difference may differ from the theoretical 90° phase difference. Firstly, the initial phase measurements may be affected by the location of the accelerometer or due to a lag in the instrumentation reading. Secondly, the phase difference may shift due to changes in test amplitude or non-linear responses to fatigue.
In addition to a shift in phase, resonant frequencies shift, typically downward, as the material fatigues. To maintain a valid test, the dwell frequency needs to shift with the resonance. When performing SRTD test methods, engineers must be aware of the potential change in both the resonance frequency and resonance phase.
SRTD Tracking Methods
Phase Tracking
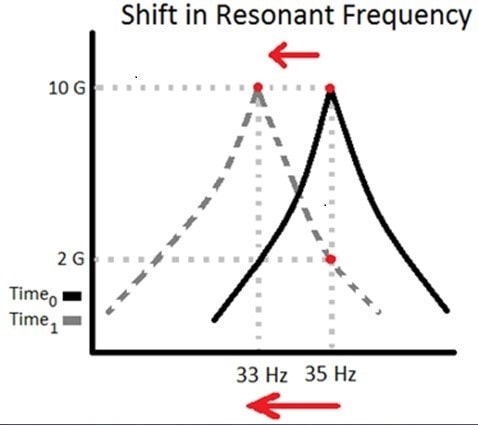
Figure 4. Resonance shifts as material fatigues.
The most common method of adjusting an SRTD test for shifting resonant frequencies is phase tracking, implemented by the vibration test controller software. At the end of the sine sweep, the controller measures the phase difference between the control channel and the response channel at the resonant frequency. As previously mentioned, the theoretical resonant peak is 90° out of phase. In the real world, the phase difference will usually be close to, but not exactly, 90° because of material imperfections, the mounting locations of accelerometers, and non-linear shaker motion.
Phase tracking generates an output at the selected amplitude and frequency after the initial sine sweep, which is presumably the frequency at which peak resonance occurs on the response channel. The controller holds the test at that frequency until the resonant frequency of the response begins to shift due to material fatigue. It then shifts the frequency of the drive output to maintain the defined phase difference between the control and response sensors.
Phase tracking for track and dwell tests offers an advantage over tests that do not adjust for resonance shifts. However, there are three limitations to the phase tracking methodology.
- Phase relationships measured during an initial sweep are imprecise.
- If the product has a non-linear amplitude response, a change in amplitude between the detection portion of the test and the dwell portion of the test may result in a different resonant frequency and phase relationship.
- Fatigue may behave in a non-linear fashion, causing the phase difference at peak transmissibility to change as fatigue effects progress.
Peak Tracking
Peak tracking is a second option for adjusting to resonance shifts during the dwell portion of an SRTD test. This option allows the controller to adjust the output frequency and the phase difference between the two channels to maintain peak transmissibility. The phase adjustment works by constantly oscillating the phase difference between the control and the response channels and observing if the transmissibility increases or decreases. The algorithm controlling the oscillations learns the shape of the transmissibility graph and searches for the peak. As the algorithm learns more, the amount of phase change continues to decrease.
Peak tracking minimizes the need for precise detection during the sine sweep so that users can sweep faster. More importantly, it ensures that peak transmissibility is maintained throughout the dwell portion of the test, even when phase relationships shift along with the resonant frequency.
Experimental Comparison of SRTD Tracking
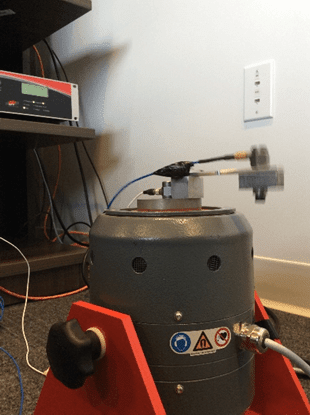
Figure 6. Cantilevered aluminum beam on a shaker.
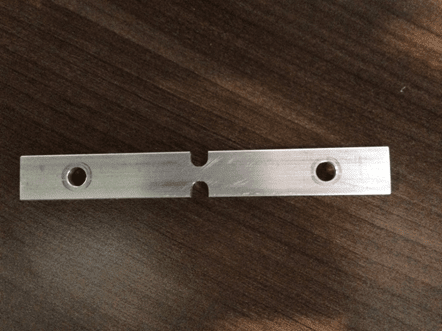
Figure 5. Notched aluminum beam.
The following experimental results show the difference between the effect of peak tracking vs. phase tracking on product failure times. For this paper, 40 SRTD tests were conducted on notched aluminum beams (4″ x 0.5″ x 0.125″) (Figure 5): 20 using peak tracking and 20 using phase tracking. One end of the aluminum beam was attached to a shaker head, and a mass hung from the cantilevered end of the beam (Figure 6). A sine sweep of 1G across a frequency band of 60Hz to 120Hz was performed.
Results
The aluminum beam test results are separated into two groups because slightly different procedures were conducted.
I. Sweep rate and direction: 3 Oct/min; sweep down
Fourteen aluminum beams were tested: 7 with phase tracking and 7 with peak tracking. The rate of 3 Oct/min generally produces an accurate original sweep. The average time to failure was 20.91 min for peak tracking and 23.88 min for phase tracking, an increase of 14.20%.
| Peak tracking failure time (min) | Phase tracking failure time (min) |
| 26.56 | 24.97 |
| 18.05 | 30.41 |
| 23.25 | 25.25 |
| 19.76 | 19.29 |
| 15.73 | 17.15 |
| 24.44 | 26.76 |
| 18.58 | 23.32 |
Table 1. Comparison of failure time for a 3 Oct/min sweep down.
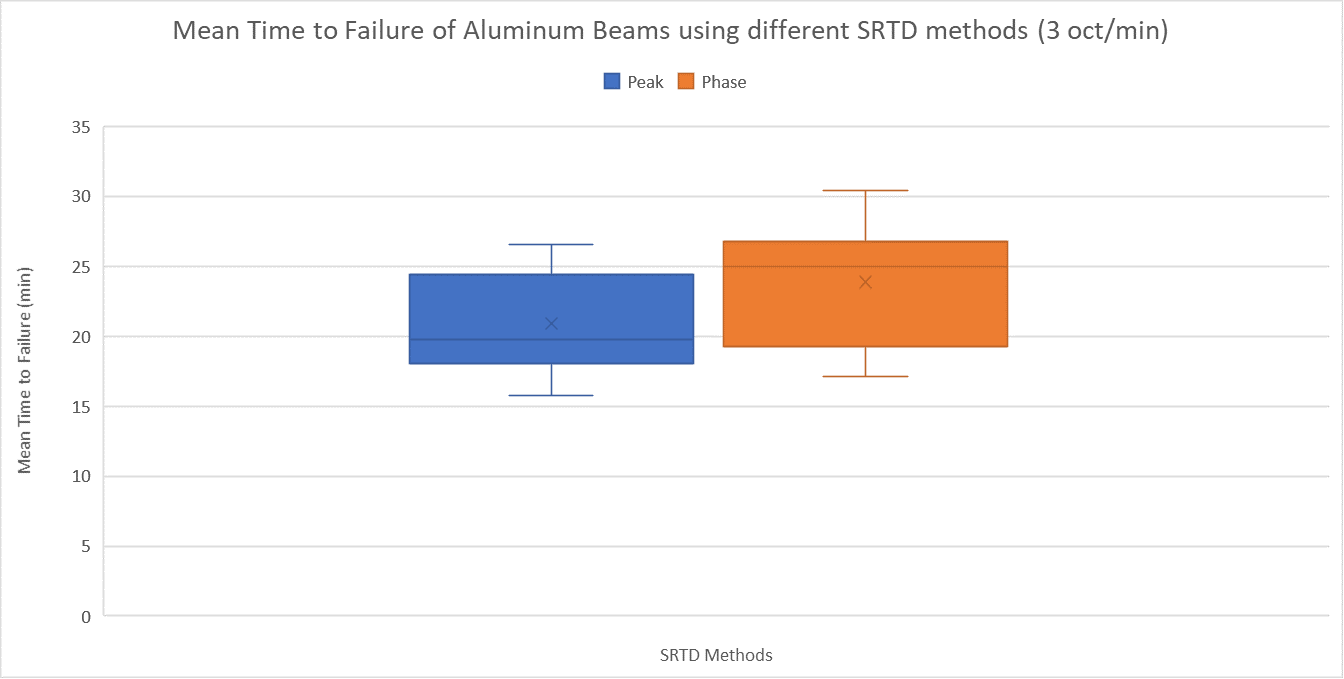
Graph 1. Mean time to failure for a 3 Oct/min sweep down.
II. Cable Whip Reduced: 6 Oct/min; Sweep Up; Minimal cable whip
Twenty-six aluminum beams were tested: 13 with phase tracking and 13 with peak tracking. Most likely, this experiment’s sweep rate of 6 Oct/min and the sweep-up methodology did not produce as accurate of a resonance frequency and phase value as a slower sweep rate could have been determined.
The average time to failure was 33.15 min for peak tracking and 37.50 min for phase tracking, an increase of 13.12%.
| Peak tracking failure time (min) | Phase tracking failure time (min) |
| 20.65 | 27.69 |
| 34.17 | 34.84 |
| 20.21 | 31.53 |
| 18.28 | 19.68 |
| 17.32 | 28.51 |
| 17.59 | 27.80 |
| 26.17 | 30.07 |
| 43.51 | 50.03 |
| 52.16 | 51.03 |
| 45.30 | 63.90 |
| 48.28 | 38.68 |
| 40.93 | 46.79 |
| 46.41 | 36.98 |
Table 2. Comparison of failure time for a 6 Oct/min sweep up.
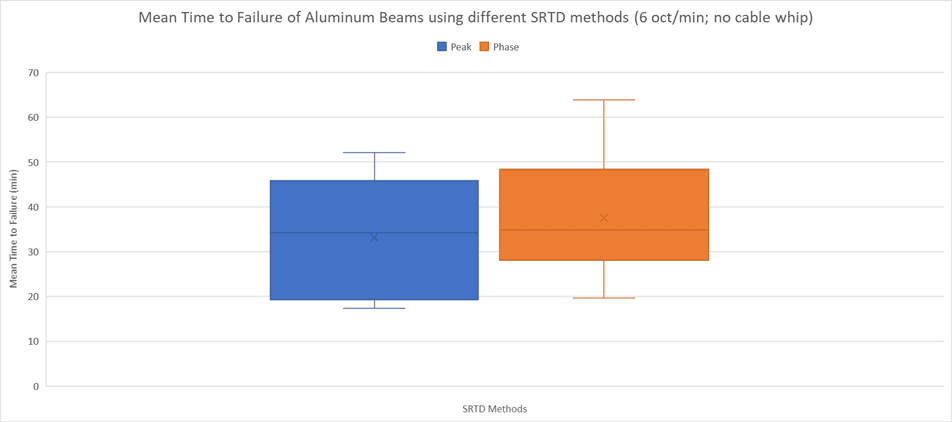
Graph 2. Mean time to failure for a 6 Oct/min sweep up.
Conclusion
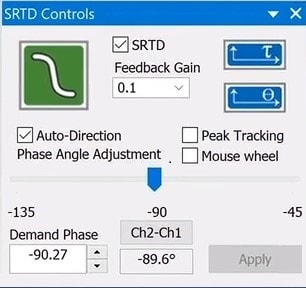
Figure 7. VibrationVIEW SRTD offers phase tracking and peak tracking.
The test results from this simple experiment demonstrate that peak tracking during SRTD testing causes a product to fail faster than phase tracking. In conclusion, test engineers should use peak tracking SRTD when attempting to maintain a sine dwell on a resonance.
To obtain the most precise location of a product’s resonance, an engineer must be able to adjust for the resonance’s shifting frequencies and shifting phases due to the changing characteristics of the product as it fails. Peak tracking SRTD provides the engineer with the tools to accomplish this task. Other SRTD tracking methods only allow one variable to shift; consequently, the engineer may not be testing at the peak resonance.
The VibrationVIEW software supports peak tracking. When selected, both the phase and the frequency are constantly shifted to “hunt” for the peak (highest) resonance value. When a product is tested under these conditions, it will be exposed to the largest resonance amplitudes possible, fatiguing the product in the fastest way possible.
With VibrationVIEW’s peak tracking control, engineers can conduct precise testing that maximizes the transmissibility value of the resonances while maintaining high-quality control.