Introduction
It is important to periodically assess the shaker in your lab for proper performance. Poor shaker performance—potentially caused by a crack in the armature or flexure fatigue—will negatively affect the shaker’s test results. A routine shaker validation test ensures that the laboratory shaker is performing according to standard.
There are several methods of confirming proper shaker performance. In the following paper, we describe a sine test methodology that we recommend. Many shaker manufacturers rate their shakers according to a sinusoidal vibration peak force test (Figure 1). In addition, a sinusoidal test sweeps through a range of frequencies using tracking filters and identifies the vibrations across the frequency range of the shaker’s capabilities.
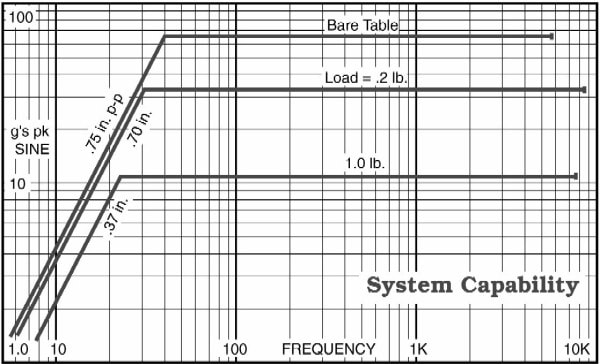
Figure 1: Sinusoidal vibration peak vibration data for the VR5200 shaker.
Every laboratory test facility will need to tweak the following recommended methodology according to their needs and circumstances, including the frequency range, G level, and frequency of validation testing.
Simulated Procedure
To illustrate our recommended methodology for shaker validation tests, we simulated a test on our Unholtz Dickie shaker in the Vibration Research lab. We kept the expander head mounted to the shaker so that we could more easily simulate a damaged or faulty shaker scenario. Three accelerometers were mounted on the head expander of our shaker. One accelerometer was mounted towards the center of the head expander, while the others were mounted towards the corner (we mounted two accelerometers in the corner to ensure that the data from the corner was consistent). In some tests, a loose wrench was laid on the head expander to simulate loose bolts or some other shaker anomaly (Figure 2).
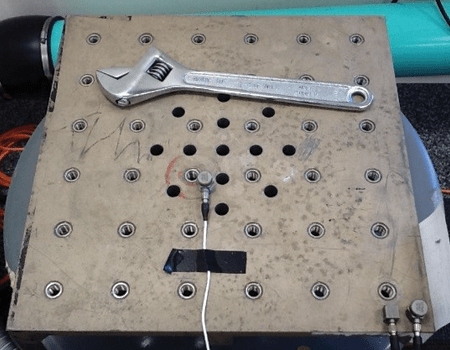
Figure 2: Head Expander with accelerometers mounted at the center and the corner. An unmounted (loose) wrench was placed on the head expander for some tests to simulate shaker anomalies.
1G Sine Sweep
Our recommended method of validating that a shaker system is working consistently and properly is to conduct a sine sweep. In this case, we ran a sine sweep test (1 G) across the frequency range of 20 Hz to 1500 Hz. This sine sweep test was conducted for two scenarios. First, we ran the sine sweep on the shaker/head expander with all the bolts firmly tightened. In the second case, we repeated the sine sweep with an unmounted wrench on the head expander (Figure 2) to simulate a scenario with shaker damage. The total harmonic distortion (THD) for the two tests (tight vs. loose) from the center accelerometer was compared (Figure 3).
Total Harmonic Distortion
THD compares the accelerations at a specific frequency to the accelerations of the next ten harmonics of that frequency. In the ideal world, a pure sine tone is perfectly smooth and has no distortion. However, there are a number of things that can affect the quality of the sine tone so that it has some distortion to it. That distortion is due to harmonic content that may be in the signal.
For example, if you have a 60 Hz sine tone, the harmonics of 60 Hz would be whole number multiples of the fundamental (60 Hz), such as 120 Hz (60 X 2), 180 Hz (60 X 3), 240 Hz (60 X 4), etc. If you have energy in these harmonics then that will be reflected in a distorted sine wave signal. The Total Harmonic Distortion is a measure of how much harmonic content there is in a signal. A large THD value would indicate that there is significant harmonic content in the sine signal. The physical reality of a high THD is that there is some weakness or malfunction of your shaker system.
Therefore, THD is a valuable tool to measure how accurately a vibration system is reproducing the output signal from a controller and can help track system changes over time. A small THD value indicates that the system is performing as the controller is calling it to perform, whereas a large THD value is indicative of a problem with the system. When we compare the THD (green) of the head expander with all bolts firmly tightened to the THD (red) of the same setup but with a loose wrench lying on the head expander, it is very clear that the loose wrench scenario produces a much different response than the scenario without the wrench (Figure 3).
Results from Simulated Procedure
Although the data collected in the sine sweep test could be analyzed in many different ways, we recommend using the THD plot to evaluate the shaker performance. We do this, in part, due to the clear visual clues that are provided in the THD plot – clearing demonstrating if something is awry with the shaker system.
By running a sine sweep and analyzing the data from the perspective of the THD, a test engineer can evaluate the shaker’s performance. When the shaker first arrives at the laboratory testing facility, the THD of the shaker can be established. That value should be low – certainly less than 10%, across the frequency spectrum. In the case of our laboratory’s Unholtz Dickie shaker, the THD is less than 1% across the frequency spectrum (Figure 3). When a laboratory testing facility establishes the baseline THD for a shaker, then each monthly or quarterly shaker validation test should produce a similar THD response.
If something is wrong with the shaker, the THD response will vary from the baseline value. In our simulated shaker validation test, the loose wrench vibrated so much on the head expander that the THD deviated greatly from the baseline THD and greatly exceeded the 10% value for much of the frequency spectrum (Figure 3). The loose wrench scenario is obviously an extreme situation, but it illustrates well the value of comparing THD values.
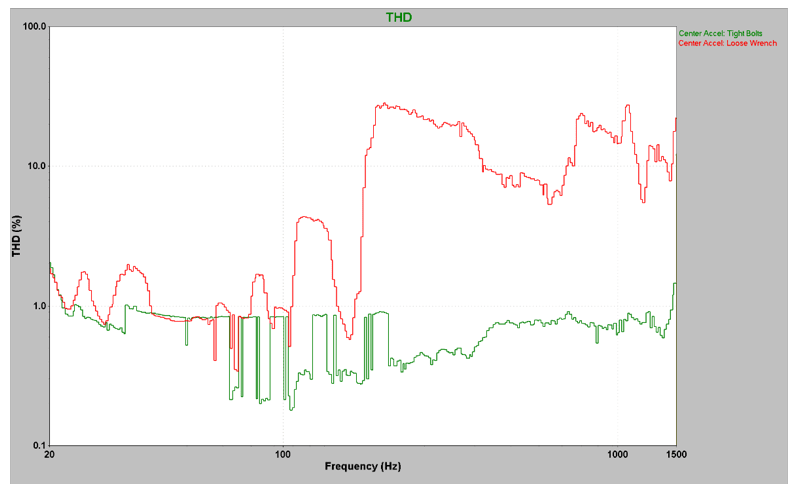
Figure 3: Total Harmonic Distortion (%THD vs Frequency). Our healthy shaker has a %THD less than 1 across the spectrum. Across the spectrum, the %THD is significantly different when the wrench rattled on the shaker.
Conclusions
Test engineers would do well to regularly check the validity and reliability of their shaker system. A simple way to perform a shaker validation test is to run a sine sweep across the frequency spectrum of the shaker and evaluate the THD of the system. Once a baseline THD is established, future THD responses can be compared to the original baseline value.
This method certainly has its advantages. First, it accurately covers an entire range of frequencies, not just an isolated, single frequency as done in system check. Secondly, shaker performance standards are produced using sine sweeps, so evaluating shaker performance in the lab should be accomplished with the same kind of test. Finally, a sine test evaluated with the Total Harmonic Distortion plot is a very easy and simple way to determine if the system is operating as it should.