Abstract
Product failures often require expensive repairs or replacements. Over-engineering adds to recurring costs and its success is uncertain if the failure’s cause is not understood. Engineers need in-depth knowledge before attempting a re-design.
This case study focuses on bus seat failures that occasionally occur in the field but are not predicted by current industry standard tests in the lab. The goal was to collect comprehensive field vibration data and then analyze that data to understand the failure’s causes.
The study used accelerometers placed at various points in multiple seating configurations and across multiple field environments. The analysis identified transmissibility issues between axes of motion, as well as higher reliability seat configurations.
Introduction
The subject of the study is bus seats designed and manufactured by American Seating. Founded in 1886 as Grand Rapids School Furniture, American Seating supports the public transportation industry with reliable, high-value solutions. Vibration Research, the innovator in sound and vibration technology, partnered with American Seating to implement the study.
The problem at the heart of the study is metal fatigue cracks that sometimes develop in bus seats. This type of failure has never been generated by the current industry standard vibration test, yet it occurs in a small but statistically significant number of buses. Each failure must be corrected with an expensive, in-the-field seat repair or replacement. Future failures could possibly be avoided by using larger, heavier seat mountings but this type of over-engineering comes with its own set of recurring costs and its success is uncertain if the true cause of failure is not understood.
The industry-standard test method is a sine dwell. The test, originally developed by a third-party test house nearly 20 years ago, is a low-frequency 1Gpk dwell for 10 million cycles. After reviewing the real-world measured vibration it was determined that this single-frequency sine dwell is located between the range of frequencies excited by the wheel speed and engine RPM. It is well known that sine testing is not representative of the real world; in this case, there are obviously contributing factors in the lower frequency and higher frequency ranges that should be accounted for in a ‘lifetime’ test.
To better understand the real-world behavior of the bus seats, engineers first collected large sets of detailed vibration data from the field, using multiple buses on various routes in two different cities under a range of conditions. This broad range of field data was then analyzed via proven techniques to identify failure causes.
Field Data Collection Details
Vibration data was recorded using three triaxial accelerometers. Two were placed on separate mounting plates used to support a pair of seats and the third was on the top edge of the outer seat. Some, but not all, seat configurations are connected to roof-attached support stanchions.
Data Analysis Techniques
Data Acquisition, Downsampling, and Filtering
The National Instruments device used for data acquisition was limited to an 8,192Hz sample rate; the ObserVR1000 recorded at 32,768Hz. However, future tests may be based on this field data and they will be run on a hydraulic shaker, with a maximum testing frequency between 300Hz and 500Hz. The sample rate from both data acquisition devices exceeds the testing requirements, so downsampling and filtering were applied. All the recorded time history files were down-sampled to 4,096Hz. The recordings were then filtered from 1Hz to 1,500Hz for analysis.
Characterizing the Data
Data showed different ranges of vibration affecting the seats; several different graphs were created to build a basic understanding of these vibration ranges. First, using the bus wheel diameter and the bus speed range, it was determined that the major vibration contributor in the 1Hz to 6Hz range is the wheel speed.
Then, engine effects were examined. Both busses have diesel engines, with a peak operation at 1,100RPM and an idle at around 500RPM. These cover the 10Hz to 35Hz range in the measured vibration.
The other major contributor at low frequency is the bus seat configuration and structure. As a bus traveled across an irregular road surface, impact vibrations began to interact and generate high peak responses in the seats in the 6Hz to 180Hz+ range, due to a variety of natural resonances and harmonics of those resonances.
Measured higher frequency content was also generated by impact vibration.
DATA COMPARISONS
Input and Response
Several important comparisons stood out when examining input data vs. response data. First, a comparison between the two wall-mounted input points to determine if the separation between the mounting points caused differences in the recorded vibrations; differences were very small and can be safely ignored.
Then a comparison to determine which input vibration is responsible for exciting the resonant response of the seat. The x-axis, fore-aft motion, of the seat is the largest and is known to cause the failure in question. For this article, the z-axis data will be used to demonstrate the process and results without releasing information proprietary to American Seating. The low-frequency response is the most interesting, as it correlates to a larger amount of displacement and is excited by the natural wheel speed vibration and engine vibration.
Understanding the effect of each contributing axis will allow for a better understanding of future test results when driven by a single axis shaker. This will also provide an interesting comparison during vibration tests; when driving in ONLY a single axis on the shaker, how much are the off-axes resonances excited? It may be possible that future testing in the off-axes is unnecessary if, when running the full level test, the off-axis motion is equal to or greater than that amount from the real-world data.
The Transmissibility graph below relates the G-to-G response between the z-axis of the TopMount accelerometer and all three axes of the GrabRail accelerometer.
Stanchion Configuration vs. Free Configuration
Another interesting comparison is the response vibration of a standard cantilever seat vs. a seat supported with a stanchion. The supporting stanchion provides significant additional support and limits the motion in the z-axis. This is noticeable in the response vibration of the seat itself.
Vibration data for the two-seat configurations show the differences. The graphs below were generated from two recordings taken simultaneously, with the response accelerometers mounted in approximately the same position. The acceleration peaks and acceleration spectral density (energy) are consistently lower for the stanchion-supported seat.
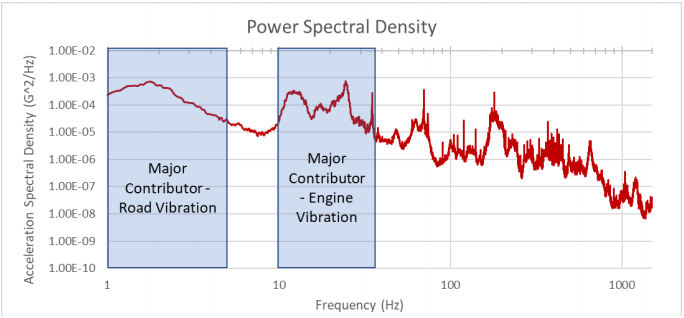
Figure 1. PSD of frequency ranges of known vibration sources.
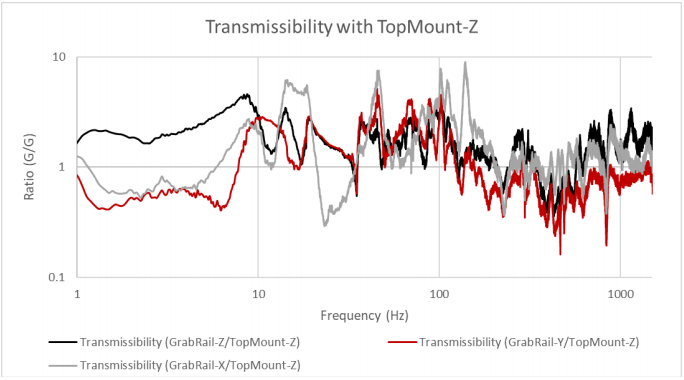
Figure 2. Transmissibility of acceleration to all three bus seat axes.
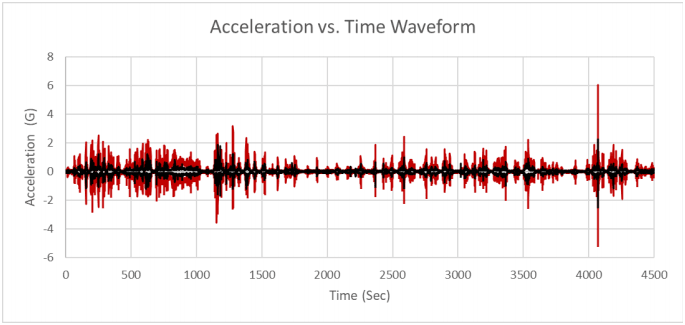
Figure 3. Acceleration for standard seat (red) vs. stanchion-supported seat (black).
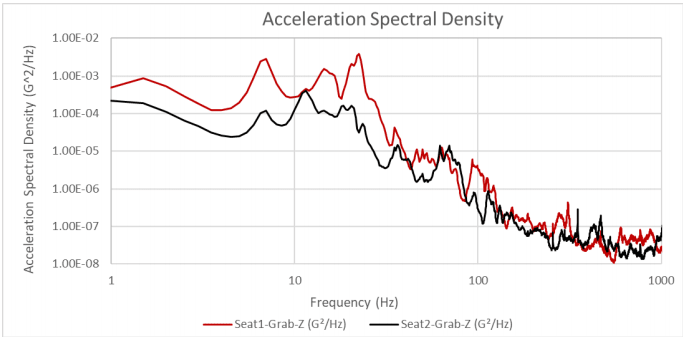
Figure 4. ASD for standard seat (seat 1) vs. stanchion-supported seat (seat 2).
Conclusions
The collected field data and subsequent analysis provided three important insights.
First, the study identified the three primary contributors to vibration energy and their frequency ranges. Obviously, any modifications to seat designs need to ensure that resonances are not located in these ranges or are appropriately damped and controlled.
Second, the analysis revealed the significance of fore and aft motion in seats without stanchion support. This motion, combined with passengers pulling and pushing on the grab-rail, is the suspected source of the observed failure.
Third, the current ‘industry standard’ vibration test is not an effective replication of real-world experience. Most of the vibration energy the seats are exposed to does not occur at the standard test’s primary frequency; however, there is potential for extensive amounts of fatigue to occur across a wide range of other frequencies. The development of a realistic, comprehensive random vibration test is critical to improving product designs.