One of the challenges in vibration testing is mass loading. The resonant frequency of a vibrating device under test (DUT) will change depending on whether an additional mass is added to the DUT. This is particularly evident with a vibrating cantilevered beam and especially so with a curved cantilevered beam, such as a turbine blade. Accurately measuring the resonant frequencies of a turbine blade with an accelerometer is complicated due to mass loading. Even the tiniest of accelerometers adds a mass that affects the resonant frequency of the turbine blade.
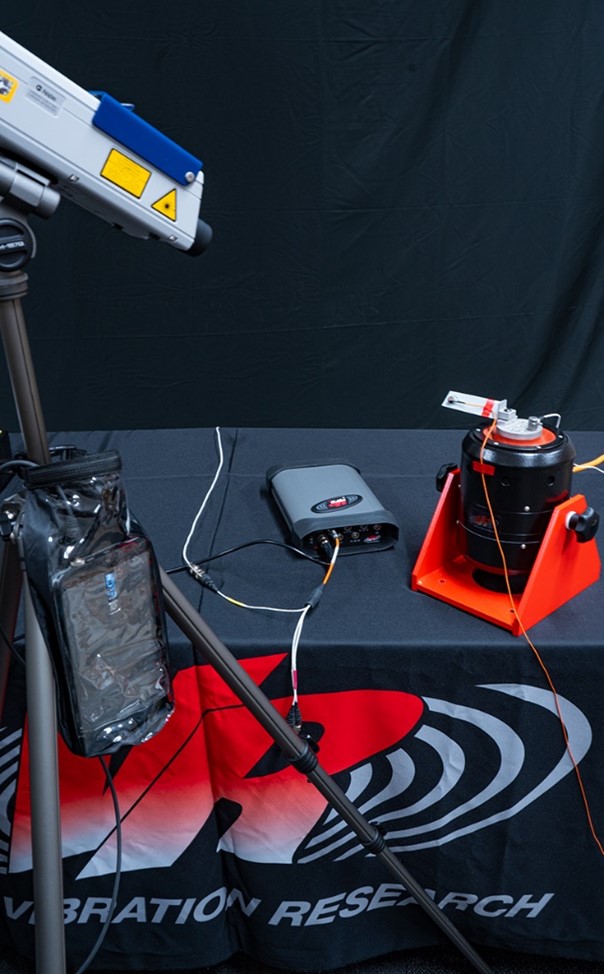
Figure 1. VibroGo® (Laser Vibrometer) measures the accelerations of the turbine blade simultaneously with the accelerometer attached to the tip of the turbine blade.
A solution to the mass loading dilemma is to measure the turbine blade’s accelerations with a non-contact sensor, such as a laser vibrometer. In this case study, a lightweight accelerometer (7.5 g) was used to measure the resonant frequencies of a short turbine blade (20.4 g). This was contrasted with measurements made with Polytec’s VibroGo® (laser vibrometer).
Procedure
The laser vibrometer was operated in the velocity setting because it is one of the base measurements. The other is displacement. Velocity is preferred because it has a flatter frequency response due to the scaling factor between acceleration, velocity, and displacement. Acceleration increases with frequency, displacement decreases, and velocity stays relatively flat. We determined to use the velocity setting to avoid any lag or errors in the data processing.
The smallest bandwidth (1kHz) and the smallest velocity range (1m/s) that did not result in an overloading error were used for the test.
Finally, the laser vibrometer was used at an optimal stand-off distance. The vibrometer we used had a basic stand-off distance of 463mm + (183mm * n). We set the vibrometer at 877mm from the tip of the turbine blade (Figure 1).
Laser Vibrometer Settings
| Bandwidth | High pass filter | Velocity range | Sensitivity | Optimal stand-off distance |
| 1 kHz | 13 Hz | 1 m/s | 250 mm/s/V | 877 mm |
A flat 1G sine sweep from 50 to 500Hz was conducted on the turbine blade at a 1-oct/min sweep rate. The test was conducted with and without mass loading.
In the first test, an accelerometer was attached to the end of the turbine blade (mass loading situation) to measure the resonances of the turbine blade. Simultaneously, the vibrometer was collecting data from the end of the turbine blade (Figure 2).
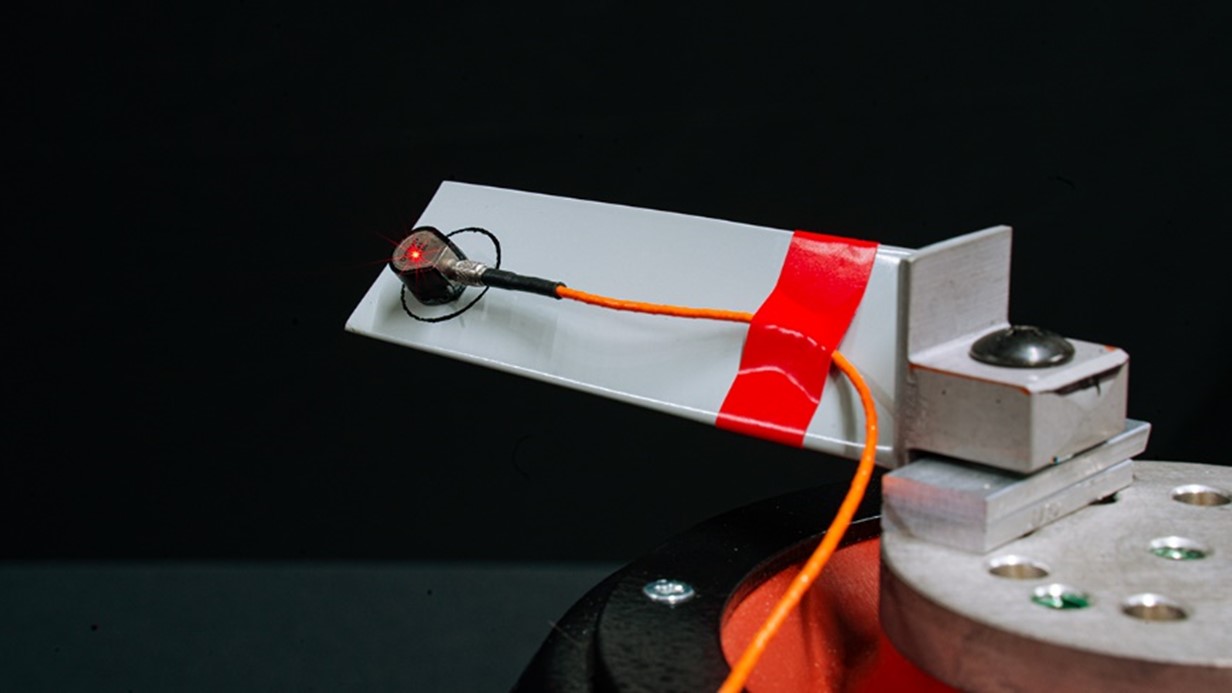
Figure 2. Turbine blade with an accelerometer attached to the tip. The laser’s light on the accelerometer shows that the VibroGo® (laser vibrometer) was measuring the accelerations of the turbine blade simultaneously.
In the second test, the accelerometer was removed (no mass loading) and the vibrometer collected the vibration data from the end of the turbine blade (Figure 3).
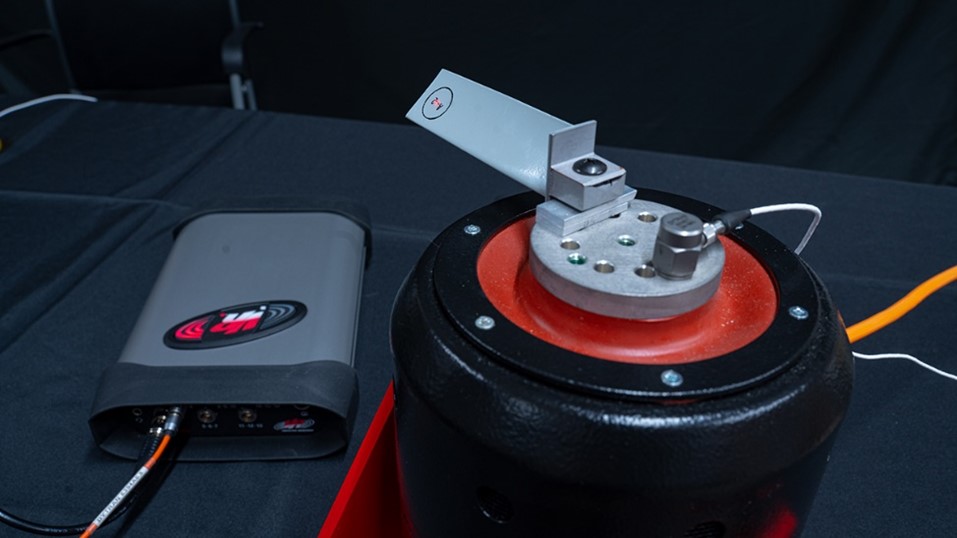
Figure 3. Turbine blade without accelerometer attached to the tip. The laser light on the accelerometer shows the VibroGo® (laser vibrometer) measuring the acceleration of the turbine blade.
The results of these tests were compared to confirm that the laser vibrometer could collect the same data as the accelerometer and confirm the effect of mass loading on a resonant beam.
Results
A flat 1G sine sweep test was conducted on the turbine blade, sweeping down from 500Hz to 30Hz at a 1-oct/min sweep rate. Several resonances were detected during this sine test. Both the accelerometer and the vibrometer were able to detect the same resonances (Figure 4).
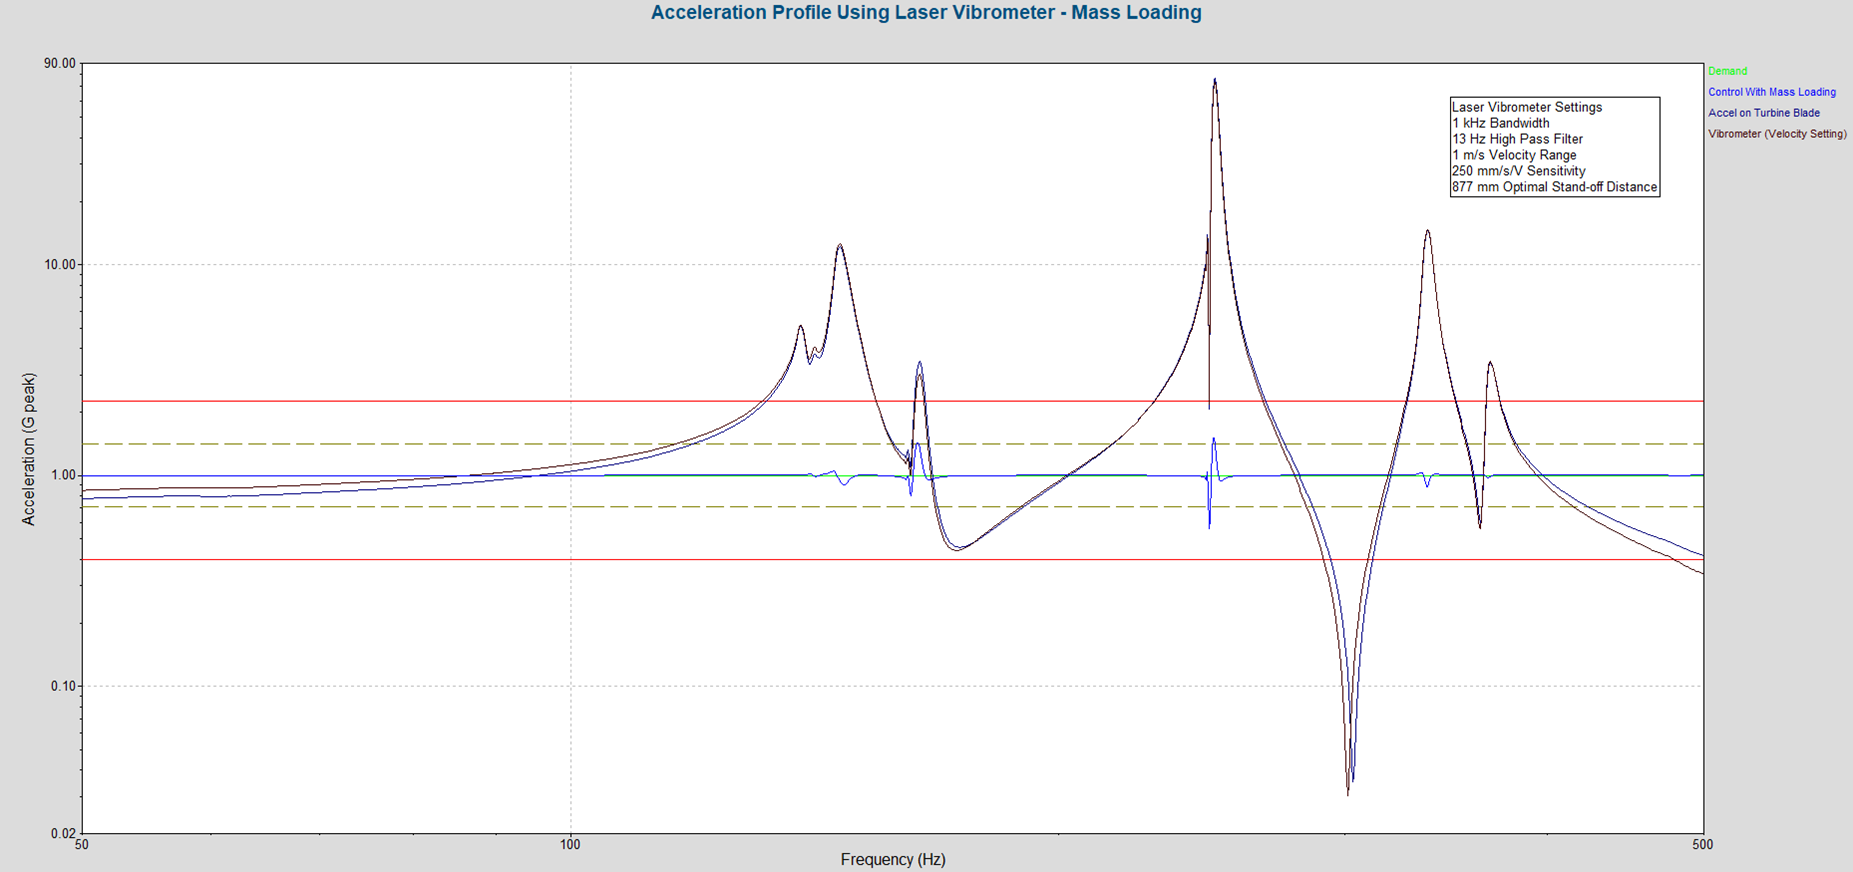
Figure 4. Accelerometer and laser vibrometer data are compared for a vibrating turbine blade. The sensors detect the same resonances in the turbine blade.
The results of the testing demonstrate that mass loading causes a downward shift in the resonances of the turbine blade (Figure 5).
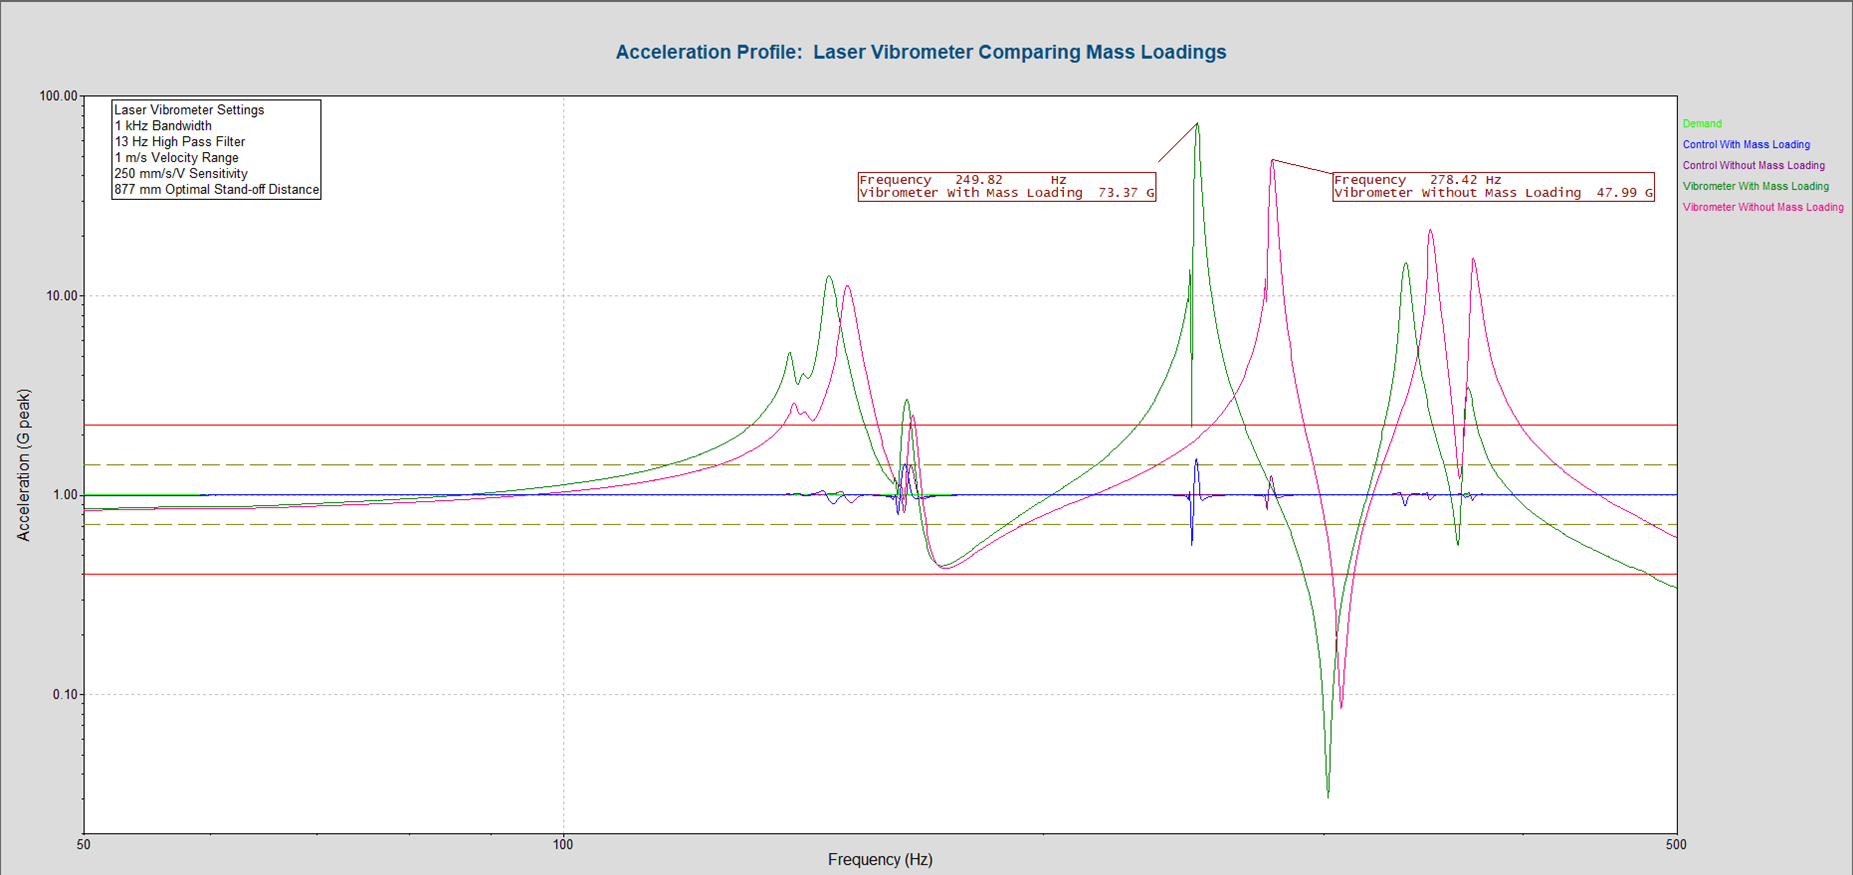
Figure 5. Laser vibrometer data for a vibrating turbine blade are compared. The vibrometer data for the turbine blade with a mass on the end of the turbine blade have a lower resonant frequency than without the mass on the end of the turbine blade.
The results also show that the controller was able to control better within tolerances when there was no mass on the turbine blade (Figure 6). Mass loading makes controlling through resonances more difficult.
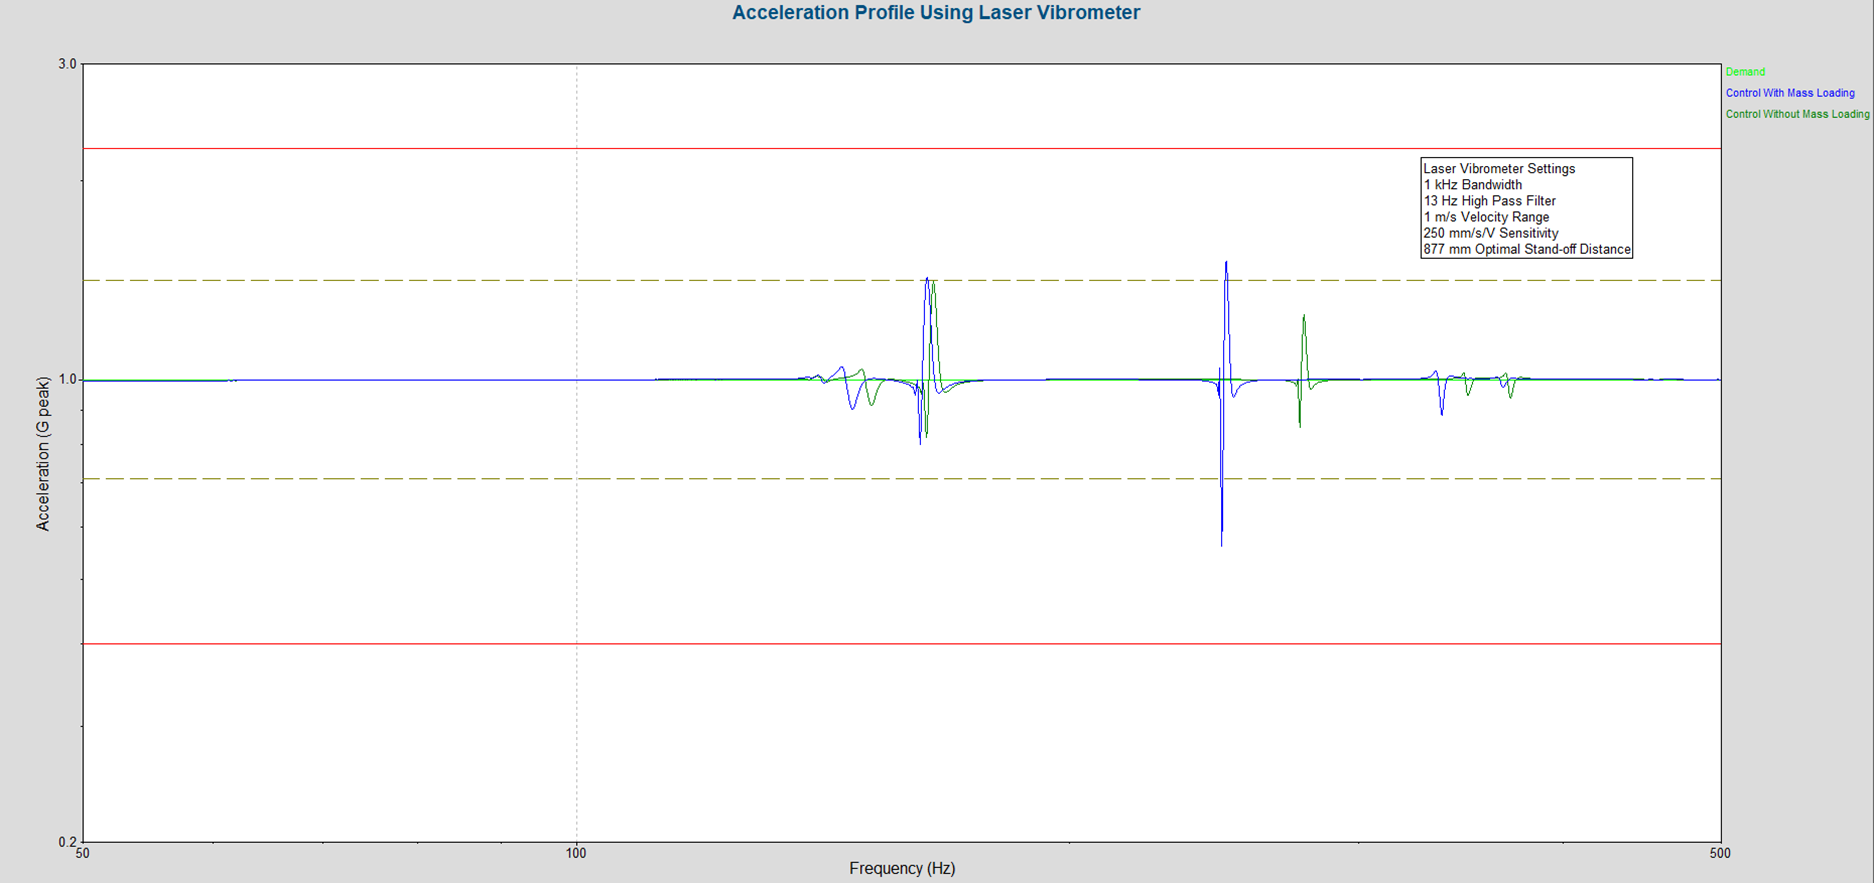
Figure 6. The control signal falls into tolerance better when there is no mass loading.
Conclusion
The results of this study demonstrate three things. First, the results show that a laser vibrometer can produce the same measurements as a traditional accelerometer. Second, the results show that mass loading is in fact an issue that engineers must face. The resonant frequencies of the turbine blade changed when the accelerometer was removed. Finally, the results show that a non-contact sensor, such as a laser vibrometer, can be used accurately to determine the resonant frequencies of a DUT that is particularly susceptible to mass loading issues. When using the non-contact sensor to accurately determine the resonant frequencies of the DUT, the controller will also be able to control through the resonances better than when the turbine blade is affected by mass-loading issues.