Introduction
Vibration Research (VR) recently engaged with a team of students from Western Michigan University (WMU) to assist in CubeSat vibration testing. The initial set of tests, described below in detail, was run on a single component: an off-the-shelf spectrometer. We look forward to future testing as the project moves forward.
CubeSats are very small satellites, built to standard dimensions and launched as auxiliary payloads, essentially hitchhiking into space with something large and very expensive, like a telecommunications satellite, or fitting into some extra space on a resupply mission to the International Space Station.
WMU is participating in the University Nanosatellite Program, sponsored by the Air Force Research Laboratory, where teams from colleges across the country design and build experimental CubeSats. CubeSat projects serve as a vehicle for teams of engineering students, guided by faculty, to work on real projects that both harness creativity and deliver lessons that only come from actual design-build-test experiences. As a bonus, the best CubeSat projects deliver new capabilities to the space industry.
Western Aerospace Launch Initiative, or WALI, is a student-run WMU organization; it began with high-altitude balloon launches and has now progressed to the design of an advanced CubeSat focused on spacecraft propulsion system monitoring and analysis.
Using commercially available technology, like the tested spectrometer, is an effective approach to staying within tight budget constraints. Space-qualified spectrometers are extremely expensive, on the order of $100K each; off-the-shelf spectrometers cost significantly less, though still representing a significant portion of the WALI project budget.
The budget advantages are, however, meaningless without confidence that the off-the-shelf technology can survive a launch. Vibration testing is clearly required to establish mission viability, but it comes with its own risks. If the testing breaks a selected commercial device, there are budget and schedule impacts a university program can ill afford.
Fortunately, the spectrometer continued to function properly after the vibration tests, an important step for the WALI CubeSat project.
Testing to a NASA standard
The spectrometer vibration tests implemented NASA-STD-7001B, a standard designed to verify the survivability of spaceflight payload hardware. The test profile is specified in Table 1, page 22, of the standard. See this paper’s Table 1, below.
20 Hz @ 0.01 g2/Hz
20 to 80 Hz @ +3 dB/oct
80 to 500 Hz @ 0.04 g2/Hz
500 to 2000 Hz @ -3dB/oct
2000 Hz @ 0.01 g2/Hz
Overall Level = 6.8 grms
The test duration was set at 2 minutes, which is the Qualification Test Duration specified on page 22 of the standard.
NASA-STD-7001B is used for payload testing when the actual launch vehicle has not yet been determined. When the launch vehicle is known, a test profile specific to that launch vehicle is used for testing. As the WALI CubeSat project proceeds, future testing may involve a launch vehicle-specific test profile.
Testing Process
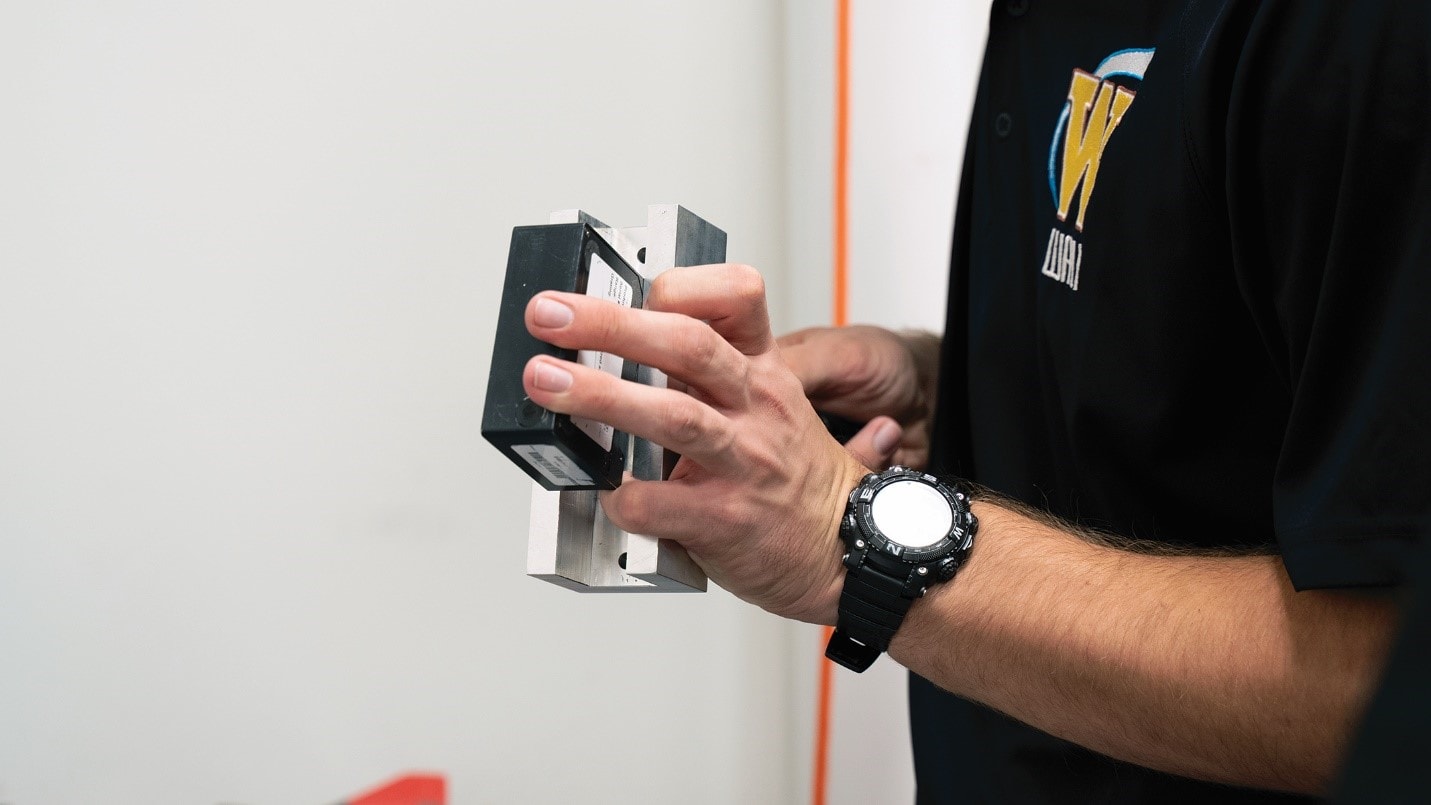
Inserting the spectrometer into a shaker fixture.
The tested spectrometer is an Ocean Optics Flame-S. It was selected because its wavelength range (300nm to 1,000nm) captures the peak emission wavelengths from the propulsion system that will be monitored in space during the WALI CubeSat experiment. Students designed and milled aluminum shaker fixtures for the spectrometer, to hold it firmly on the shaker head for random vibration tests along all three axes.
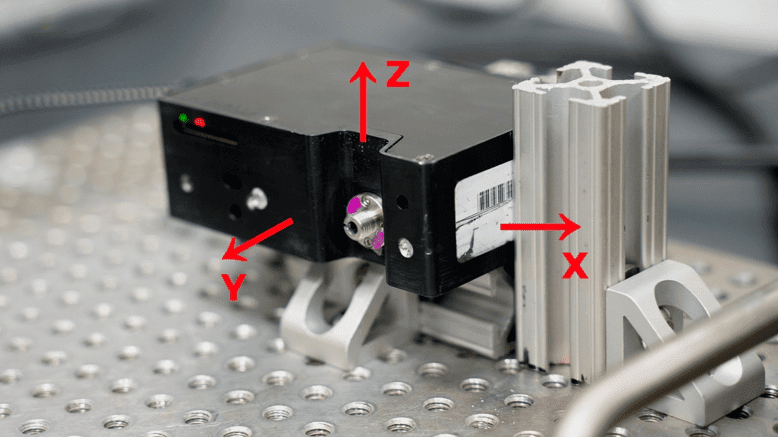
The spectrometer on light frequency test apparatus, with vibration test axes.
The students used VR’s VibrationVIEW software to input the NASA standard test profile from Table 1. Using this profile, a test was run first on the z-axis and the results were collected. After completing the vibration test, the spectrometer was removed from the shaker fixture and attached to another testing apparatus, where light sources with precise frequency outputs were used to determine if the spectrometer’s measurements varied from pre-vibration readings. This testing was repeated for the other two axes.
Testing Results
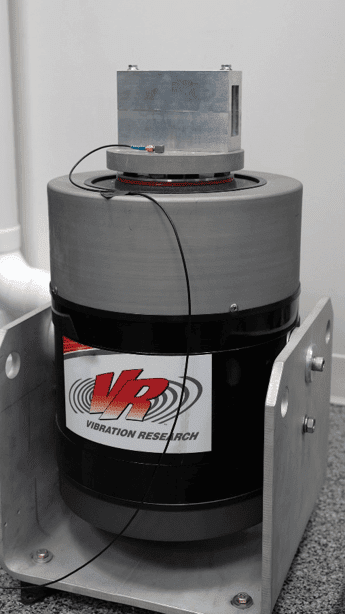
Spectrometer within a fixture mounted on the shaker.
Most significantly, the spectrometer survived the vibration testing. The vibration testing results closely matched the test profile requirements. Even the variations at the higher frequencies are well within the expected range.
See Figure 4 for the acceleration spectral density (more generally referred to as the power spectral density, or PSD) graph of the z-axis test. Graphs for the x- and y-axis vibration tests are almost identical.
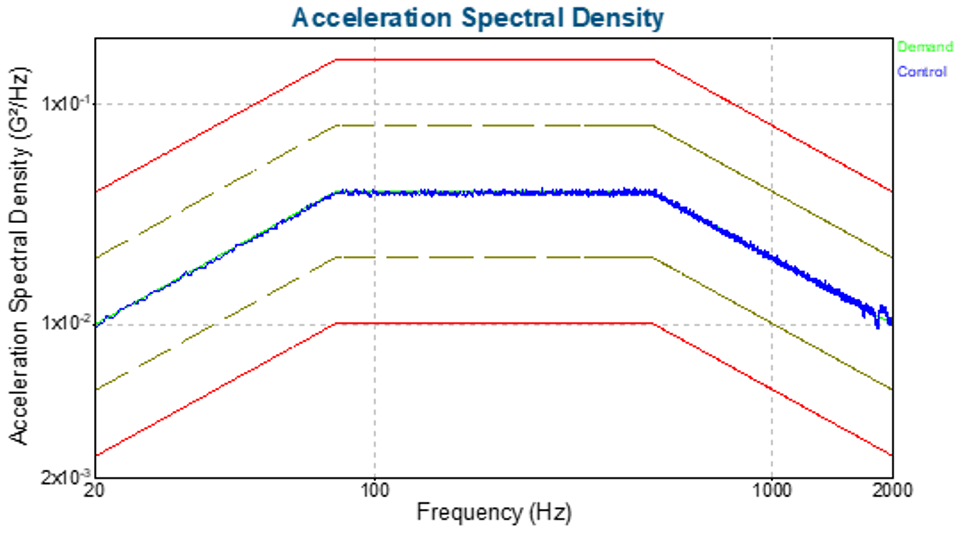
Graph 1. Measured ASD for the spectrometer z-axis test.
A VibrationVIEW feature called iDOF™ (Instant Degrees of Freedom) was turned on for these short-duration random vibration tests. In a PSD there are two sources of error: control error and estimation error. The inherent nature of randomness means the estimation error is significant in the early stages of a test, creating an initially jagged, high-variance plot that obscures what is really occurring during the test. iDOF is a statistically valid approach to removing the estimation error and quickly creating an accurate PSD, suitable for short-duration tests. See Appendix A for more details.
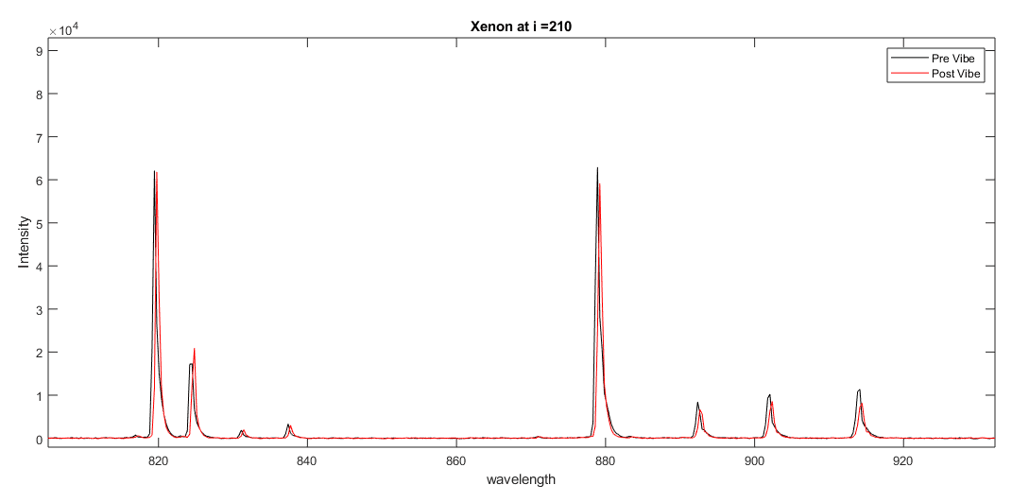
Graph 2. Spectrometer light frequency measurements using the Xeon gas lamp.
The light frequency measurements, taken after the vibration tests, used three varying gas discharge lamps, xenon, mercury, and neon-argon. All tests consistently exhibited a positive shift in wavelength for the post-vibration test data, with deviations ranging from 0.1nm to 1.5nm. Measurements varying by such small amounts from the pre-vibration testing results are well within a range that can be adjusted during operation in space. See Graph 2 for the light frequency results after the Xenon gas lamp testing.
Moving Forward
Having demonstrated that the spectrometer will survive a launch, the next major phase in the WALI CubeSat project is to create an operating configuration on a lab bench. Called a “flatsat,” it is used for comprehensive testing of all the project components and their interactions before they are integrated into the CubeSat structure. Operational issues will be resolved, followed by re-testing, until the team is satisfied with the system design and performance.
At this point, the flatsat components will be assembled and connected within a 6U CubeSat structure before undergoing another round of tests. The vibrations tests at this project stage will involve placing the CubeSat in a launch payload structure with other CubeSats or mass simulators.
Acknowledgments
Dr. Jennifer Hudson and Dr. Kristina Lemmer are the WALI faculty advisors, providing organizational guidance and technical advice to the WMU CubeSat team.
Ravenna Pattern & Manufacturing in Ravenna, MI graciously made their machine tool facility available for machining the shaker fixtures used during the vibration tests.
APPENDIX A
Short-duration Random Vibration Testing
Aerospace tests typically use high levels of random vibration for a very brief period of time; these short-duration, high-amplitude tests are representative of launch and take-off events. During these tests, the most effective analysis tool is a PSD graph that displays across a frequency range.
An underlying problem is that a PSD is created by separating time-domain data into a series of frames, moving to the frequency domain by calculating the fast Fourier transform (FFT) for each frame, and then averaging the power values of the FFTs. In a PSD there are two sources of error: control error and estimation error. Control error refers to the discrepancy between the actual PSD of the data (signal) and the desired demand PSD. Estimation error refers to the discrepancy between the estimated, plotted PSD, and the actual PSD of the signal.
The inherent nature of randomness means that there is statistical variance in the PSD, creating the estimation error, that is gradually reduced as more data frames are captured and contribute to the calculation. This takes extra time, something engineers don’t have in a short-duration test.
Fortunately, there is a statistically valid approach to quickly creating an accurate PSD. In a random test, the variance is based on Chi-squared distribution. Using this statistical understanding, the variance can be calculated and taken out of the PSD plot, essentially removing the estimation error. This approach delivers a smooth but accurate PSD, preserving control error so that an engineer has an accurate view of the device under test’s behavior.
iDOF is an optional module in the VibrationVIEW software suite. It uses an advanced algorithm to deliver accurate and low-variance PSD estimates during vibration testing that are calculated more quickly than those using traditional averaging. iDOF removes the estimation error while displaying the control error, which is the true difference between the PSD of the signal and the demand PSD.